

Automated differential diagnosis of dementia syndromes using FDG PET and machine learning
- PMID: 36408106
- PMCID: PMC9667048
- DOI: 10.3389/fnagi.2022.1005731
Automated differential diagnosis of dementia syndromes using FDG PET and machine learning
Abstract
Background: Metabolic brain imaging with 2-[18F]fluoro-2-deoxy-D-glucose positron emission tomography (FDG PET) is a supportive diagnostic and differential diagnostic tool for neurodegenerative dementias. In the clinic, scans are usually visually interpreted. However, computer-aided approaches can improve diagnostic accuracy. We aimed to build two machine learning classifiers, based on two sets of FDG PET-derived features, for differential diagnosis of common dementia syndromes.
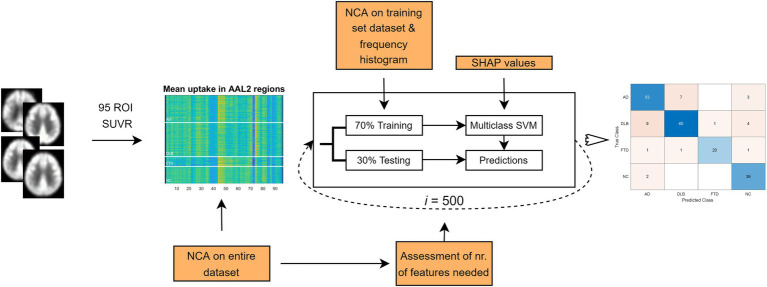
Methods: We analyzed FDG PET scans from three dementia cohorts [63 dementia due to Alzheimer's disease (AD), 79 dementia with Lewy bodies (DLB) and 23 frontotemporal dementia (FTD)], and 41 normal controls (NCs). Patients' clinical diagnosis at follow-up (25 ± 20 months after scanning) or cerebrospinal fluid biomarkers for Alzheimer's disease was considered a gold standard. FDG PET scans were first visually evaluated. Scans were pre-processed, and two sets of features extracted: (1) the expressions of previously identified metabolic brain patterns, and (2) the mean uptake value in 95 regions of interest (ROIs). Two multi-class support vector machine (SVM) classifiers were tested and their diagnostic performance assessed and compared to visual reading. Class-specific regional feature importance was assessed with Shapley Additive Explanations.
Results: Pattern- and ROI-based classifier achieved higher overall accuracy than expert readers (78% and 80% respectively, vs. 71%). Both SVM classifiers performed similarly to one another and to expert readers in AD (F1 = 0.74, 0.78, and 0.78) and DLB (F1 = 0.81, 0.81, and 0.78). SVM classifiers outperformed expert readers in FTD (F1 = 0.87, 0.83, and 0.63), but not in NC (F1 = 0.71, 0.75, and 0.92). Visualization of the SVM model showed bilateral temporal cortices and cerebellum to be the most important features for AD; occipital cortices, hippocampi and parahippocampi, amygdala, and middle temporal lobes for DLB; bilateral frontal cortices, middle and anterior cingulum for FTD; and bilateral angular gyri, pons, and vermis for NC.
Conclusion: Multi-class SVM classifiers based on the expression of characteristic metabolic brain patterns or ROI glucose uptake, performed better than experts in the differential diagnosis of common dementias using FDG PET scans. Experts performed better in the recognition of normal scans and a combined approach may yield optimal results in the clinical setting.
Keywords: FDG PET; dementia; differential diagnosis; machine learning; visual reading.
Copyright © 2022 Perovnik, Vo, Nguyen, Jamšek, Rus, Tang, Trošt and Eidelberg.
Conflict of interest statement
The authors declare that the research was conducted in the absence of any commercial or financial relationships that could be construed as a potential conflict of interest.
Figures


Similar articles
-
Combined 18F-FDG PET-CT markers in dementia with Lewy bodies.Alzheimers Dement (Amst). 2023 Dec 22;15(4):e12515. doi: 10.1002/dad2.12515. eCollection 2023 Oct-Dec. Alzheimers Dement (Amst). 2023. PMID: 38145190 Free PMC article.
-
Evaluating 2-[18F]FDG-PET in differential diagnosis of dementia using a data-driven decision model.Neuroimage Clin. 2020;27:102267. doi: 10.1016/j.nicl.2020.102267. Epub 2020 Apr 24. Neuroimage Clin. 2020. PMID: 32417727 Free PMC article.
-
Brain 18 F-FDG-PET and an optimized cingulate island ratio to differentiate Lewy body dementia and Alzheimer's disease.J Neuroimaging. 2023 Mar;33(2):256-268. doi: 10.1111/jon.13068. Epub 2022 Dec 12. J Neuroimaging. 2023. PMID: 36465027
-
Brain [F-18]FDG PET for Clinical Dementia Workup: Differential Diagnosis of Alzheimer's Disease and Other Types of Dementing Disorders.Semin Nucl Med. 2021 May;51(3):230-240. doi: 10.1053/j.semnuclmed.2021.01.002. Epub 2021 Feb 2. Semin Nucl Med. 2021. PMID: 33546814 Review.
-
Molecular and Anatomical Imaging of Dementia With Lewy Bodies and Frontotemporal Lobar Degeneration.Semin Nucl Med. 2021 May;51(3):264-274. doi: 10.1053/j.semnuclmed.2020.12.002. Epub 2021 Jan 2. Semin Nucl Med. 2021. PMID: 33402272 Review.
Cited by
-
An artificial intelligence-derived metabolic network predicts psychosis in Alzheimer's disease.Brain Commun. 2025 Apr 25;7(3):fcaf159. doi: 10.1093/braincomms/fcaf159. eCollection 2025. Brain Commun. 2025. PMID: 40599906 Free PMC article.
-
Combined 18F-FDG PET-CT markers in dementia with Lewy bodies.Alzheimers Dement (Amst). 2023 Dec 22;15(4):e12515. doi: 10.1002/dad2.12515. eCollection 2023 Oct-Dec. Alzheimers Dement (Amst). 2023. PMID: 38145190 Free PMC article.
-
Metal Toxicity and Dementia Including Frontotemporal Dementia: Current State of Knowledge.Antioxidants (Basel). 2024 Aug 1;13(8):938. doi: 10.3390/antiox13080938. Antioxidants (Basel). 2024. PMID: 39199184 Free PMC article. Review.
-
An FDG-PET-Based Machine Learning Framework to Support Neurologic Decision-Making in Alzheimer Disease and Related Disorders.Neurology. 2025 Jul 22;105(2):e213831. doi: 10.1212/WNL.0000000000213831. Epub 2025 Jun 27. Neurology. 2025. PMID: 40577677
-
Functional Brain Networks to Evaluate Treatment Responses in Parkinson's Disease.Neurotherapeutics. 2023 Oct;20(6):1653-1668. doi: 10.1007/s13311-023-01433-w. Epub 2023 Sep 8. Neurotherapeutics. 2023. PMID: 37684533 Free PMC article.
References
-
- Aas K., Jullum M., Løland A. (2021). Explaining individual predictions when features are dependent: more accurate approximations to Shapley values. Artif. Intell. 298:103502. doi: 10.1016/j.artint.2021.103502 - DOI
-
- Association A. (2018). 2018 Alzheimer’s disease facts and figures. Alzheimers Dement. 14, 367–429. doi: 10.1016/j.jalz.2018.02.001 - DOI
LinkOut - more resources
Full Text Sources