. 2022 Nov 17;14(11):e31605.
doi: 10.7759/cureus.31605. eCollection 2022 Nov.

Geographical Distribution of Pancreatic Cancer in the State of Mississippi by Incidence and Mortality From 2003 to 2019

Affiliations

Geographical Distribution of Pancreatic Cancer in the State of Mississippi by Incidence and Mortality From 2003 to 2019

Basil N Nduma et al. Cureus. .

Abstract

Background: Pancreatic cancer can be a very debilitating disease. In the USA and around the world, pancreatic cancer is among the causes of cancer-related deaths. This study aims to highlight mortality and incidence rates of pancreatic cancer by geographic location.

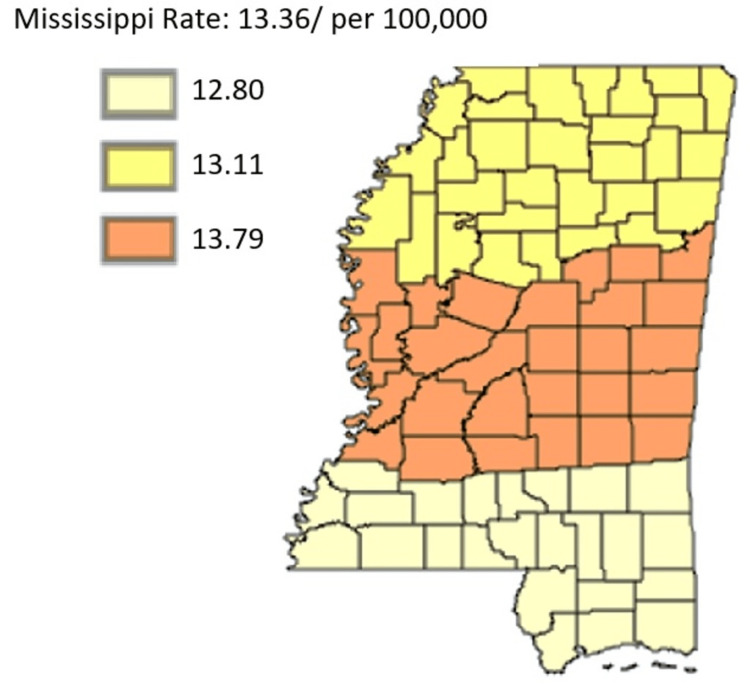
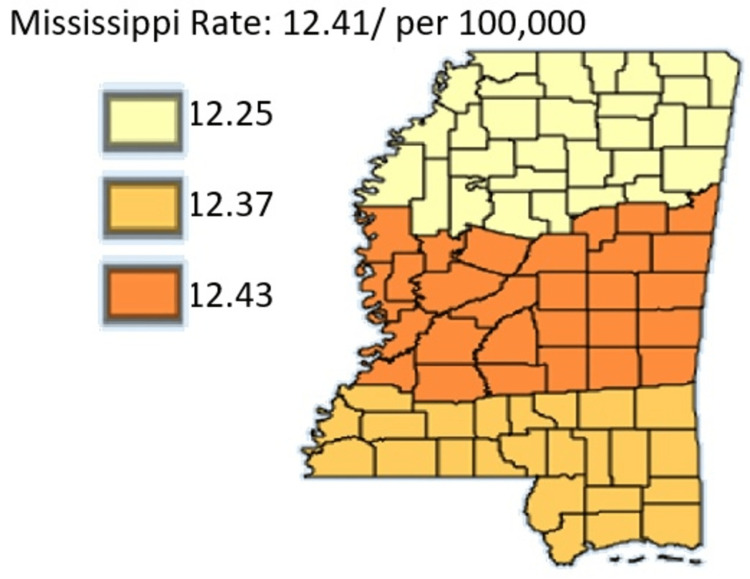
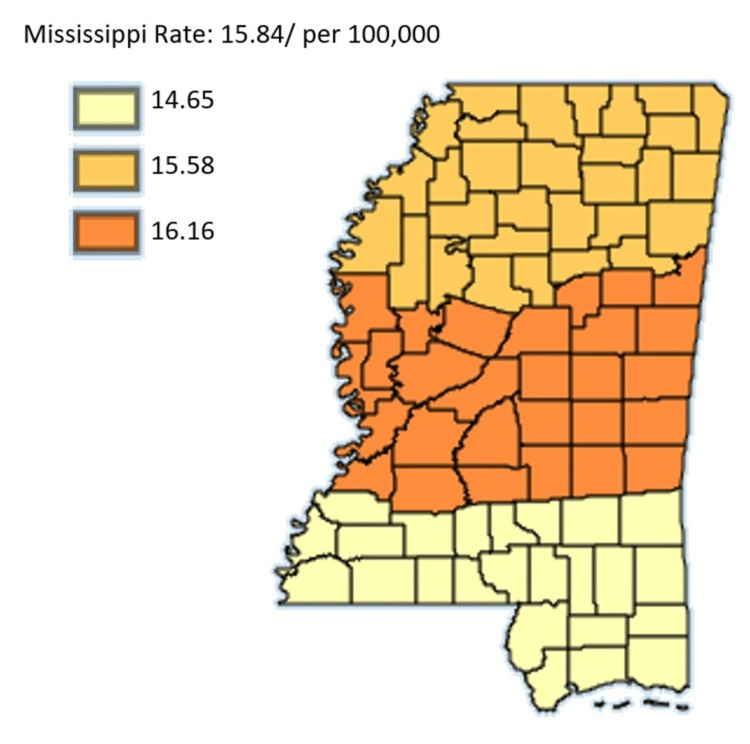
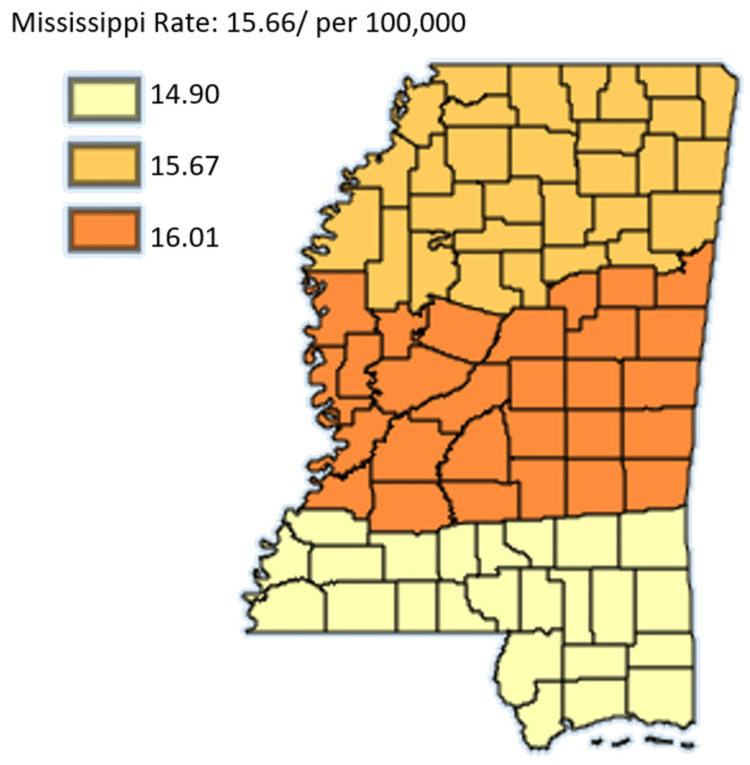
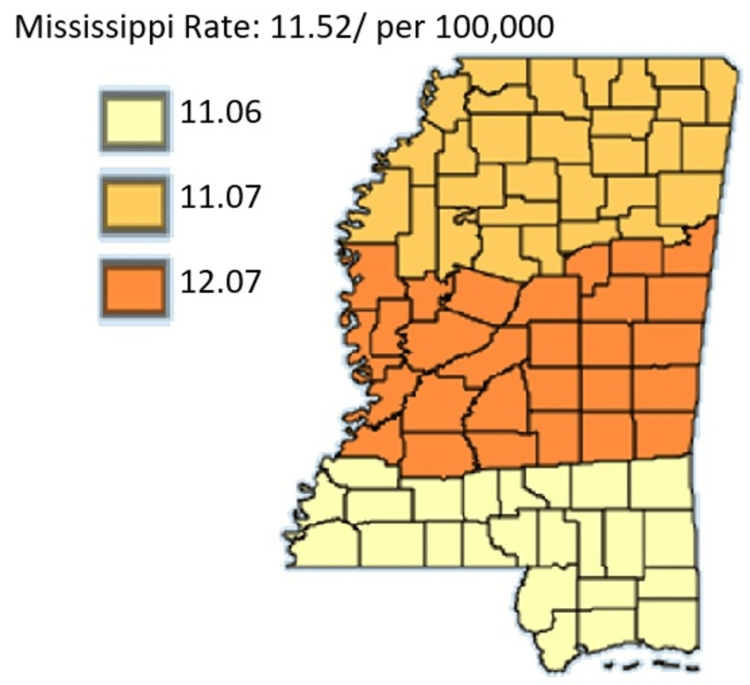
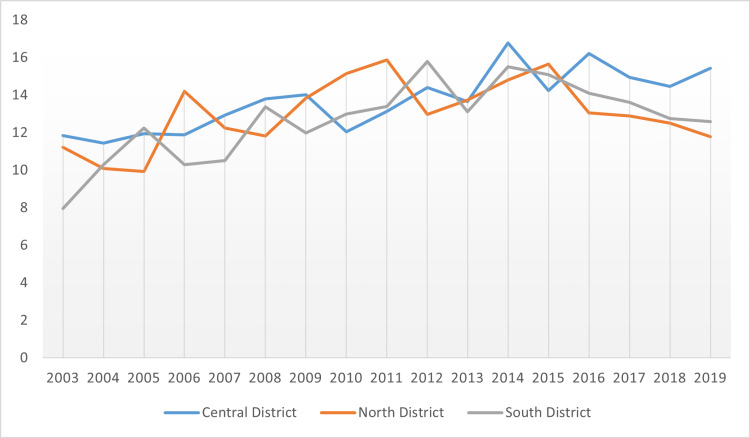
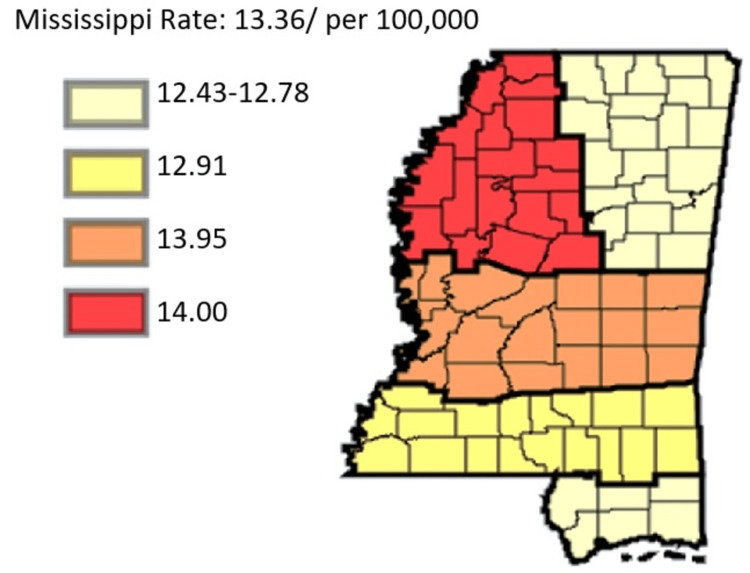
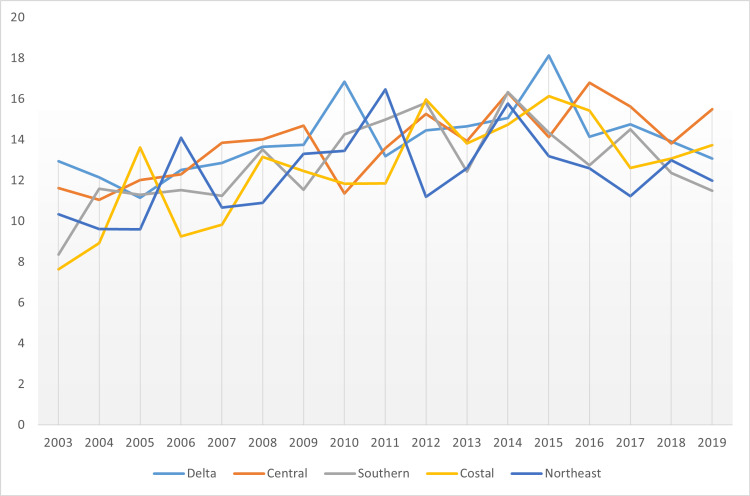
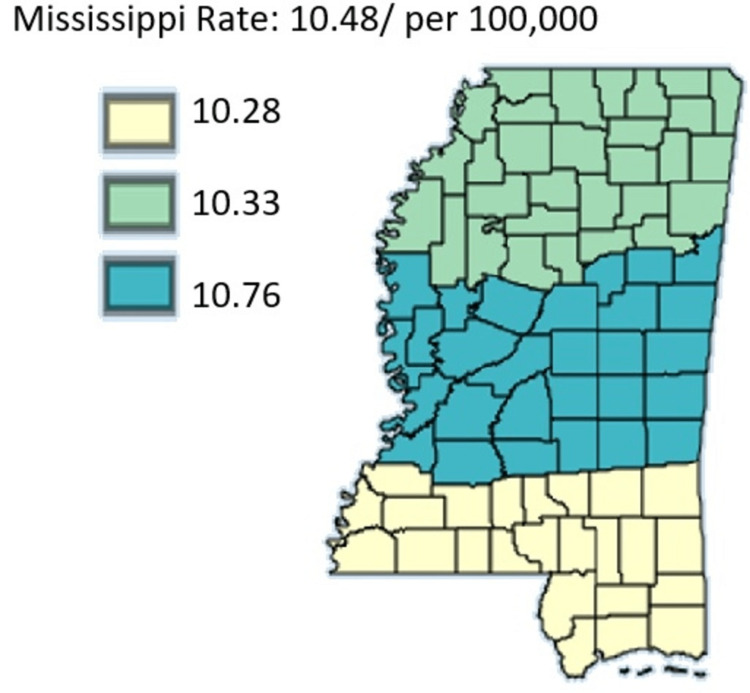
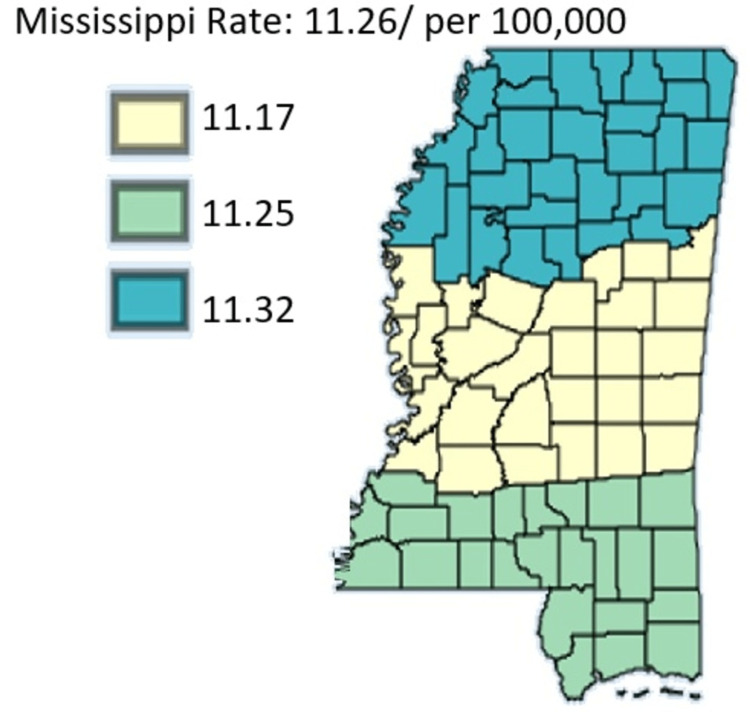
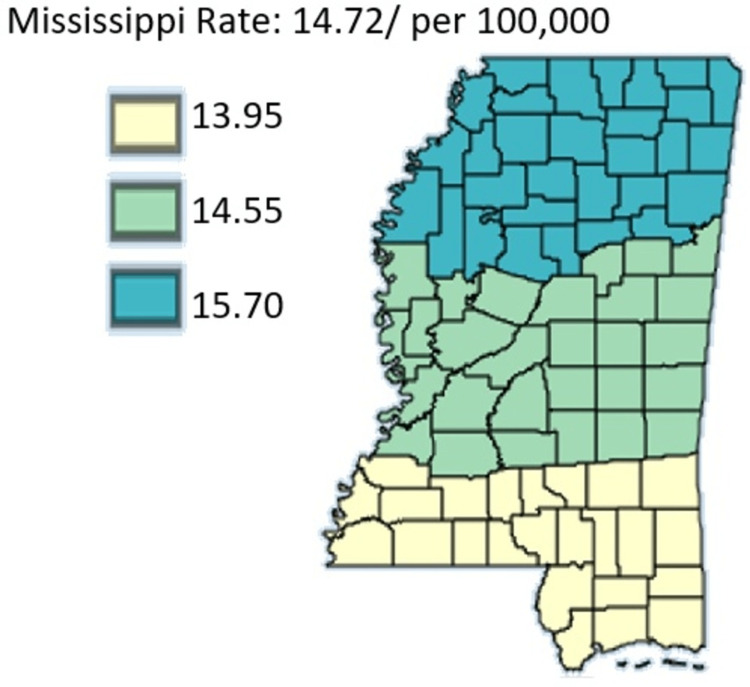
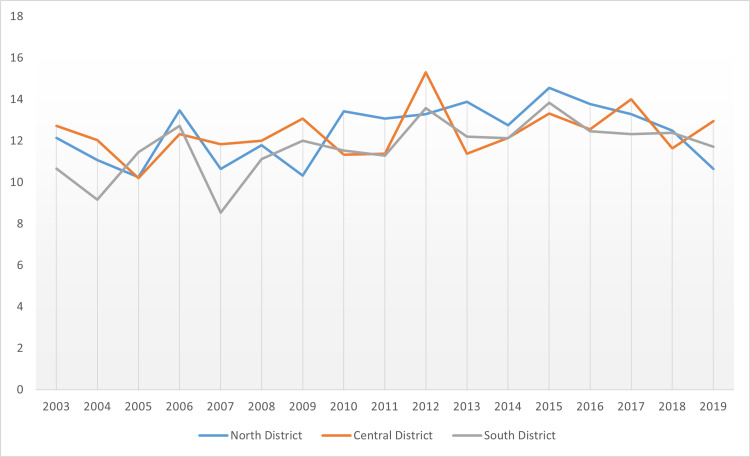
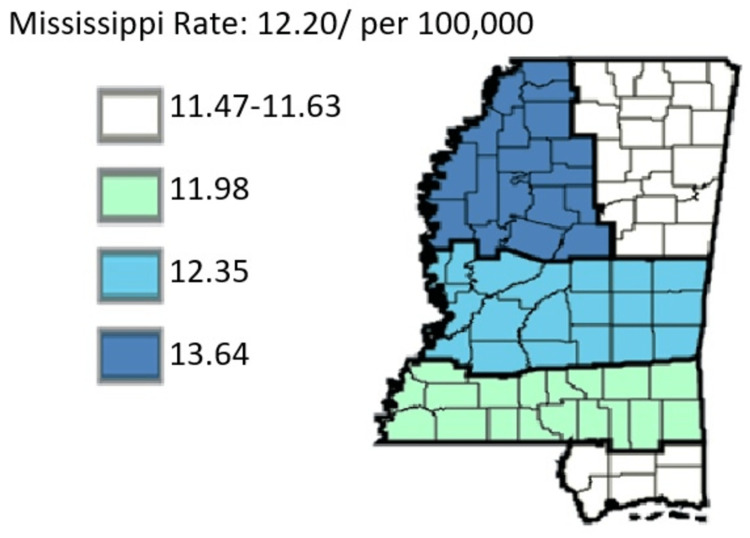
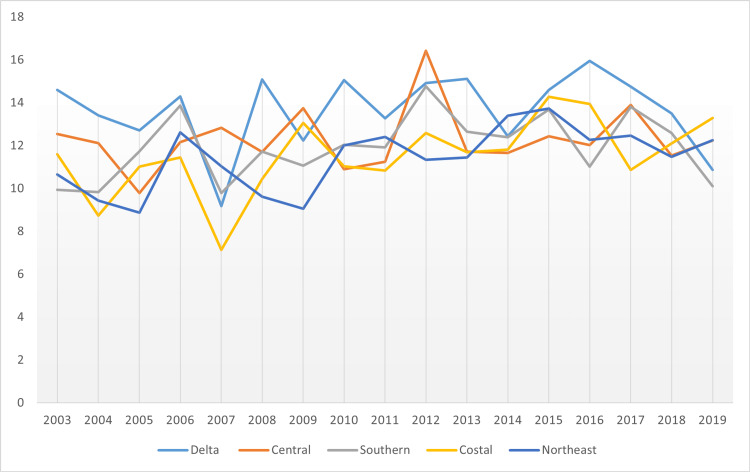
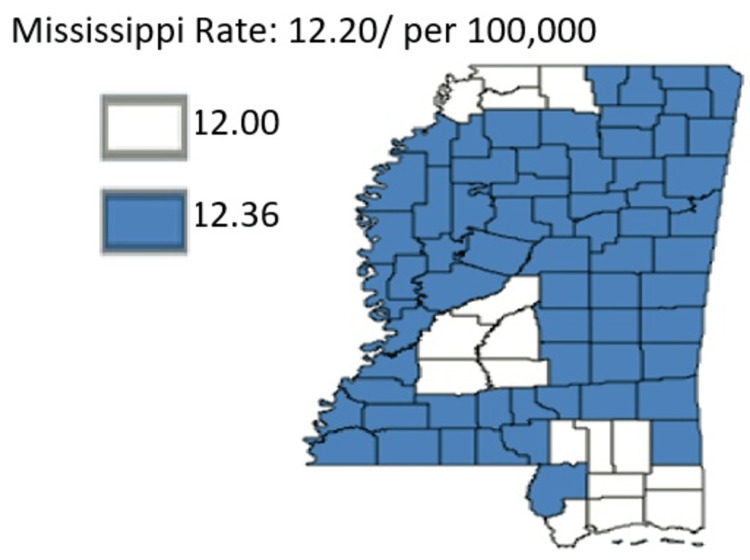
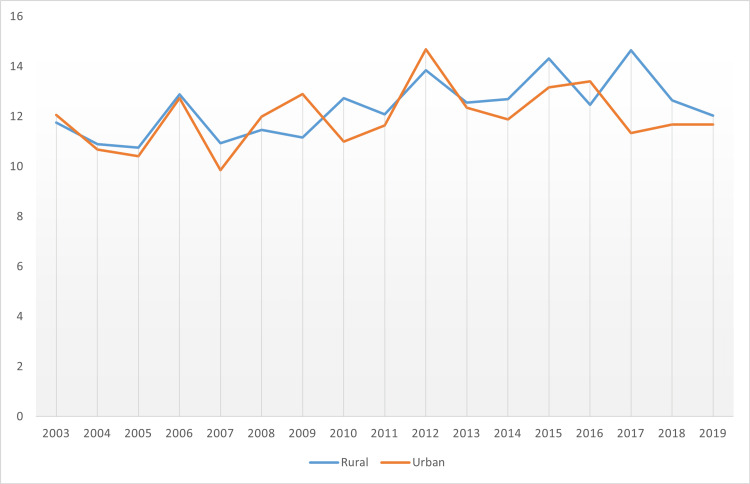
Methods: The study area is the state of Mississippi with a targeted time period between 2003 and 2019. The Mississippi Cancer Registry is the source of data for this study. The subject under investigation was divided into two phases. The first phase involved analyzing data on the incidence rate while the second phase entailed data analysis of the pancreatic cancer mortality rate in Mississippi. In both phases, the focus was on three categories of geographic locations in Mississippi, which include public health districts, the regional cancer coalitions in the state, and the interplay between rural and urban locations. Descriptive and inferential statistical approaches with graphical techniques and tabulations were utilized in data presentation.

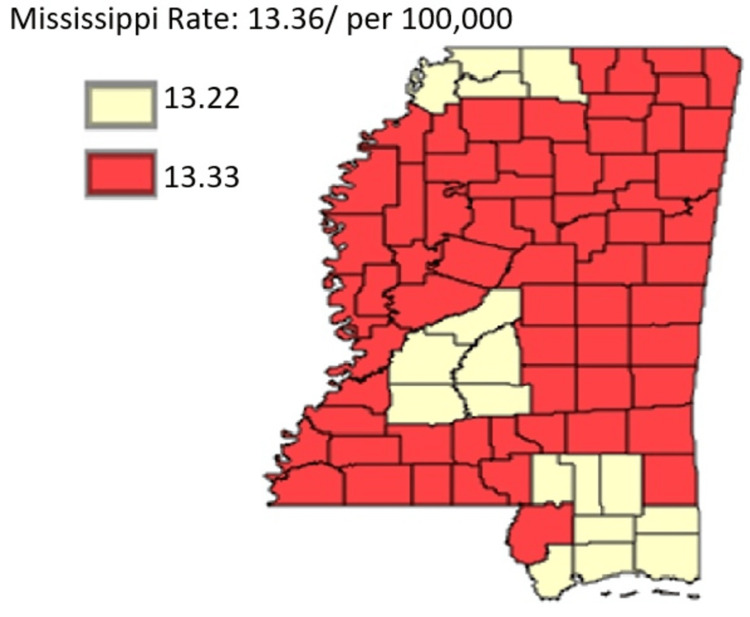
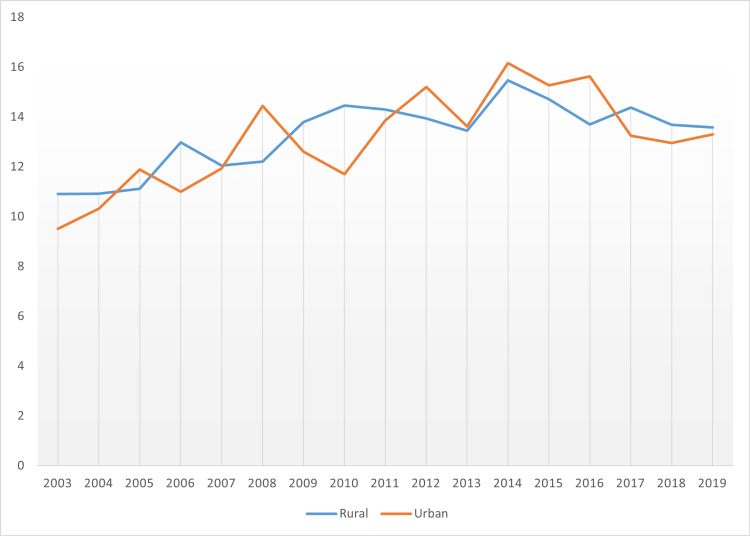
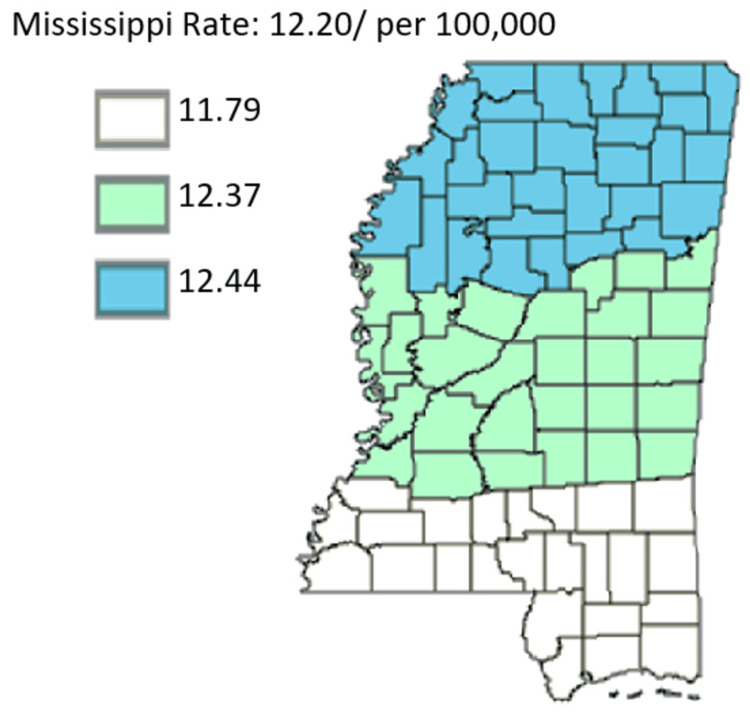
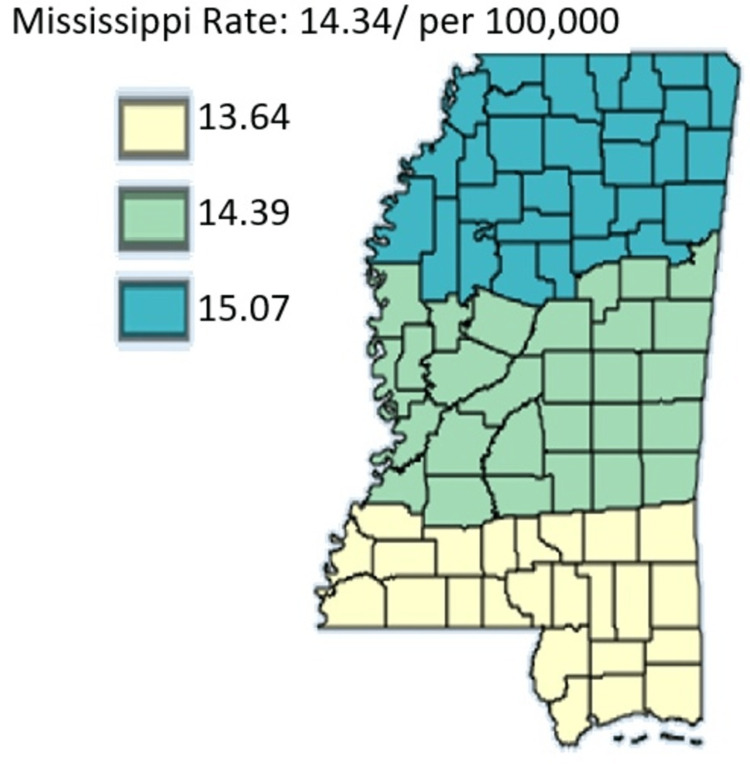
Results: The results of this study demonstrate there are variations in the incidence rates of pancreatic cancer by geographic location in Mississippi. In the data analysis of the Mississippi public health districts, the worst-hit areas include the rural communities in the rural-urban regional analysis, the Delta region among the cancer coalition regions, and the Central District (incidence rates) and North District (mortality rates).

Conclusion: In Mississippi, there is a need for aggressive community-based participation and education. This approach will help improve screening and early detection of pancreatic cancer. Healthcare intake should be boosted and geared toward a reduction in mortality rates. To minimize disparities that eventually lead to differences in disease incidence and mortality from different locations, legislative and non-legislative authorities should advocate for equitable distribution of healthcare resources. An understanding of the geographic distribution of pancreatic cancer in a state will aid in the designation of specific primary prevention measures targeted in the worst-hit communities.

Keywords: cancer coalition region; incidence rate; mortality rate; pancreatic cancer; public health district; rural-urban divide.


Conflict of interest statement

The authors have declared that no competing interests exist.

Figures

Figure 1
Figure 1. Pancreatic Cancer Incidence rate by Public Health Districts in Mississippi state (All genders and races) from 2003 to 2019
Age-adjusted to the 2000 US Standard Million Population. The population estimates for 2005 are adjusted to account for population shifts due to Hurricane Katrina (www.seer.cancer.gov/popdata/)
Figure 2
Figure 2. Pancreatic Cancer Incidence rate by Public Health Districts in Mississippi state in White residents only
Age-adjusted to the 2000 US Standard Million Population. The population estimates for 2005 are adjusted to account for population shifts due to Hurricane Katrina (www.seer.cancer.gov/popdata/)
Figure 3
Figure 3. Pancreatic Cancer Incidence rate by Public Health Districts in Mississippi state in Black Residents only
Age-adjusted to the 2000 US Standard Million Population. The population estimates for 2005 are adjusted to account for population shifts due to Hurricane Katrina (www.seer.cancer.gov/popdata/)
Figure 4
Figure 4. Pancreatic Cancer Incidence rate by Public Health Districts in Mississippi state in male residents only
Age-adjusted to the 2000 US Standard Million Population. The population estimates for 2005 are adjusted to account for population shifts due to Hurricane Katrina (www.seer.cancer.gov/popdata/)
Figure 5
Figure 5. Pancreatic Cancer Incidence rate by Public Health Districts in Mississippi state in female residents only
Age-adjusted to the 2000 US Standard Million Population. The population estimates for 2005 are adjusted to account for population shifts due to Hurricane Katrina (www.seer.cancer.gov/popdata/)
Figure 6
Figure 6. Incidence of pancreatic cancer per Public Health Districts’ comparison in all races and genders from 2003 to 2019
Figure 7
Figure 7. Cancer Coalition Regions’ pancreatic cancer overview
Age-adjusted to the 2000 US Standard Million Population. The population estimates for 2005 are adjusted to account for population shifts due to Hurricane Katrina (www.seer.cancer.gov/popdata/)
Figure 8
Figure 8. Comparison of incidence of pancreatic cancer in Cancer Regional Coalitions
Figure 9
Figure 9. The rural-urban divide in pancreatic cancer incidence
Age-adjusted to the 2000 US Standard Million Population. The population estimates for 2005 are adjusted to account for population shifts due to Hurricane Katrina (www.seer.cancer.gov/popdata/)
Figure 10
Figure 10. A comparative analysis of rural versus urban pancreatic cancer incidence
Figure 11
Figure 11. Age-adjusted mortality rates of pancreatic cancer in Mississippi by public health district from 2003 to 2019 with all genders included
Age-adjusted to the 2000 US Standard Million Population. The population estimates for 2005 are adjusted to account for population shifts due to Hurricane Katrina (www.seer.cancer.gov/popdata/)
Figure 12
Figure 12. Age-adjusted mortality rates of pancreatic cancer in Mississippi by public health district from 2003 to 2019 in males only
Age-adjusted to the 2000 US Standard Million Population. The population estimates for 2005 are adjusted to account for population shifts due to Hurricane Katrina (www.seer.cancer.gov/popdata/)
Figure 13
Figure 13. Age-adjusted mortality rates of pancreatic cancer in Mississippi by public health district from 2003 to 2019 in females only
Age-adjusted to the 2000 US Standard Million Population. The population estimates for 2005 are adjusted to account for population shifts due to Hurricane Katrina (www.seer.cancer.gov/popdata/)
Figure 14
Figure 14. Age-adjusted mortality rates of pancreatic cancer in Mississippi by public health district from 2003 to 2019 in White residents only
Age-adjusted to the 2000 US Standard Million Population. The population estimates for 2005 are adjusted to account for population shifts due to Hurricane Katrina (www.seer.cancer.gov/popdata/)
Figure 15
Figure 15. Age-adjusted mortality rates of pancreatic cancer in Mississippi by public health district from 2003 to 2019 in Black residents only
Age-adjusted to the 2000 US Standard Million Population. The population estimates for 2005 are adjusted to account for population shifts due to Hurricane Katrina (www.seer.cancer.gov/popdata/)
Figure 16
Figure 16. Comparative outcomes of pancreatic cancer mortality by public health district from 2003 to 2019
Figure 17
Figure 17. An overview of pancreatic cancer mortality by the cancer regional coalition
Age-adjusted to the 2000 US Standard Million Population. The population estimates for 2005 are adjusted to account for population shifts due to Hurricane Katrina (www.seer.cancer.gov/popdata/)
Figure 18
Figure 18. Comparative mortality rate outcomes of pancreatic cancer for coalition regions from 2003 to 2019
Figure 19
Figure 19. An overview of pancreatic cancer mortality rural-urban divide of Mississippi state
Age-adjusted to the 2000 US Standard Million Population. The population estimates for 2005 are adjusted to account for population shifts due to Hurricane Katrina (www.seer.cancer.gov/popdata/)
Figure 20
Figure 20. Pancreatic cancer mortality rate in the rural versus urban divide in Mississippi state

Similar articles

Cited by

References

    1. Epidemiology of pancreatic cancer: global trends, etiology and risk factors. Rawla P, Sunkara T, Gaduputi V. World J Oncol. 2019;10:10–27. - PMC - PubMed
    1. Pancreatic cancer: a review of epidemiology, trend, and risk factors. Hu JX, Zhao CF, Chen WB, Liu QC, Li QW, Lin YY, Gao F. World J Gastroenterol. 2021;27:4298–4321. - PMC - PubMed
    1. Screening for pancreatic cancer: US Preventive Services Task Force Reaffirmation Recommendation Statement. Owens DK, Davidson KW, Krist AH, et al. JAMA. 2019;322:438–444. - PubMed
    1. A comprehensive review on pancreatic cancer. Jagadeesan B, Haran PH, Praveen D, Ranadheer CP, Vijey AM. Res J Pharm Technol. 2021;14:552–554.
    1. A systematic assessment of statistics, risk factors, and underlying features involved in pancreatic cancer. Aier I, Semwal R, Sharma A, Varadwaj PK. Cancer Epidemiol. 2019;58:104–110. - PubMed

LinkOut - more resources