

Inhibitory Effects of Rabdosia rubescens in Esophageal Squamous Cell Carcinoma: Network Pharmacology and Experimental Validation
- PMID: 36408344
- PMCID: PMC9671727
- DOI: 10.1155/2022/2696347
Inhibitory Effects of Rabdosia rubescens in Esophageal Squamous Cell Carcinoma: Network Pharmacology and Experimental Validation
Abstract
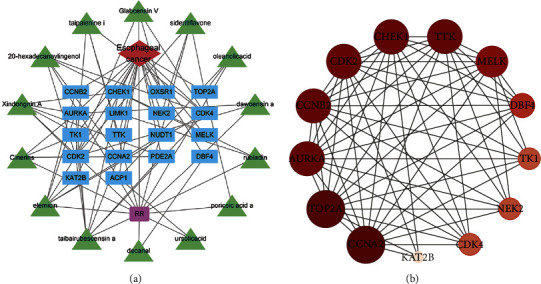
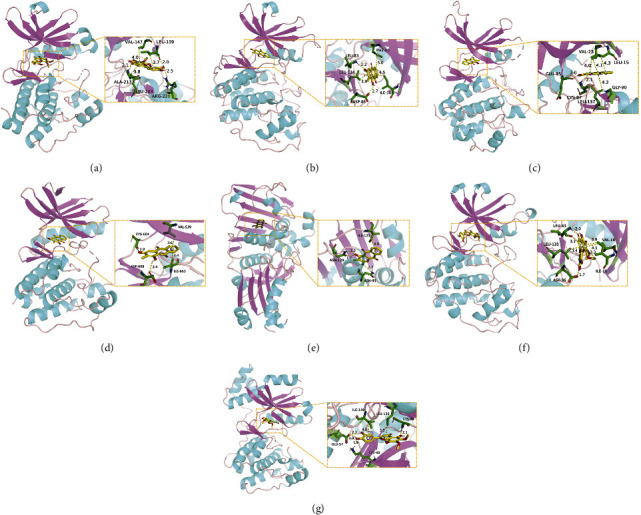
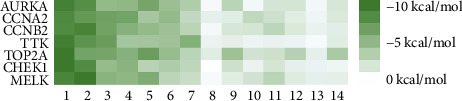
Esophageal squamous cell carcinoma (ESCC) is one of the most frequently occurring diseases in the world. Rabdosia rubescens (RR) has been demonstrated to be effective against ESCC; however, the mechanism is unknown. The primary gene modules related to the clinical characteristics of ESCC were initially investigated in this research using weighted gene co-expression network analysis (WCGNA) and differential expression gene (DEG) analysis. We employed network pharmacology to study the hub genes linked with RR therapy on ESCC. A molecular docking simulation was achieved to identify the binding activity of central genes to RR compounds. Lastly, a chain of experimentations was used to verify the inhibitory effect of RR water extract on the ESCC cell line in vitro. The outcomes revealed that CCNA2, TOP2A, AURKA, CCNB2, CDK2, CHEK1, and other potential central targets were therapeutic targets for RR treatment of ESCC. In addition, these targets are over-represented in several cancer-related pathways, including the cell cycle signaling pathway and the p53 signaling pathway. The predicted targets displayed good bonding activity with the RR bioactive chemical according to a molecular docking simulation. In vitro experiments revealed that RR water extracts could inhibit ESCC cells, induce cell cycle arrest, inhibit cell proliferation, increase P53 expression, and decrease CCNA2, TOP2A, AURKA, CCNB2, CDK2, and CHEK1. In conclusion, our study reveals the molecular mechanism of RR therapy for ESCC, providing great potential for identifying effective compounds and biomarkers for ESCC therapy.
Copyright © 2022 Ruoyang Lin et al.
Conflict of interest statement
The authors declare that there are no conflicts of interest regarding the publication of this paper.
Figures


Similar articles
-
Network pharmacology and molecular docking reveal the mechanisms of curcumin activity against esophageal squamous cell carcinoma.Front Pharmacol. 2024 Apr 3;15:1282361. doi: 10.3389/fphar.2024.1282361. eCollection 2024. Front Pharmacol. 2024. PMID: 38633613 Free PMC article.
-
Identification of Key Modules and Hub Genes Involved in Esophageal Squamous Cell Carcinoma Tumorigenesis Using WCGNA.Cancer Control. 2020 Jan-Dec;27(1):1073274820978817. doi: 10.1177/1073274820978817. Cancer Control. 2020. PMID: 33345608 Free PMC article.
-
Bioinformatics analysis of gene expression profiles of esophageal squamous cell carcinoma.Dis Esophagus. 2017 May 1;30(5):1-8. doi: 10.1093/dote/dow018. Dis Esophagus. 2017. PMID: 28375447
-
Integrative genomics analysis of hub genes and their relationship with prognosis and signaling pathways in esophageal squamous cell carcinoma.Mol Med Rep. 2019 Oct;20(4):3649-3660. doi: 10.3892/mmr.2019.10608. Epub 2019 Aug 23. Mol Med Rep. 2019. PMID: 31485619 Free PMC article.
-
Common gene signatures and key pathways in hypopharyngeal and esophageal squamous cell carcinoma: Evidence from bioinformatic analysis.Medicine (Baltimore). 2020 Oct 16;99(42):e22434. doi: 10.1097/MD.0000000000022434. Medicine (Baltimore). 2020. PMID: 33080677 Free PMC article.
Cited by
-
The Mechanism by Which Cyperus rotundus Ameliorates Osteoarthritis: A Work Based on Network Pharmacology.J Inflamm Res. 2024 Oct 29;17:7893-7912. doi: 10.2147/JIR.S483652. eCollection 2024. J Inflamm Res. 2024. PMID: 39494203 Free PMC article.
References
-
- Rumgay H., Arnold M., Laversanne M., et al. International trends in esophageal squamous cell carcinoma and adenocarcinoma incidence. American Journal of Gastroenterology . 2021;116(5):1072–1076. - PubMed
-
- Allemani C., Matsuda T., Di Carlo V., et al. Global surveillance of trends in cancer survival 2000–14 (CONCORD-3): analysis of individual records for 37 513 025 patients diagnosed with one of 18 cancers from 322 population-based registries in 71 countries. The Lancet . 2018;391(10125):1023–1075. - PMC - PubMed
-
- Guo W., Huang J., Wang N., et al. Integrating network pharmacology and pharmacological evaluation for deciphering the action mechanism of herbal formula zuojin pill in suppressing hepatocellular carcinoma. Frontiers in Pharmacology . 2019;10:p. 1185. doi: 10.3389/fphar.2019.01185. - DOI - PMC - PubMed
LinkOut - more resources
Full Text Sources
Research Materials
Miscellaneous
