. 2022 Nov 4:16:1005972.
doi: 10.3389/fnins.2022.1005972. eCollection 2022.

Ameliorative effect of vanillin on scopolamine-induced dementia-like cognitive impairment in a mouse model

Affiliations

Ameliorative effect of vanillin on scopolamine-induced dementia-like cognitive impairment in a mouse model

Abhinav Anand et al. Front Neurosci. .

Abstract

Background: Alzheimer's disease (AD) is the most common form of dementia, which is among the top five causes of death in the United States. It is a neurodegenerative disorder that causes permanent loss of memory and cognition. The current pharmacotherapy for AD is based on providing symptomatic relief only and has many side effects. There is a need for a safer, disease-modifying drug for the treatment of AD.

Experimental approach: The PASS online software was used to screen phytoconstituents based on their predicted effects on various AD-related targets. Vanillin was selected as the compound of interest, as it has not been researched elaborately on any animal model of AD. The acetylcholinesterase inhibitory activity of vanillin was established in vitro. Thereafter, ameliorative effect of vanillin was evaluated using the exteroceptive memory model in scopolamine-induced cognitive impairment mice model.

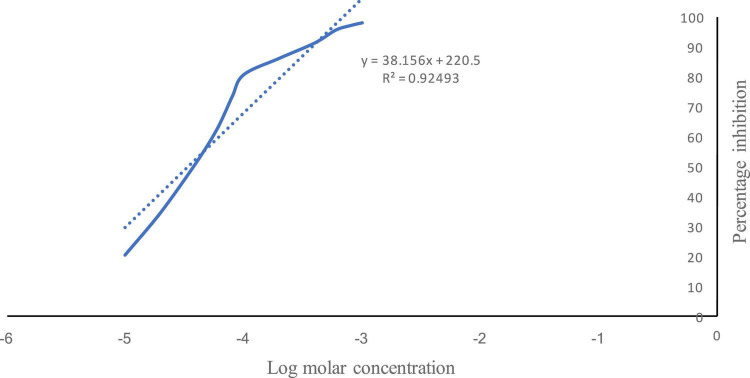
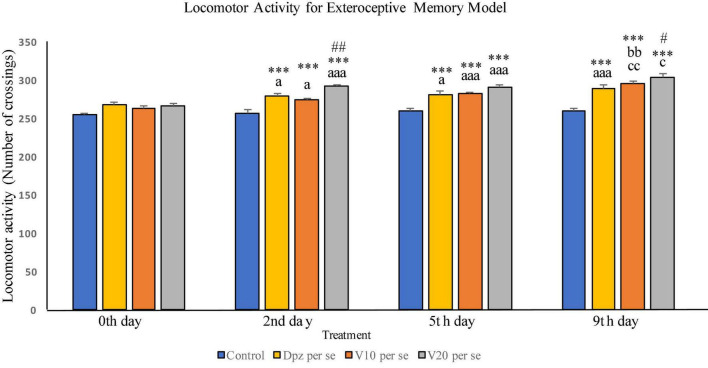
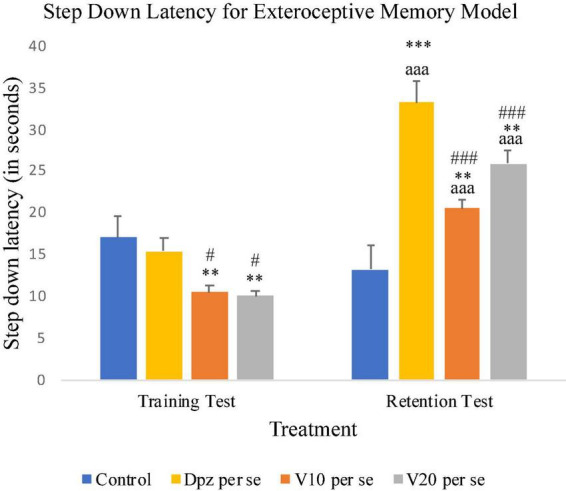
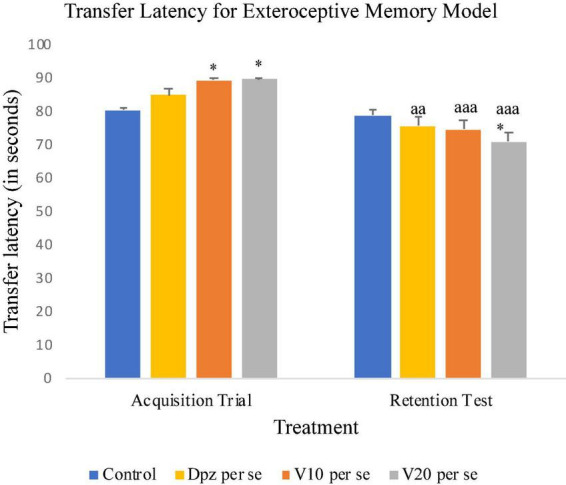
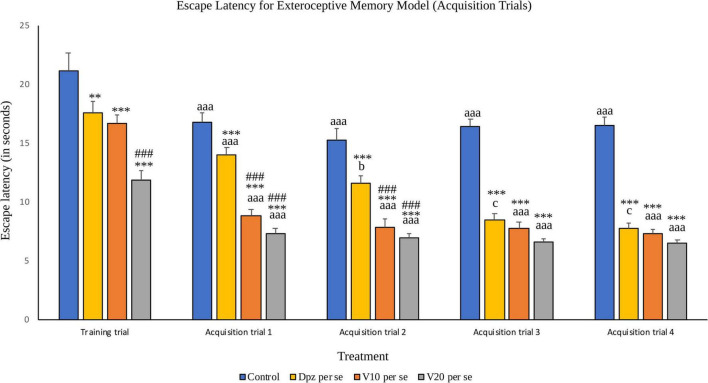
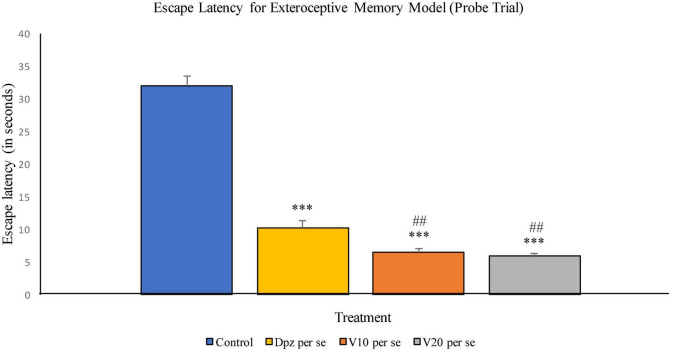
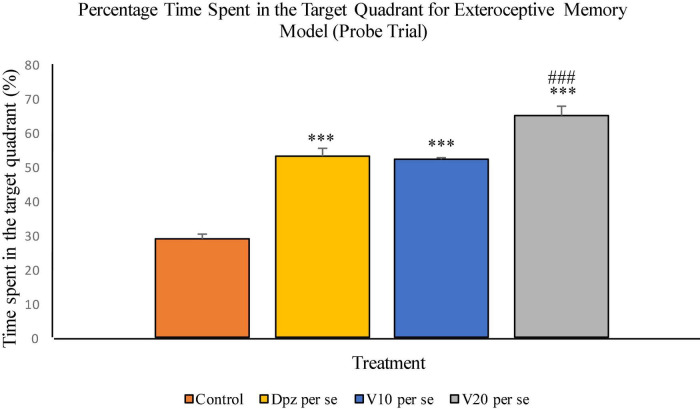
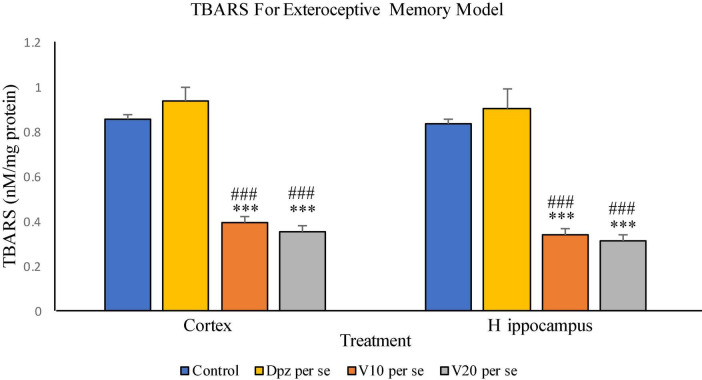
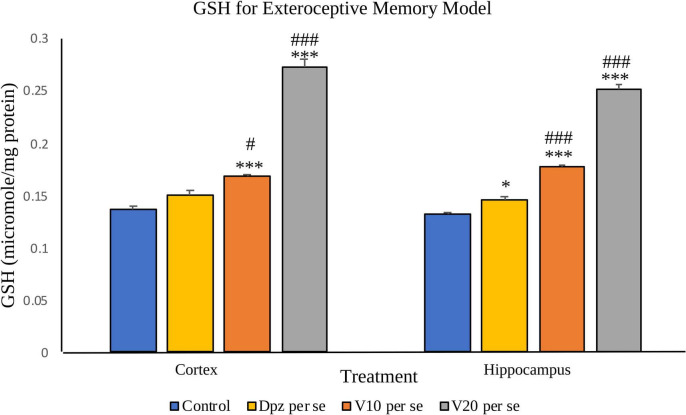
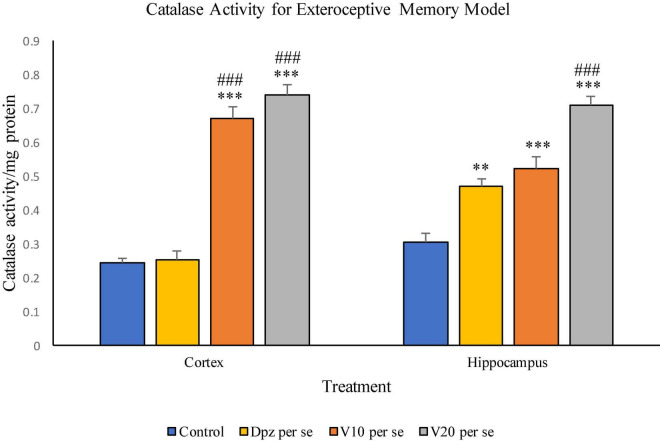
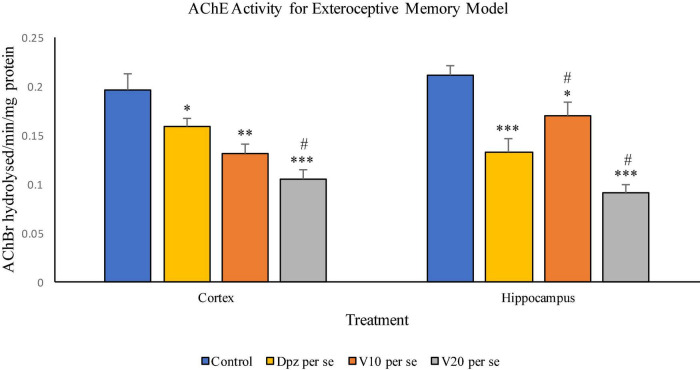
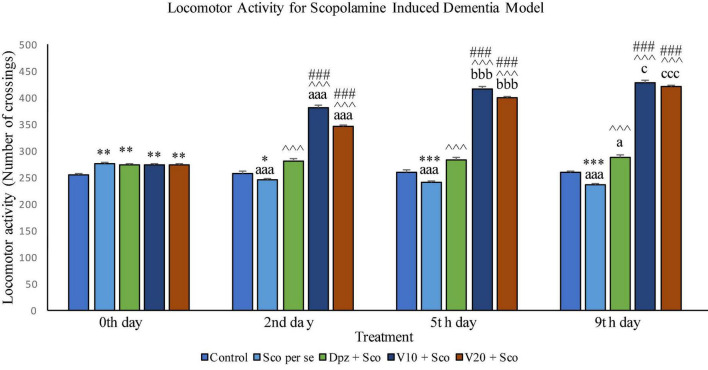
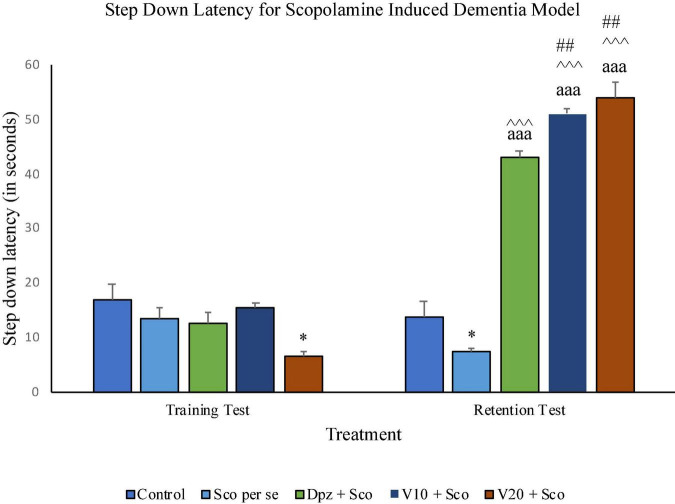
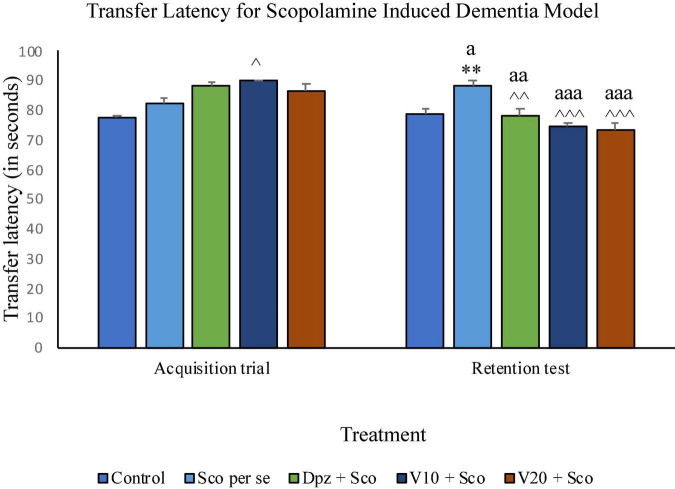
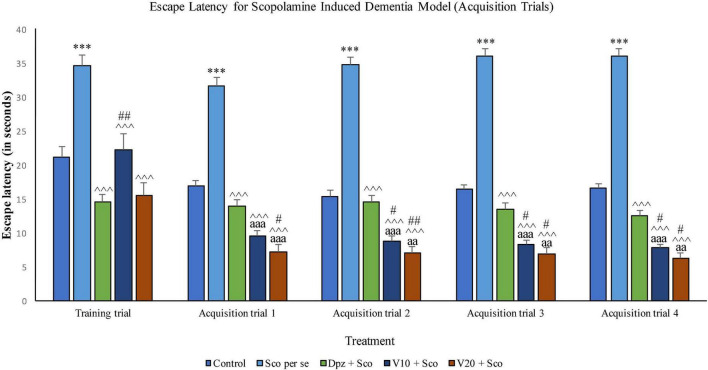
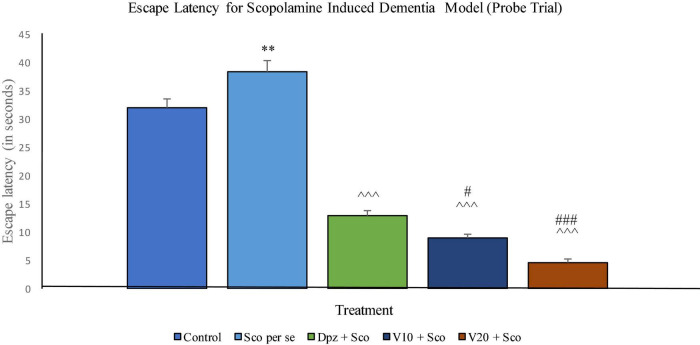
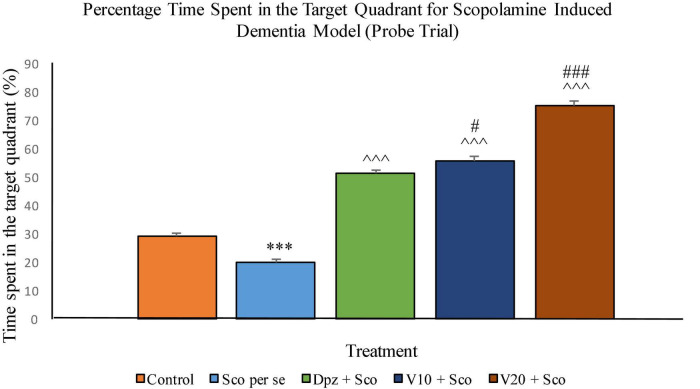
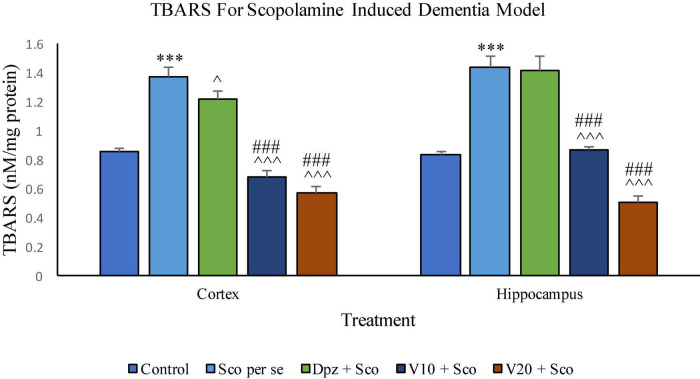
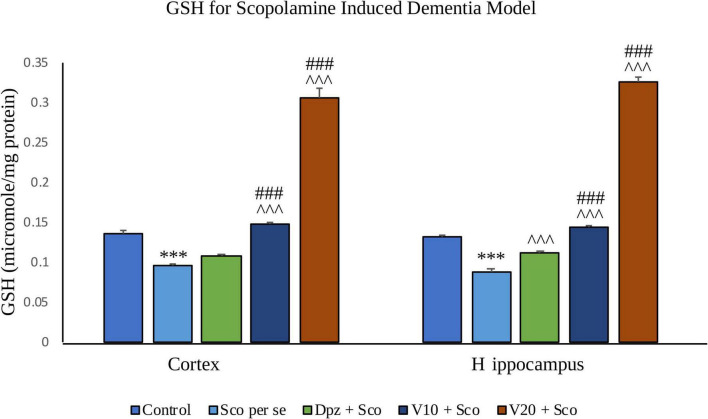
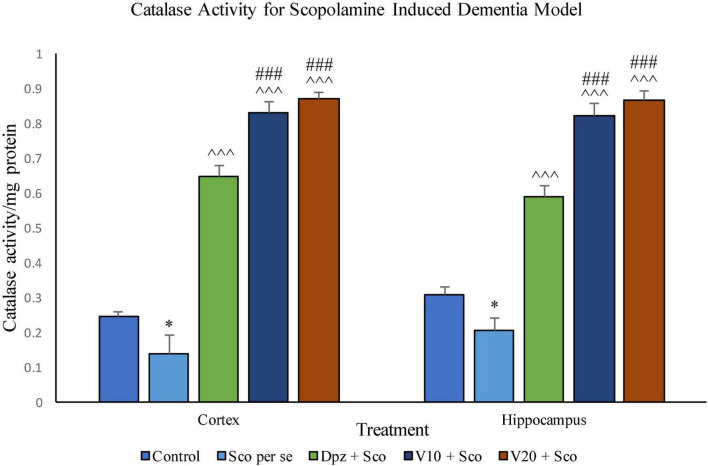
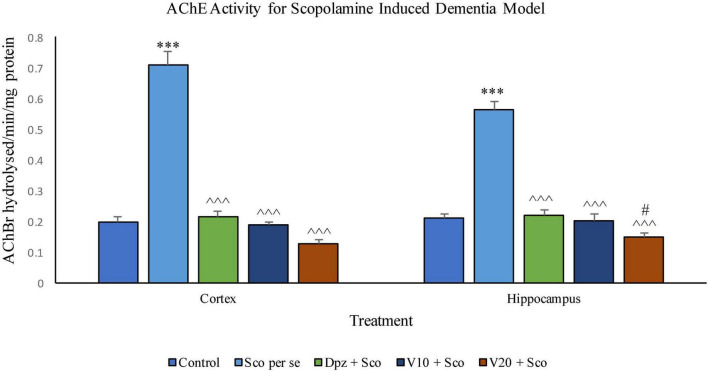
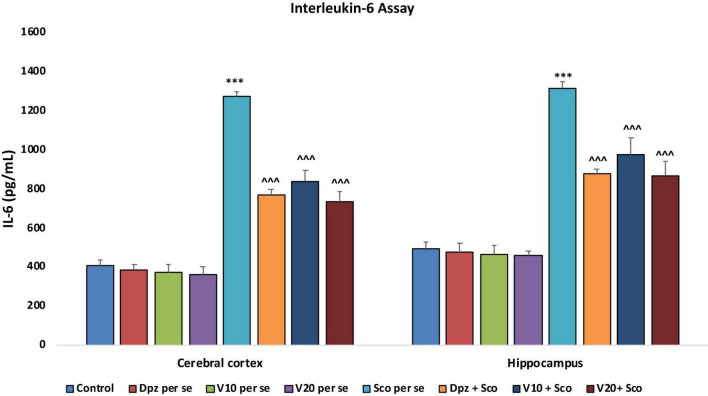
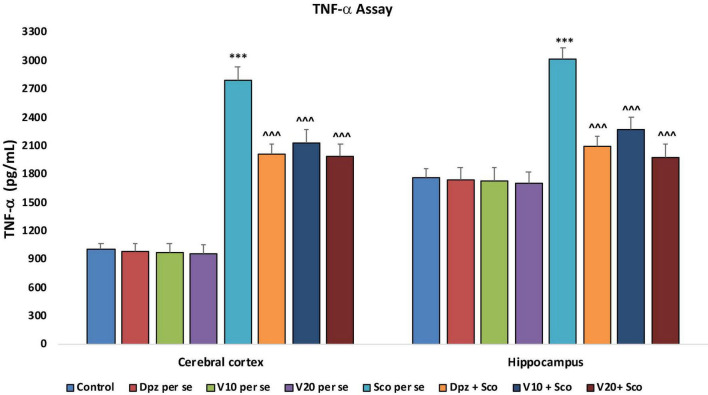
Results: Vanillin showed an acetylcholinesterase inhibitory activity in vitro, and the IC50 value was calculated to be 0.033 mM. Vanillin significantly reversed the memory and behavioral deficits caused by scopolamine as demonstrated by significant improvement in memory in negative reinforcement, elevated plus maze, and spatial learning paradigms. Vanillin also proved to have a nootropic effect. Also, vanillin proved to have significantly better antioxidant and acetylcholinesterase inhibitory effects in vivo than donepezil hydrochloride. The potential anti-AD activity of vanillin was also confirmed by the reduction in IL-6 levels and TNF-α levels.

Conclusion: Our results suggest that vanillin is a safe and effective natural drug candidate having a great potential for the treatment of AD. However, more research is required to evaluate its effect on A beta plaques and Tau neurofibrillary tangles in vivo.

Keywords: Alzheimer’s disease; acetylcholinesterase; antioxidant; dementia; scopolamine; vanillin.


Conflict of interest statement

The authors declare that the research was conducted in the absence of any commercial or financial relationships that could be construed as a potential conflict of interest.

Figures

FIGURE 1
FIGURE 1
Percentage inhibition of acetylcholinesterase by vanillin. Solid line shows the % inhibition of AChE by vanillin v/s log molar concentration. Dotted line shows the regressed line.
FIGURE 2
FIGURE 2
Effect of vanillin and other treatments on locomotor activity. Data are expressed as mean ± SEM. “***” denotes P < 0.001 with respect to the vehicle control group within the same day. “##” denotes P < 0.01 with respect to the standard treatment group within the same day, and “#” denotes P < 0.05 with respect to the standard treatment group within the same day. “aaa” denotes P < 0.001 with respect to the same group during the 0th day, and “a” denotes P < 0.05 with respect to the same group during 0th day. “bb” denotes P < 0.01 with respect to the same group during the 2nd day. “cc” denotes P < 0.01 with respect to the same group during the 5th day, and “c” denotes P < 0.05 with respect to the same group during the 5th day.
FIGURE 3
FIGURE 3
Effect of vanillin and other treatments on step-down latency. Data are expressed as mean ± SEM. “***” denotes P < 0.001 with respect to the control group within the same day, and “**” denotes P < 0.01 with respect to the control group within the same day. “###” denotes P < 0.001 with respect to the standard treatment group within the same day, and “#” denotes P < 0.05 with respect to the standard treatment group within the same day. “aaa” denotes P < 0.001 with respect to the SDL of the same group on the 10th day of the treatment.
FIGURE 4
FIGURE 4
Effect of vanillin and other treatments on transfer latency. Data are expressed as mean ± SEM. “*” denotes P < 0.05 with respect to the control group within the same day. “aaa” denotes P < 0.001 with respect to the TL of the same group on the 10th day of the treatment, and “aa” denotes P < 0.01 with respect to the TL of the same group on the 10th day of the treatment.
FIGURE 5
FIGURE 5
Effect of vanillin and other treatments on escape latency (acquisition trials). Data are expressed as mean ± S.E.M. “***” denotes P < 0.001 with respect to the control group within the same day, and “**” denotes P < 0.01 with respect to the control group within the same day. “###” denotes P < 0.001 with respect to the standard treatment group within the same day. “aaa” denotes (P < 0.001) with respect to the acquisition time of the same group during the training trial. “b” denotes P < 0.05 with respect to the retention time of the same group during acquisition trial 1, and “c” denotes P < 0.05 with respect to the retention time of the same group during acquisition trial 2.
FIGURE 6
FIGURE 6
Effect of vanillin and other treatments on escape latency (probe trial). Data are expressed as mean ± SEM. “***” denotes P < 0.001 with respect to the control group within the probe trial. “###” denotes P < 0.001 with respect to the standard treatment group within the probe trial.
FIGURE 7
FIGURE 7
Effect of vanillin and other treatments on percentage time spent in the target quadrant (probe trial). Data are expressed as mean ± SEM. “***” denotes P < 0.001 with respect to the control group within the probe trial. “###” denotes P < 0.001 with respect to the standard treatment group within the probe trial.
FIGURE 8
FIGURE 8
Effect of vanillin and other treatments on TBARS. Data are expressed as mean ± SEM. “***” denotes P < 0.001 with respect to the control group. “###” denotes P < 0.001 with respect to the standard treatment group.
FIGURE 9
FIGURE 9
Effect of vanillin and other treatments on GSH. Data are expressed as mean ± SEM. “***” denotes P < 0.001 with respect to the control group, and “*” denotes P < 0.05 with respect to the control group. “###” denotes P < 0.001 with respect to the standard treatment group, and “#” denotes P < 0.05 with respect to the standard treatment group.
FIGURE 10
FIGURE 10
Effect of vanillin and other treatments on catalase activity. Data are expressed as mean ± SEM. “***” denotes P < 0.001 with respect to the control group, and “**” denotes P < 0.01 with respect to the control group. “###” denotes P < 0.001 with respect to the standard treatment group.
FIGURE 11
FIGURE 11
Effect of vanillin and other treatments on AChE activity. Data are expressed as mean ± SEM. “***” denotes P < 0.001 with respect to the control group, “**” denotes P < 0.01 with respect to the control group, and “* denotes P < 0.05 with respect to the control group. “#” denotes P < 0.05 with respect to the standard treatment group.
FIGURE 12
FIGURE 12
Effect of vanillin and other treatments on locomotor activity. Data are expressed as mean ± SEM. “***” denotes P < 0.001 with respect to the control group within the same day, “**” denotes P < 0.01 with respect to the control group within the same day, and “*” denotes P < 0.05 with respect to the control group within the same day. “###” denotes P < 0.001 with respect to the standard treatment group within the same day. “∧∧∧” denotes P < 0.001 with respect to the negative control group (Sco per se) within the same day. “aaa” denotes P < 0.001 with respect to the same group during the 0th day, and “a” denotes P < 0.05 with respect to the same group during the 0th day. “bbb” denotes P < 0.001 with respect to the same group during the 2nd day. “ccc” denotes P < 0.001 with respect to the same group during the 5th day, and “c” denotes P < 0.05 with respect to the same group during the 5th day.
FIGURE 13
FIGURE 13
Effect of vanillin and other treatments on step-down latency. Data are expressed as mean ± SEM. “*” denotes P < 0.05 with respect to the control group within the same day. “##” denotes P < 0.01 with respect to the standard treatment group within the same day. “∧∧∧” denotes P < 0.001 with respect to the negative control group (Sco per se) within the same day. “aaa” denotes P < 0.001 with respect to the SDL of the same group on the 10th day of the treatment.
FIGURE 14
FIGURE 14
Effect of vanillin and other treatments on transfer latency. Data are expressed as mean ± SEM. “**” denotes P < 0.01 with respect to the control group within the same day. “∧∧∧” denotes P < 0.001 with respect to the negative control group (Sco per se) within the same day. “∧∧” denotes P < 0.01 with respect to the negative control group (Sco per se) within the same day. “” denotes P < 0.05 with respect to the negative control group (Sco per se) within the same day. “aaa” denotes P < 0.001 with respect to the TL of the same group on the 10th day of the treatment, and “aa” denotes P < 0.01 with respect to the TL of the same group on the 0th day of the treatment.
FIGURE 15
FIGURE 15
Effect of vanillin and other treatments on escape latency (acquisition trials). Data are expressed as mean ± SEM. “***” denotes P < 0.001 with respect to the control group within the same day. “##” denotes P < 0.01 with respect to the standard treatment group within the same day, and “#” denotes P < 0.05 with respect to the standard treatment group within the same day. “∧∧∧” denotes P < 0.001 with respect to the negative control group (Sco per se). “aaa” denotes P < 0.001 with respect to the acquisition time of the same group during the training trial, and “aa” denotes P < 0.01 with respect to the acquisition time of the same group during the training trial.
FIGURE 16
FIGURE 16
Effect of vanillin and other treatments on escape latency (probe trial). Data are expressed as mean ± SEM. “**” denotes P < 0.01 with respect to the control group within the probe trial. “###” denotes P < 0.001 with respect to the standard treatment group within the probe trial, “#” denotes P < 0.05 with respect to the standard treatment group within the probe trial. “∧∧∧” denotes P < 0.001 with respect to the negative control (Sco per se) group within the probe trial.
FIGURE 17
FIGURE 17
Effect of vanillin and other treatments on percentage time spent in the target quadrant (probe trial). Data are expressed as mean ± SEM. “***” denotes P < 0.001 with respect to the control group within the probe trial. “###” denotes P < 0.001 with respect to the standard treatment group within the probe trial, and “#” denotes P < 0.05 with respect to the standard treatment group within the probe trial. “∧∧∧” denotes P < 0.001 with respect to the negative control (Sco per se) group within the probe trial.
FIGURE 18
FIGURE 18
Effect of vanillin and other treatments on TBARS. Data are expressed as mean ± SEM. “***” denotes P < 0.001 with respect to the control group. “###” denotes P < 0.001 with respect to the standard treatment group. “∧∧∧” denotes P < 0.001 with respect to the negative control group (Sco per se), and “” denotes P < 0.05 with respect to the negative control group.
FIGURE 19
FIGURE 19
Effect of vanillin and other treatments on GSH. Data are expressed as mean ± SEM. “***” denotes P < 0.001 with respect to the control group. “###” denotes P < 0.001 with respect to the standard treatment group, and “∧∧∧” denotes P < 0.001 with respect to the negative control (Sco per se) group.
FIGURE 20
FIGURE 20
Effect of vanillin and other treatments on catalase activity. Data are expressed as mean ± SEM. “*” denotes P < 0.05 with respect to the control group. “###” denotes P < 0.001 with respect to the standard treatment group, and “∧∧∧” denotes P < 0.001 with respect to the negative control (Sco per se) group.
FIGURE 21
FIGURE 21
Effect of vanillin and other treatments on AChE activity. Data are expressed as mean ± SEM. “***” denotes P < 0.001 with respect to the control group. “#” denotes P < 0.05 with respect to the standard treatment group. “∧∧∧” denotes P < 0.001 with respect to the negative control (Sco per se) group.
FIGURE 22
FIGURE 22
Effect of vanillin and other treatments on IL-6 concentrations. Data are expressed as mean ± SEM. “***” denotes P < 0.001 with respect to the control group. “∧∧∧” denotes P < 0.001 with respect to the negative control (Sco per se) group.
FIGURE 23
FIGURE 23
Effect of vanillin and other treatments on TNF-α concentrations. Data are expressed as mean ± SEM “***” denotes P < 0.001 with respect to the control group. “∧∧∧” denotes P < 0.001 with respect to the negative control (Sco per se) group.

Similar articles

Cited by

References

    1. Abd-El-Fattah M. A., Abdelakader N. F., Zaki H. F. (2014). Pyrrolidine dithiocarbamate protects against scopolamine-induced cognitive impairment in rats. Eur. J. Pharmacol. 723 330–338. 10.1016/j.ejphar.2013.11.008 - DOI - PubMed
    1. Abdulrahman A. A., Faisal K., Meshref A. A. A., Arshaduddin M. (2017). Low-dose acute vanillin is beneficial against harmaline-induced tremors in rats. Neurol. Res. 39 264–270. 10.1080/01616412.2016.1275456 - DOI - PubMed
    1. Aebi H. (1974). “Catalase,” in Methods of enzymatic analysis, ed. Bergmeyer H. U. (New York, NY: Academic Press Inc; ), 673–680. 10.1016/b978-0-12-091302-2.50032-3 - DOI
    1. Aebi H. (1984). Catalase in vitro. Methods Enzymol. 105 121–126. 10.1016/S0076-6879(84)05016-3 - DOI - PubMed
    1. Anand A., Khurana P., Chawla J., Sharma N., Khurana N. (2017a). Emerging treatments for the behavioral and psychological symptoms of dementia. CNS Spectr. 23 361–369. 10.1017/S1092852917000530 - DOI - PubMed

LinkOut - more resources