. 2022 Nov 3:16:1019572.
doi: 10.3389/fnins.2022.1019572. eCollection 2022.

The relationship between electrophysiological and hemodynamic measures of neural activity varies across picture naming tasks: A multimodal magnetoencephalography-functional magnetic resonance imaging study

Affiliations

The relationship between electrophysiological and hemodynamic measures of neural activity varies across picture naming tasks: A multimodal magnetoencephalography-functional magnetic resonance imaging study

Tommi Mononen et al. Front Neurosci. .

Abstract

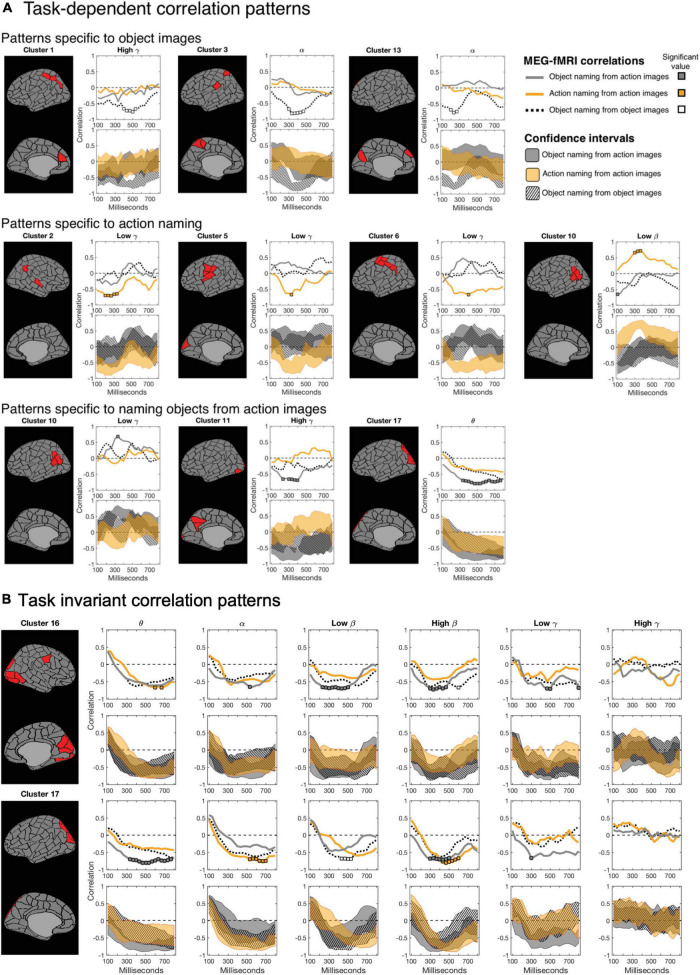
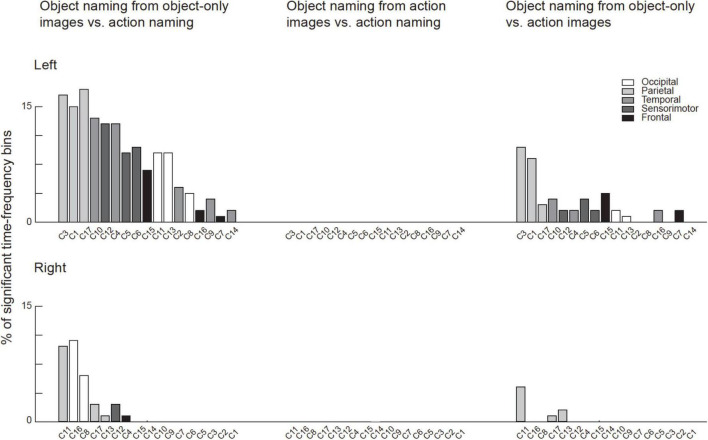
Different neuroimaging methods can yield different views of task-dependent neural engagement. Studies examining the relationship between electromagnetic and hemodynamic measures have revealed correlated patterns across brain regions but the role of the applied stimulation or experimental tasks in these correlation patterns is still poorly understood. Here, we evaluated the across-tasks variability of MEG-fMRI relationship using data recorded during three distinct naming tasks (naming objects and actions from action images, and objects from object images), from the same set of participants. Our results demonstrate that the MEG-fMRI correlation pattern varies according to the performed task, and that this variability shows distinct spectral profiles across brain regions. Notably, analysis of the MEG data alone did not reveal modulations across the examined tasks in the time-frequency windows emerging from the MEG-fMRI correlation analysis. Our results suggest that the electromagnetic-hemodynamic correlation could serve as a more sensitive proxy for task-dependent neural engagement in cognitive tasks than isolated within-modality measures.

Keywords: MEG; clustering; correlation patterns; data fusion; fMRI; multimodal data; picture naming.


Conflict of interest statement

The authors declare that the research was conducted in the absence of any commercial or financial relationships that could be construed as a potential conflict of interest.

Figures

FIGURE 1
FIGURE 1
An outline of MEG and fMRI analysis pipelines, displaying the most important steps and their order. Gray boxes show essential normalizations that aim to equalize the measures obtained with the two modalities.
FIGURE 2
FIGURE 2
Matrix of correlations between MEG and fMRI for the three experimental conditions (separated with thick white vertical lines). Each condition-related submatrix is divided into six frequency bands: Theta, alpha, low beta, high beta, low gamma, and high gamma, from left to right (columns separated by thin vertical gray lines). Each frequency band consists of a sequence of 22 time points (sub-columns). All 140 brain regions (70 per hemisphere) are displayed on the y-axis, ordered with respect to the optimal leaf order of a cluster tree. This leads to a solution where distances between similarly behaving brain regions are minimized. The brain regions (rows) are divided into 17 clusters (C1–C17, separated by horizontal thin gray lines; see Figure 3 for visualization of the areas on MRI). The clustering is the same for all three conditions. The color indicates the MEG-fMRI correlation strength (–1…+1), see scale on the right.
FIGURE 3
FIGURE 3
Clustering of brain regions. Level 17 of a clustering tree (used in the analyses). The deep medial and anterior frontal areas plotted in light gray were omitted from the analysis. Clusters are ordered according to the optimal leaf order and marked with labels C1–C17 (cf. Figure 2).
FIGURE 4
FIGURE 4
Magnetoencephalography-Functional magnetic resonance imaging correlation patterns divided into clusters (row labels) and hemispheres (left and right panels). The three rows in each cluster show correlation between fMRI and MEG for the three experimental conditions: from top to bottom, object naming from object images, action naming from action images and object naming from action images, over time in the different frequency bands (column labels). Significant correlations (p = 0.05, Bonferroni-corrected over the 22 time points) are marked as thicker parts of stripes. Rectangles indicate areas where the 99% confidence intervals of one condition do not overlap those of the other two conditions. A salient difference between naming tasks (naming actions vs. objects) is denoted by an orange rectangle, a difference between two picture types (action vs. object stimulus) is indicated by a dotted black rectangle, and a difference specific to naming objects from action images vs. the other two tasks with a gray rectangle. A rectangle is shown only when there is also a significant MEG–fMRI correlation inside the rectangle. Clusters C3, C5-C7, and C10 have parcels only in the left hemisphere (blank gray bars in the right-hemisphere).
FIGURE 5
FIGURE 5
Magnetoencephalography-functional magnetic resonance imaging correlation as a function of time. For each cluster, the top row shows the correlation spectra for all tasks (naming object from action pictures in gray; naming actions in orange; and naming objects from object pictures in dotted black), and the bottom row the 99% confidence intervals for the three tasks (correspondingly gray, orange and a striped black pattern). In the correlation spectra, the colored squares indicate time instances at which the correlation is significant (p = 0.05, Bonferroni-corrected over time). (A) Task-dependent instances: One task shows significant correlation and differs from the other two tasks (non-overlapping confidence bounds) at a given time. White areas between the confidence intervals of experimental conditions indicate time instances of significantly different MEG-fMRI correlation between two or more conditions (p = 0.01, uncorrected). (B) Task-invariant instances: Clusters 16 and 17 suggest consistent negative correlation between MEG and fMRI at lower frequencies, among all experimental conditions, in the occipital cortex.
FIGURE 6
FIGURE 6
Temporo-spectral uniqueness and overlap in modulation of rhythmic activity and MEG-fMRI correlation. Timing with respect to picture presentation is plotted on the x-axis, and the different frequency bands on the y-axis. Time-frequency windows that showed differences between the conditions only for MEG band-limited power (light gray), only for MEG-fMRI correlation (dark gray) or both (black). Values averaged across all contrasts.
FIGURE 7
FIGURE 7
Significant results in the MEG activation analysis for each cluster. For each cluster the number of significant time-frequency bins are indicated as the percentage of all possible time-frequency bins (in total 132 bins from 6 frequency bands and 22 time-windows). The bars are color-coded according to the lobe to which the majority of the parcels belong to. The clusters are ordered according to the total percentage of significant time-frequency bins in all tasks (left and right- hemispheres separately). Note that there were no significant differences between neural activity during Object naming from action images and action naming, whereas for the other two contrasts where the stimulus contents were different multiple clusters showed significant differences.

Similar articles

References

    1. Brandman T., Peelen M. V. (2017). Interaction between scene and object processing revealed by human fMRI and MEG decoding. J. Neurosci. 37 7700–7710. 10.1523/JNEUROSCI.0582-17.2017 - DOI - PMC - PubMed
    1. Brookes M. J., Vrba J., Robinson S. E., Stevenson C. M., Peters A. M., Barnes G. R., et al. (2008). Optimising experimental design for MEG beamformer imaging. Neuroimage 39 1788–1802. 10.1016/j.neuroimage.2007.09.050 - DOI - PubMed
    1. Butler R., Bernier P. M., Lefebvre J., Gilbert G., Whittingstall K. (2017). Decorrelated input dissociates narrow band gamma power and BOLD in human visual cortex. J. Neurosci. 37 5408–5418. 10.1523/JNEUROSCI.3938-16.2017 - DOI - PMC - PubMed
    1. Calhoun V. D., Sui J. (2016). Multimodal fusion of brain imaging data: A key to finding the missing link(s) in complex mental illness. Biol. Psychiatry Cogn. Neurosci. Neuroimaging 1 230–244. 10.1016/j.bpsc.2015.12.005 - DOI - PMC - PubMed
    1. Cichy R. M., Pantazis D., Oliva A. (2014). Resolving human object recognition in space and time. Nat. Neurosci. 17 455–462. 10.1038/nn.3635 - DOI - PMC - PubMed

LinkOut - more resources