

High-precision neural stimulation by a highly efficient candle soot fiber optoacoustic emitter
- PMID: 36408413
- PMCID: PMC9669258
- DOI: 10.3389/fnins.2022.1005810
High-precision neural stimulation by a highly efficient candle soot fiber optoacoustic emitter
Abstract
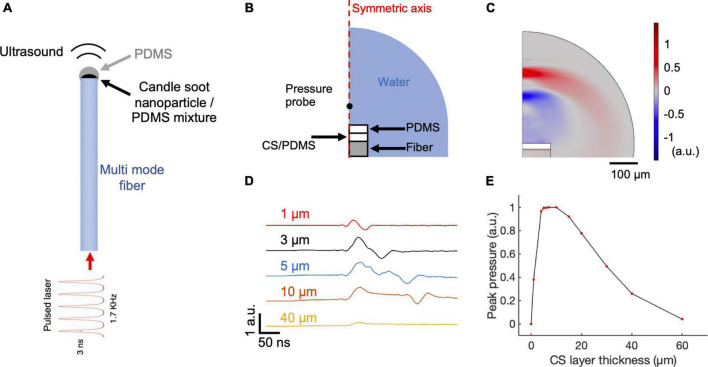
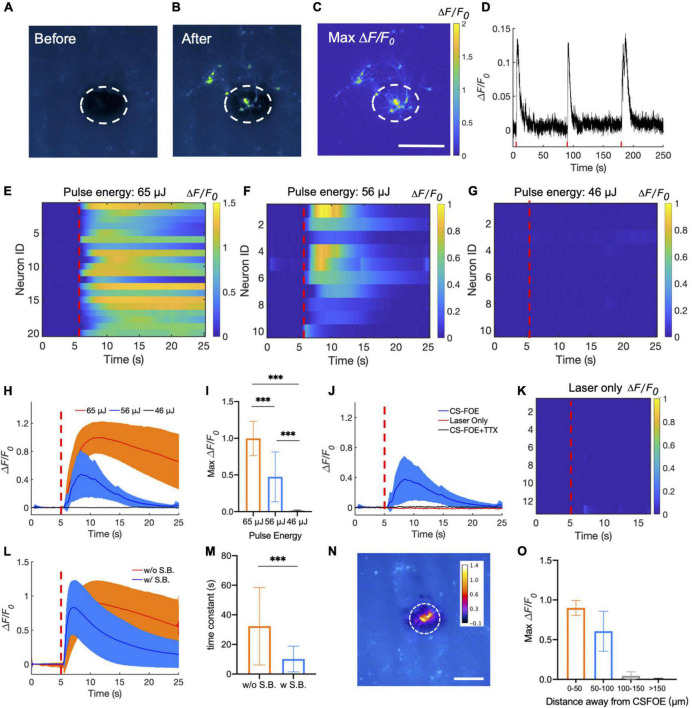
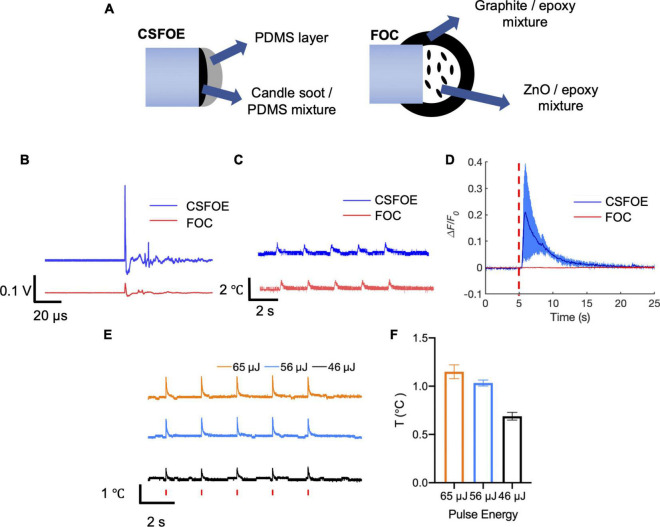
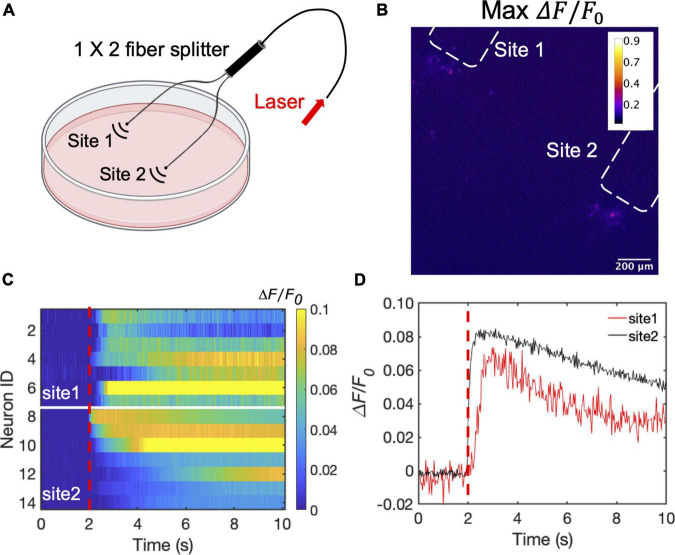
Highly precise neuromodulation with a high efficacy poses great importance in neuroscience. Here we developed a candle soot fiber optoacoustic emitter (CSFOE), capable of generating a high pressure of over 10 MPa with a central frequency of 12.8 MHz, enabling highly efficient neuromodulation in vitro. The design of the fiber optoacoustic emitter, including the choice of the material and the thickness of the layered structure, was optimized in both simulations and experiments. The optoacoustic conversion efficiency of the optimized CSFOE was found to be 10 times higher than the other carbon-based fiber optoacoustic emitters. Driven by a single laser, the CSFOE can perform dual-site optoacoustic activation of neurons, confirmed by calcium (Ca2+) imaging. Our work opens potential avenues for more complex and programmed control in neural circuits using a simple design for multisite neuromodulation in vivo.
Keywords: fiber; neural modulation; neural stimulation; optoacoustic; optoacoustic conversion efficiency; optoacoustic stimulation; photoacoustic.
Copyright © 2022 Chen, Shi, Lan, Wang, Li, Du, Hyman, Cheng and Yang.
Conflict of interest statement
The authors declare that the research was conducted in the absence of any commercial or financial relationships that could be construed as a potential conflict of interest.
Figures

Similar articles
-
Multifunctional Fiber-Based Optoacoustic Emitter as a Bidirectional Brain Interface.Adv Healthc Mater. 2023 Oct;12(25):e2300430. doi: 10.1002/adhm.202300430. Epub 2023 Jul 31. Adv Healthc Mater. 2023. PMID: 37451259 Free PMC article.
-
Non-genetic photoacoustic stimulation of single neurons by a tapered fiber optoacoustic emitter.Light Sci Appl. 2021 Jul 14;10(1):143. doi: 10.1038/s41377-021-00580-z. Light Sci Appl. 2021. PMID: 34257273 Free PMC article.
-
Photoacoustic: A Versatile Nongenetic Method for High-Precision Neuromodulation.Acc Chem Res. 2024 Jun 4;57(11):1595-1607. doi: 10.1021/acs.accounts.4c00119. Epub 2024 May 17. Acc Chem Res. 2024. PMID: 38759211 Free PMC article. Review.
-
High-precision neural stimulation through optoacoustic emitters.Neurophotonics. 2022 Jul;9(3):032207. doi: 10.1117/1.NPh.9.3.032207. Epub 2022 Mar 23. Neurophotonics. 2022. PMID: 35355658 Free PMC article.
-
Melanin-Based Contrast Agents for Biomedical Optoacoustic Imaging and Theranostic Applications.Int J Mol Sci. 2017 Aug 7;18(8):1719. doi: 10.3390/ijms18081719. Int J Mol Sci. 2017. PMID: 28783106 Free PMC article. Review.
Cited by
-
A flexible high-precision photoacoustic retinal prosthesis.bioRxiv [Preprint]. 2024 Nov 22:2024.09.03.611068. doi: 10.1101/2024.09.03.611068. bioRxiv. 2024. PMID: 39282448 Free PMC article. Preprint.
-
Spatial-offset pump-probe imaging of nonradiative dynamics at optical resolution.Sci Adv. 2025 Jul 4;11(27):eadw4939. doi: 10.1126/sciadv.adw4939. Epub 2025 Jul 2. Sci Adv. 2025. PMID: 40601728 Free PMC article.
-
Photoacoustic imaging plus X: a review.J Biomed Opt. 2024 Jan;29(Suppl 1):S11513. doi: 10.1117/1.JBO.29.S1.S11513. Epub 2023 Dec 28. J Biomed Opt. 2024. PMID: 38156064 Free PMC article. Review.
-
Nanoparticle-based optical interfaces for retinal neuromodulation: a review.Front Cell Neurosci. 2024 Mar 20;18:1360870. doi: 10.3389/fncel.2024.1360870. eCollection 2024. Front Cell Neurosci. 2024. PMID: 38572073 Free PMC article. Review.
-
Multifunctional Fiber-Based Optoacoustic Emitter as a Bidirectional Brain Interface.Adv Healthc Mater. 2023 Oct;12(25):e2300430. doi: 10.1002/adhm.202300430. Epub 2023 Jul 31. Adv Healthc Mater. 2023. PMID: 37451259 Free PMC article.
References
-
- Bobola M. S., Chen L., Ezeokeke C. K., Olmstead T. A., Nguyen C., Sahota A., et al. (2020). Transcranial focused ultrasound, pulsed at 40 Hz, activates microglia acutely and reduces Abeta load chronically, as demonstrated in vivo. Brain Stimul. 13 1014–1023. 10.1016/j.brs.2020.03.016 - DOI - PMC - PubMed
LinkOut - more resources
Full Text Sources
Miscellaneous