Radiomics features of DSC-PWI in time dimension may provide a new chance to identify ischemic stroke
- PMID: 36408497
- PMCID: PMC9672479
- DOI: 10.3389/fneur.2022.889090
Radiomics features of DSC-PWI in time dimension may provide a new chance to identify ischemic stroke
Abstract
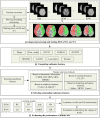
Ischemic stroke has become a severe disease endangering human life. However, few studies have analyzed the radiomics features that are of great clinical significance for the diagnosis, treatment, and prognosis of patients with ischemic stroke. Due to sufficient cerebral blood flow information in dynamic susceptibility contrast perfusion-weighted imaging (DSC-PWI) images, this study aims to find the critical features hidden in DSC-PWI images to characterize hypoperfusion areas (HA) and normal areas (NA). This study retrospectively analyzed 80 DSC-PWI data of 56 patients with ischemic stroke from 2013 to 2016. For exploring features in HA and NA,13 feature sets (F method ) were obtained from different feature selection algorithms. Furthermore, these 13 F method were validated in identifying HA and NA and distinguishing the proportion of ischemic lesions in brain tissue. In identifying HA and NA, the composite score (CS) of the 13 F method ranged from 0.624 to 0.925. F Lasso in the 13 F method achieved the best performance with mAcc of 0.958, mPre of 0.96, mAuc of 0.982, mF1 of 0.959, and mRecall of 0.96. As to classifying the proportion of the ischemic region, the best CS was 0.786, with Acc of 0.888 and Pre of 0.863. The classification ability was relatively stable when the reference threshold (RT) was <0.25. Otherwise, when RT was >0.25, the performance will gradually decrease as its increases. These results showed that radiomics features extracted from the Lasso algorithms could accurately reflect cerebral blood flow changes and classify HA and NA. Besides, In the event of ischemic stroke, the ability of radiomics features to distinguish the proportion of ischemic areas needs to be improved. Further research should be conducted on feature engineering, model optimization, and the universality of the algorithms in the future.
Keywords: DSC-PWI; feature selection; hypoperfusion area; ischemic stroke; radiomics.
Copyright © 2022 Guo, Yang, Cao, Liu, Li, Yang, Feng, Luo, Cheng, Li, Zeng, Miao, Li, Qiu and Kang.
Conflict of interest statement
Author LC was employed by Shenzhen Happy-Growing Intelligent CO., Ltd. The remaining authors declare that the research was conducted in the absence of any commercial or financial relationships that could be construed as a potential conflict of interest.
Figures


Similar articles
-
Leveraging Ensemble Models and Follow-up Data for Accurate Prediction of mRS Scores from Radiomic Features of DSC-PWI Images.J Imaging Inform Med. 2025 Jun;38(3):1467-1483. doi: 10.1007/s10278-024-01280-x. Epub 2024 Oct 4. J Imaging Inform Med. 2025. PMID: 39367198 Free PMC article.
-
A Focus on the Role of DSC-PWI Dynamic Radiomics Features in Diagnosis and Outcome Prediction of Ischemic Stroke.J Clin Med. 2022 Sep 13;11(18):5364. doi: 10.3390/jcm11185364. J Clin Med. 2022. PMID: 36143010 Free PMC article.
-
The Combination of Whole-Brain Features and Local-Lesion Features in DSC-PWI May Improve Ischemic Stroke Outcome Prediction.Life (Basel). 2022 Nov 11;12(11):1847. doi: 10.3390/life12111847. Life (Basel). 2022. PMID: 36430982 Free PMC article.
-
The role of diffusion- and perfusion-weighted magnetic resonance imaging in drug development for ischemic stroke: from laboratory to clinics.Curr Vasc Pharmacol. 2004 Oct;2(4):343-55. doi: 10.2174/1570161043385493. Curr Vasc Pharmacol. 2004. PMID: 15320814 Review.
-
[Intravenous administration of a tissue plasminogen activator beyond 3 hours of the onset of acute ischemic stroke--MRI-based decision making].Brain Nerve. 2008 Oct;60(10):1173-80. Brain Nerve. 2008. PMID: 18975605 Review. Japanese.
Cited by
-
Ischemic stroke outcome prediction with diversity features from whole brain tissue using deep learning network.Front Neurol. 2024 May 3;15:1394879. doi: 10.3389/fneur.2024.1394879. eCollection 2024. Front Neurol. 2024. PMID: 38765270 Free PMC article.
-
Blood-brain barrier breakdown in brain ischemia: Insights from MRI perfusion imaging.Neurotherapeutics. 2025 Jan;22(1):e00516. doi: 10.1016/j.neurot.2024.e00516. Epub 2024 Dec 21. Neurotherapeutics. 2025. PMID: 39709246 Free PMC article. Review.
-
The novel imaging methods in diagnosis and assessment of cerebrovascular diseases: an overview.Front Med (Lausanne). 2024 Apr 10;11:1269742. doi: 10.3389/fmed.2024.1269742. eCollection 2024. Front Med (Lausanne). 2024. PMID: 38660416 Free PMC article. Review.
-
Three-stage registration pipeline for dynamic lung field of chest X-ray images based on convolutional neural networks.Front Artif Intell. 2025 Mar 12;8:1466643. doi: 10.3389/frai.2025.1466643. eCollection 2025. Front Artif Intell. 2025. PMID: 40144737 Free PMC article.
-
Prediction of prognosis in acute ischemic stroke after mechanical thrombectomy based on multimodal MRI radiomics and deep learning.Front Neurol. 2025 Apr 30;16:1587347. doi: 10.3389/fneur.2025.1587347. eCollection 2025. Front Neurol. 2025. PMID: 40371075 Free PMC article.
References
-
- Pinto A, Amorim J, Hakim A, Alves V, Silva CA. Prediction of Stroke lesion at 90-day follow-up by fusing raw DSC-MRI with parametric maps using Deep Learning. IEEE Access. (2021) 99:1–1. 10.1109/ACCESS.2021.3058297 - DOI
LinkOut - more resources
Full Text Sources
Research Materials

