. 2022 Dec 1;225(23):jeb244083.
doi: 10.1242/jeb.244083. Epub 2022 Dec 9.

Trade-offs in muscle physiology in selectively bred high runner mice

Affiliations

Trade-offs in muscle physiology in selectively bred high runner mice

Alberto A Castro et al. J Exp Biol. .

Abstract

A trade-off between locomotor speed and endurance occurs in various taxa, and is thought to be underpinned by a muscle-level trade-off. Among four replicate high runner (HR) lines of mice, selectively bred for voluntary wheel-running behavior, a negative correlation between average running speed and time spent running has evolved. We hypothesize that this trade-off is due to changes in muscle physiology. We studied the HR lines at generation 90, at which time one line (L3) is fixed for the mini-muscle phenotype, another is polymorphic (L6) and the others (L7, L8) lack mini-muscle individuals. We used in situ preparations to quantify the contractile properties of the triceps surae muscle complex. Maximal shortening velocity varied significantly, being lowest in mini-muscle mice (L3 mini=25.2 mm s-1, L6 mini=25.5 mm s-1), highest in normal-muscle mice L6 and L8 (40.4 and 50.3 mm s-1, respectively) and intermediate in normal-muscle L7 mice (37.2 mm s-1). Endurance, measured both as the slope of the decline in force and the proportion of initial force that could be sustained, also varied significantly. The slope was shallowest in mini-muscle mice (L3 mini=-0.00348, L6 mini=-0.00238), steepest in lines L6 and L8 (-0.01676 and -0.01853), and intermediate in L7 (-0.01145). Normalized sustained force was highest in mini-muscle mice (L3 mini=0.98, L6 mini=0.92) and lowest in L8 (0.36). There were significant, negative correlations between velocity and endurance metrics, indicating a muscle-level trade-off. However, this muscle-level trade-off does not seem to underpin the organismal-level speed and endurance trade-off previously reported as the ordering of the lines is reversed: the lines that run the fastest for the least time have the lowest muscle complex velocity and highest endurance.

Keywords: Artificial selection; Endurance; Force–velocity; Locomotion; Muscle physiology; Trade-offs.


Conflict of interest statement

Competing interests The authors declare no competing or financial interests.

Figures

Fig. 1.
Fig. 1.
Body mass and muscle dimensions for all groups of mice. (A) Least square means and standard errors of body mass for each line (L3 mini, L6 mini, L6, L7 and L8). Age was positively associated with body size and both L6 mini and L7 mice were significantly lighter when compared with the other lines. Type 3 tests of fixed effects: group, F4.25=6.16, P=0.0014; age, F1,25=12.22, P=0.0018. (B) Least square means and standard errors of triceps surae muscle length for each line. Neither age nor body mass was associated with muscle length, and the lines did not differ significantly. Type 3 tests of fixed effects: group, F4,24=0.69, P=0.6064; body mass, F1,24=0.65, P=0.4284; age, F1,24=0.20, P=0.6553. (C) Least square means and standard errors of triceps surae muscle mass for each line. Triceps surae muscle mass was positively associated with body mass, and mini-muscle mice (L3 mini and L6 mini) had significantly lighter muscles when compared with the other lines (L6, L7 and L8), with L7 having intermediate values. Type 3 tests of fixed effects: group, F4,24=50.67, P<0.0001; body mass, F1,24=2.91, P=0.1007; age, F1,24=0.00, P=0.9735. (D) Least square means and standard errors of anatomical cross-sectional area (CSA) for each line. Mini-muscle mice (L3 mini and L6 mini) had significantly lower anatomical CSA values when compared with the other lines. Type 3 tests of fixed effects: group, F4,24=16.72, P<0.0001; body mass, F1,24=2.01, P=0.1696; age, F1,24=0.88, P=0.3585. L3 mini N=6, L6 mini N=5, L6 N=6, L7 N=8 and L8 N=6 for all traits presented in this figure.
Fig. 2.
Fig. 2.
Isometric contractile properties for all groups of mice. (A) Least square means and standard errors of stress for each line (L3 mini, L6 mini, L6, L7 and L8). Neither age nor body mass was associated with stress and the lines did not differ significantly. Type 3 tests of fixed effects: group, F4,25=0.86, P=0.5007; age, F1,25=0.04, P=0.8386. (B) Least square means and standard errors of F0,mass for each line. Mini-muscle mice (L3 mini and L6 mini) had significantly lower F0,mass values when compared with the other lines (L6, L7 and L8). Type 3 tests of fixed effects: group, F4,24=11.74, P<0.0001; age, F1,24=1.19, P=0.2868. (C) Least square means and standard errors of TPtw for each line. Neither age nor body mass was associated with TPtw, and the lines did not differ significantly. Type 3 tests of fixed effects: group, F4,25=0.45, P=0.7687; age, F1,25=0.15, P=0.6987. (D) Least square means and standard errors of TR50 for each line. Neither age nor body mass was associated with TR50, and the lines did not differ significantly. Type 3 tests of fixed effects: group, F4,25=0.32, P=0.8626; age, F1,25=0.29, P=0.5919. L3 mini N=6, L6 mini N=5, L6 N=6, L7 N=8 and L8 N=6 for all traits presented in this figure with the exception of F0,mass, where L7 N=7.
Fig. 3.
Fig. 3.
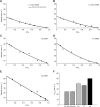
Sample and summary force–velocity data for all groups of mice. (A) Representative force–velocity trace for L3 mini, with F/F0 on the x-axis and absolute shortening velocity on the y-axis. The force–velocity points were curve-fitted using the second-order polynomials and maximal shortening velocity mm s−1 estimates using this fit are visually rendered. (B) Representative force–velocity trace for L6 mini. (C) Representative force–velocity trace for L6. (D) Representative force–velocity trace for L7. (E) Representative force–velocity trace for L8. (F) Least square means and standard errors of Vmax F0,mass for each line based on second-order polynomials. Vmax was positively associated with age, and mini-muscle mice (L3 mini and L6 mini) had significantly lower Vmax values when compared with the other lines (L6, L7 and L8). Type 3 tests of fixed effects: group, F4,180=102.44, P<0.0001; age, F1,180=85.85, P<0.0001. Of the normal-muscle lines, L8 had the highest Vmax value and L6 and L7 were intermediate. The repeated-measures design of the force–velocity experiment meant there were a total of 192 total data points. Of these there were 44 data points from six individuals in L3 mini, 33 data points from five individuals in L6 mini, 30 data points from four individuals in L6, 53 data points from seven individuals in L7, and 32 data points from five individuals in L8.
Fig. 4.
Fig. 4.
Sample and summary endurance data for all groups of mice. (A) Representative endurance trace wave profile for L3 mini, with contraction number on the x-axis and isometric force on the y-axis. The linear fit (Endur0–90) of the decline in force over the first 90 tetanic contractions and the average sustained force (Fsustained) are visually rendered. (B) Representative endurance trace wave profile for L6 mini. (C) Representative endurance trace wave profile for L6. (D) Representative endurance trace wave profile for L7. (E) Representative endurance trace wave profile for L8. L8 mice all fatigued within the first 200 contractions. (F) Least square means and standard errors of Endur0–90 for each line. L3 mini N=6, L6 mini N=5, L6 N=6, L7 N=8 and L8 N=5. Endur0–90 was positively associated with age, and mini-muscle mice (L3 mini and L6 mini) had significantly lower Endur0–90 values when compared with the other lines (L6, L7 and L8), with L7 having intermediate Endur0–90 values. Type 3 tests of fixed effects: group, F4,24=19.52, P<0.0001; age F1,234=12.94, P=0.0014. (G) Least square means and standard errors of Fsustained/F0 for each line. L3 mini N=6, L6 mini N=5, L6 N=5, L7 N=6 and L8 N=3 mini-muscle mice (L3 mini and L6 mini) had significantly lower Fsustained/F0 values when compared with the other lines. Type 3 tests of fixed effects: group, F4,19=22.17, P<0.0001; age, F1,19=0.33, P=0.5711.
Fig. 5.
Fig. 5.
Correlations between velocity and endurance metrics across all groups of mice. (A) Scatterplot of least squares means and standard errors for Vnormax (normalized maximal shortening velocity) and Endur0–90 (linear slope of the first 90 contractions). Vnormax and Endur0–90 have a negative relationship. Mini-muscle mice (L3 mini and L6 mini) have the highest endurance (Endur0–90) but slowest muscles (Vnormax), L6 and L8 have the lowest endurance but fastest muscles, and L7 is intermediate. (B) Scatterplot of least squares means and standard errors for Vnormax and Fsustained/F0 (normalized force that can be sustained). Vnormax and Fsustained/F0 have a negative relationship. Mini-muscle mice (L3 mini and L6 mini) have the highest sustained force (Fsustained/F0) but slowest muscles (Vnormax), L8 has the lowest sustained force but the highest Vnormax. (C) Scatterplot of least squares means and standard errors for Fsustained/F0 and Endur0–90. Fsustained/F0 and Endur0–90 have a positive relationship as would be expected given that they are both metrics of muscle endurance. N-values are as for Figs 3 and 4.

Similar articles

Cited by

References

    1. Ackerly, D. D., Dudley, S. A., Sultan, S. E., Schmitt, J., Coleman, J. S., Linder, C. R., Sandquist, D. R., Geber, M. A., Evans, A. S., Dawson, T. E.et al. (2000). The evolution of plant ecophysiological traits: recent advances and future directions. Bioscience 50, 979. 10.1641/0006-3568(2000)050[0979:TEOPET]2.0.CO;2 - DOI
    1. Agrawal, A. A. (2020). A scale–dependent framework for trade-offs, syndromes, and specialization in organismal biology. Ecology 101, e02924. 10.1002/ecy.2924 - DOI - PubMed
    1. Albuquerque, R. L. D., Bonine, K. E. and Garland, T.Jr (2015). Speed and endurance do not trade off in Phrynosomatid lizards. Physiol. Biochem. Zool. 88, 634-647. 10.1086/683678 - DOI - PubMed
    1. Alcazar, J., Csapo, R., Ara, I. and Alegre, L. M. (2019). On the shape of the force-velocity relationship in skeletal muscles: the linear, the hyperbolic, and the double-hyperbolic. Front. Physiol. 10, 769. 10.3389/fphys.2019.00769 - DOI - PMC - PubMed
    1. Allen, D. G., Lamb, G. D. and Westerblad, H. (2008). Skeletal muscle fatigue: cellular mechanisms. Physiol. Rev. 88, 287-332. 10.1152/physrev.00015.2007 - DOI - PubMed

Publication types