. 2023 Jan;601(1):99-121.
doi: 10.1113/JP283650. Epub 2022 Dec 8.

Disrupted T-tubular network accounts for asynchronous calcium release in MTM1-deficient skeletal muscle

Affiliations

Disrupted T-tubular network accounts for asynchronous calcium release in MTM1-deficient skeletal muscle

Peter Szentesi et al. J Physiol. 2023 Jan.

Abstract

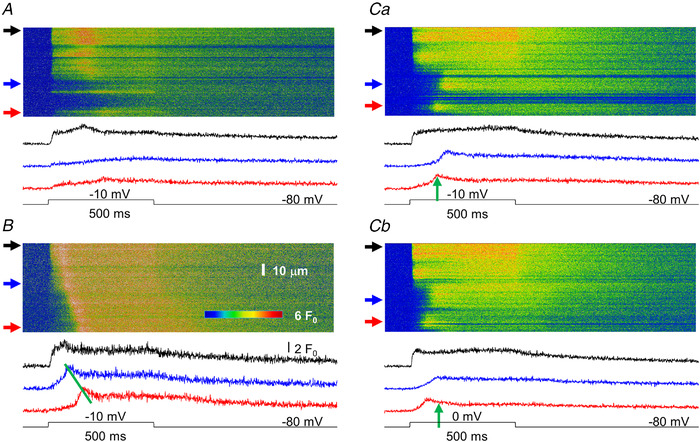
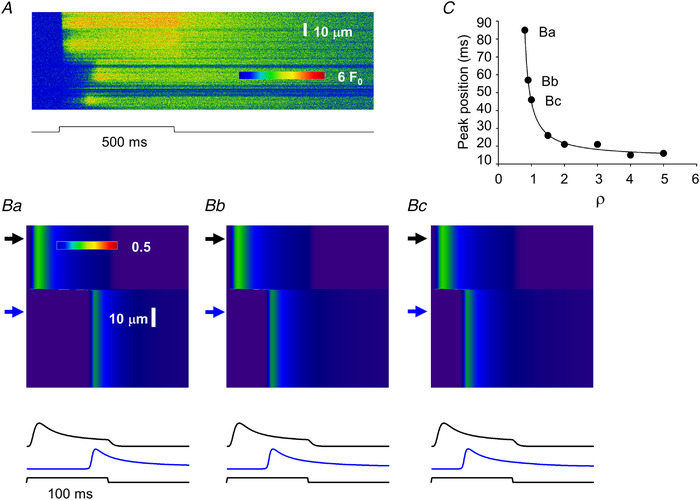
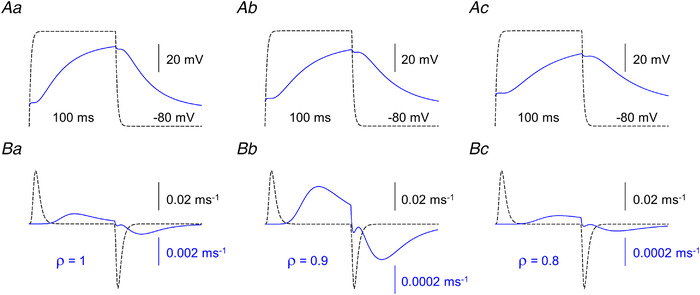
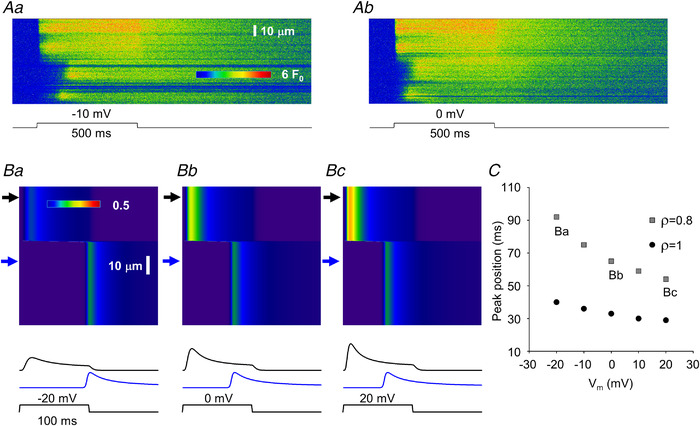
In mammalian skeletal muscle, the propagation of surface membrane depolarization into the interior of the muscle fibre along the transverse (T) tubular network is essential for the synchronized release of calcium from the sarcoplasmic reticulum (SR) via ryanodine receptors (RyRs) in response to the conformational change in the voltage-sensor dihydropyridine receptors. Deficiency in 3-phosphoinositide phosphatase myotubularin (MTM1) has been reported to disrupt T-tubules, resulting in impaired SR calcium release. Here confocal calcium transients recorded in muscle fibres of MTM1-deficient mice were compared with the results from a model where propagation of the depolarization along the T-tubules was modelled mathematically with disruptions in the network assumed to modify the access and transmembrane resistance as well as the capacitance. If, in simulations, T-tubules were assumed to be partially or completely inaccessible to the depolarization and RyRs at these points to be prime for calcium-induced calcium release, all the features of measured SR calcium release could be reproduced. We conclude that the inappropriate propagation of the depolarization into the fibre interior is the initial critical cause of severely impaired SR calcium release in MTM1 deficiency, while the Ca2+ -triggered opening of RyRs provides an alleviating support to the diseased process. KEY POINTS: Myotubular myopathy is a fatal disease due to genetic deficiency in the phosphoinositide phosphatase MTM1. Although the causes are known and corresponding gene therapy strategies are being developed, there is no mechanistic understanding of the disease-associated muscle function failure. Resolving this issue is of primary interest not only for a fundamental understanding of how MTM1 is critical for healthy muscle function, but also for establishing the related cellular mechanisms most primarily or stringently affected by the disease, which are thus of potential interest as therapy targets. The mathematical modelling approach used in the present work proves that the disease-associated alteration of the plasma membrane invagination network is sufficient to explain the dysfunctions of excitation-contraction coupling, providing the first integrated quantitative framework that explains the associated contraction failure.

Keywords: MTM1; T-tubule; calcium release; ryanodine receptor; sarcoplasmic reticulum.


Conflict of interest statement

The authors declare no conflict of financial and non‐financial competing interests on behalf of all authors.

Figures

Figure 1
Figure 1. Voltage dependence of intramembrane charge movement
A, simulated non‐linear capacitive currents (I Q) in response to 100 ms long depolarizing pulses to the indicated membrane potentials (V m). Its time course is presented below the traces. The holding potential (V h) was set to −80 mV. B, voltage dependence of charge activation (circles) together with the best fit of eqn (1a) (solid curve) to the data points. The parameters of the fit are Q max = 0.90, V 50,a = −41.3 mV, and ka = 14.0 mV. Note that the maximal available charge does not reach unity as some DHPRs are in the inactivated state at V h = −80 mV. The voltage dependence of inactivation (eqn (1b)) is also shown (dashed curve). C, voltage dependence of the time constant for charge transfer. The curve represents the best fit of eqn (2) to the data points with τmax = 5.4 ms, V 50 = −44.9 mV, and k = 15.8 mV. Parameters for the simulation are given in Table 1. For further details see text. [Colour figure can be viewed at wileyonlinelibrary.com]
Figure 2
Figure 2. Simulated profiles of membrane potentials with different T‐tubule parameters
A, resting membrane potential profiles within the voltage‐clamped muscle fibre at different values for ρ (i.e. steady‐state solutions of eqn (4) for ρ = 5, 2, 1, 0.5, 0.2). Relative spatial positions were defined as the distance from the longitudinal axis (r) of the fibre divided by the radius (a) of the fibre. Holding potential (V h) was set to −80 mV. B and C, changes in the membrane potential at (r/a = 0.2, 0.5 and 0.8) in response to a depolarizing step of 100 ms to −10 mV. Ba & Ca and Bb & Cb present the cases of ρ = 1 and 0.5, respectively. Values for V h at a given r/a were taken from A. τ was set to 20 and 40 ms for B and C, respectively. [Colour figure can be viewed at wileyonlinelibrary.com]
Figure 3
Figure 3. Simulated time courses of membrane potential (V m), charge in the activating position (Q) and charge movement current (I Q)
A–C, simulations were carried out at different relative spatial positions (r/a) within the fibre (0.2, 0.5 and 0.8 for A, B and C, respectively) with ρ set to 5 and τ set to 20, 60, 200 and 600 ms. The fibre was depolarized to −10 mV for 100 ms from a holding potential of −80 mV (indicated by the horizontal lines at the V m traces). Note that an extreme value of 600 ms (compare with the control value of 20 ms; see parameters in Table 1) for τ is needed to obtain appreciable difference in the time course of V m and I Q at normal ρ (i.e. at ρ = 5). [Colour figure can be viewed at wileyonlinelibrary.com]
Figure 4
Figure 4. Simulated time courses of membrane potential (V m), charge in the activating position (Q) and charge movement current (I Q)
A–C, simulations were carried out at different relative spatial positions (r/a) within the fibre (0.2, 0.5 and 0.8 for A, B and C, respectively) with ρ set to 1 and τ set to 20, 60, 200 and 600 ms. The fibre was depolarized to −10 mV for 100 ms from a holding potential of −80 mV (indicated by the horizontal lines at the V m traces). Note that already a small change in τ to 60 ms (compare with the control value of 20 ms; see parameters in Table 1) results in an appreciable difference in the time course of Vm, Q and I Q at reduced ρ (i.e. at ρ = 1). Note also that at large τ the amount of charge moved by the depolarizing pulse is considerably reduced. [Colour figure can be viewed at wileyonlinelibrary.com]
Figure 5
Figure 5. Model of ryanodine receptor (RyR) Ca2+ release channel and its gating
A, inactivating‐sites (formula image
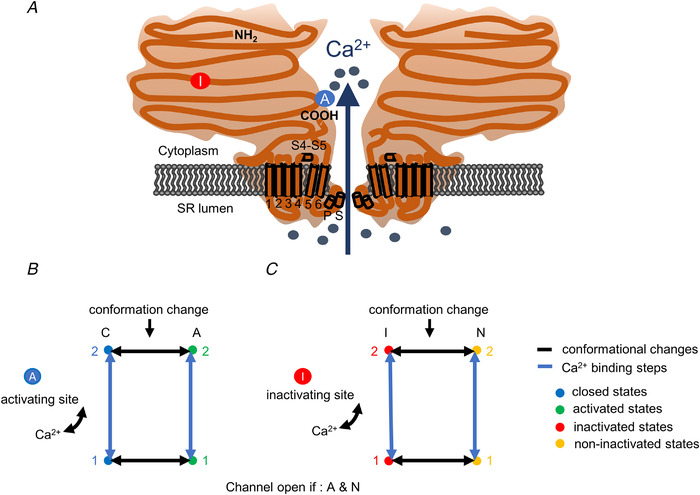
): N‐terminal; around amino acids 1873−1903. Activating site (formula image): C‐terminal; amino acids 4007−5037. B and C, gating schemes of RyR for activation and inactivation with calcium. B, four‐state model of channel activation. C, four‐state model of channel inactivation. Note: the channel is open if A(ctivated) and N(ot‐inactivated). [Colour figure can be viewed at wileyonlinelibrary.com]
Figure 6
Figure 6. Voltage dependence of ryanodine receptor1 activation
A, time course of channel opening (dR/dt) in response to 100 ms long depolarizing pulses to the indicated membrane potentials (V m). Traces were normalized to the number of channels within the junctional space. B, membrane potential dependence of the relative number of open release channels. Superimposed is the best fit of eqn (1a) to the data points. The parameters of the fit are R max = 48.90, V 50,a = −18.12 mV and k a = 11.30 mV. The voltage dependence of Q taken from Fig. 1B is also shown (dashed curve). C, [Ca2+]junc dependence of the time constant for channel inactivation. Values on the x‐axis are expressed as relative to the maximal attainable [Ca2+]junc. The data points were fitted to eqn (5) (best fit is shown superimposed) with K d,rel = 25.6, ki  = 0.0787. Parameters for the simulation are given in Table 1. For further details see text. [Colour figure can be viewed at wileyonlinelibrary.com]
Figure 7
Figure 7. Disrupted T‐tubular network in a fibre from an MTM1‐deficient mouse
Transmitted light image of a wild‐type (A) and a MTM1‐deficient (B) flexor digitorum brevis (FDB) fibre. Fluorescent image of a di‐8‐Anepps stained wild‐type (C) and a MTM1‐deficient (D) FDB fibre collected with a confocal microscope. Note the regular and the incomplete patterns of the T‐tubules in the wild‐type and the MTM1‐deficient fibres, respectively. [Colour figure can be viewed at wileyonlinelibrary.com]
Figure 8
Figure 8. Simulated spatio‐temporal pattern of intracellular calcium concentration in an artificial muscle fibre
A, line‐scan image showing the calcium concentration profile. The assumed distribution of the holding potential (V h) and relative availability of ryanodine receptors (RyRs) that can be activated by calcium (R m) along the fibre are presented next to the image (left and right, respectively). V h was determined by setting ρ = 5 and 0.2 in eqn (4) at positions where the T‐tubules were assumed to be intact (upper arrow) and affected (middle and bottom arrow), respectively. The fibre was depolarized to −10 mV for 100 ms. B, non‐linear capacitive currents representing intramembrane charge movement at different locations along the fibre as indicated by the respective numbered arrows in A. C, time course of open RyRs at the same spatial positions. The same parameters were used in the simulation as in Figs 1 and 6. [Colour figure can be viewed at wileyonlinelibrary.com]
Figure 9
Figure 9. Characteristic features of sarcoplasmic reticulum calcium release in MTM1‐deficient mouse skeletal muscle fibres as assessed by confocal line‐scan imaging
A, a fibre displaying areas where normal (top arrow) or reduced (to a lesser, middle arrow or to a more pronounced extent, bottom arrow) calcium release is observed. Here, and in all other panels, traces below the image represent the time course of the transient calculated by averaging 10 points in the spatial domain at the corresponding (from top to bottom) arrow. B, a fibre displaying a propagating calcium wave. The slope of the line connecting the peaks of the transients can be used to determine the speed of propagation (570 μm/s for the image in B). Ca, a fibre displaying areas where the start of the transient significantly lags behind that of the voltage command. Upper trace represents a non‐affected area, whereas middle and bottom traces present examples for delayed activation. The fibre was depolarized to −10 mV. Cb, same fibre as in Ca, but now depolarized to 0 mV. The positions of the arrows next to the images and thus the time course of the transients correspond to identical spatial positions in Ca and Cb. Note that the delay for activation in the affected area is less in the fibre with the greater depolarization as indicated by the vertical arrows pointing to the peak of the bottom trace in Ca (the arrow in Cb is positioned at the same time point as that in Ca). The resting membrane potential was set to −80 mV and the depolarization was 500 ms for all fibres in the figure. [Colour figure can be viewed at wileyonlinelibrary.com]
Figure 10
Figure 10. Simulation of delayed activation in MTM1‐deficient muscle fibres
A, same line‐scan image as presented in Fig. 9 Ca. B, simulated line‐scan images (simulation done as described in Methods and presented in Fig. 8 and Figs 2, 3, 4) using two areas with different parameters. Upper arrows point to areas where activation is normal (for normal parameters see Table 1) while bottom arrows point to affected areas where ρ and τ (eqn (4)) were altered. τ was increased to 200 ms from its normal value of 20 ms, while ρ was decreased to 1, 0.9 and 0.8 from its normal value of 5 for Bc, Bb and Ba, respectively. Traces below the images represent the time course of the transient at the corresponding (top and bottom) arrow. C, dependence of the activation delay (as assessed by the position of the peak of the transient compared with the onset of the depolarizing pulse) on the selection of ρ. Points labelled Ba, Bb and Bc correspond to the bottom traces in Ba, Bb and Bc, respectively. In the simulation the fibre was depolarized to −10 mV for 100 ms from a holding potential of −80 mV to mimic the depolarization of the fibre in A. Note that the simulated images, here and in all subsequent figures, display the time course of the calcium transient in the triadic junction (see Methods). [Colour figure can be viewed at wileyonlinelibrary.com]
Figure 11
Figure 11. Simulated changes in membrane potential and intramembrane charge movement
A, membrane potential changes at the arrows corresponding to Fig. 10Ba, Bb and Bc. Scale bars are valid for all traces. B, charge movement currents (I Q) calculated at the same position on each panel. Note the different scales for the solid and dashed traces (the expanded scales correspond to the solid traces). Dashed traces were calculated with ρ = 5. [Colour figure can be viewed at wileyonlinelibrary.com]
Figure 12
Figure 12. Simulation of the voltage dependence of delayed activation in MTM1‐deficient muscle fibres
A, same line‐scan images as presented in Fig. 9C . B, simulated line‐scan images using two areas with different parameters. Upper arrows point to areas where activation is normal while bottom arrows point to affected areas where ρ and τ (eqn (4)) were altered. τ was increased to 200 ms from its normal value of 20 ms, while ρ was decreased to 0.8 from its normal value of 5. The depolarizing pulse brought the membrane potential (V m) from a resting value of −80 mV to −20, 0 and +20 mV for 100 ms for Ba, Bb and Bc, respectively. Traces below the images represent the time course of the transient at the corresponding (top and bottom) arrows. Note that the activation of the bottom trace is faster if the membrane is more depolarized. C, voltage dependence of the activation delay (as assessed by the position of the peak of the transient as compared with the onset of the depolarizing pulse) at different ρ values. Points labelled Ba, Bb and Bc correspond to the bottom traces in Ba, Bb and Bc, respectively. [Colour figure can be viewed at wileyonlinelibrary.com]
Figure 13
Figure 13. Simulated changes in membrane potential and intramembrane charge movement
A, membrane potential changes at the arrows corresponding to Ba, Bb and Bc in Fig. 12. B, charge movement currents (I Q) calculated at the same position on each panel. Note the 100 times smaller scale for the solid traces. [Colour figure can be viewed at wileyonlinelibrary.com]
Figure 14
Figure 14. Simulation of calcium wave propagation in MTM1‐deficient muscle fibres
A, same line‐scan image as presented in Fig. 9B . B, simulated line‐scan images using two areas with different parameters. Upper arrows point to areas where activation is normal (for normal parameters see Table 1) while middle and bottom arrows point to affected areas where the presence of calcium activatable RyRs were introduced (30% of all channels in the affected area) while ρ was set to 0.2. This allowed calcium‐induced calcium release (CICR) to initiate a propagating calcium wave. The diffusion coefficient for calcium was set to 0.53 (see Donahue & Abercrombie, 1987) and 0.3 μm2/ms in Bb and Ba, respectively. Traces below the images represent the time course of the transient in the spatial domain at the corresponding (top to bottom) arrows. C, dependence of the speed of the propagation of the calcium wave on the selected diffusion coefficient for calcium (circles). Points labelled Ba and Bb correspond to images in Ba and Bb, respectively. Triangles represent actual values measured in line‐scan images (as that in A), arrow points to the data (0.57 μm/ms) obtained from the image in A. Note that the measured values cover a much broader range that those obtained in the simulations, in many cases far beyond what would be expected for CICR. D, dependence of the speed of the propagation of the calcium wave on the sarcoplasmic reticulum calcium content. Point labelled Bb corresponds to image in Bb. In the simulation the fibre was depolarized to −10 mV for 100 ms from a holding potential of −80 mV to mimic the depolarization of the fibre in A. [Colour figure can be viewed at wileyonlinelibrary.com]
Figure 15
Figure 15. Simulation of calcium wave propagation without calcium‐induced calcium release in MTM1‐deficient muscle fibres
A and C, spatial profiles of ρ. Graphs present the change in ρ along the spatial domain (512 pixels) of the simulation. Two cases were considered: ρ either changed linearly (A) or following a second‐order polynomial (C) from 1 to 0.8 in the affected region. B and D, simulated line‐scan images using the ρ profiles from A and C, respectively (τ = 400 ms; R m = 0). Upper arrows point to areas where activation is normal, while middle and bottom arrows point to affected areas. Traces below the images represent the time course of the transient at the corresponding (top to bottom) arrows. Note the appearance of a clear wave front in both images. Note also that the wave front seems to ‘curve’ in B (i.e. the calculated speed of ‘propagation’ would be different at different spatial positions) while it is linear for the most part in C (i.e. the calculated speed of ‘propagation’ would be constant at different spatial positions). In the simulation the fibre was depolarized to −10 mV for 100 ms from a holding potential of −80 mV. E, triangles represent actual values measured (M) in line‐scan images (same as that in C in Fig. 14), a, b (circles) and c (square) label the data obtained from the images in B and D. [Colour figure can be viewed at wileyonlinelibrary.com]

Similar articles

Cited by

References

    1. Adrian, R. H. , Chandler, W. K. , & Hodgkin, A. L. (1969). The kinetics of mechanical activation in frog muscle. The Journal of Physiology, 204(1), 207–230. - PMC - PubMed
    1. Al‐Qusairi, L. , Weiss, N. , Toussaint, A. , Berbey, C. , Messaddeq, N. , Kretz, C. , Sanoudou, D. , Beggs, A. H. , Allard, B. , Mandel, J. L. , Laporte, J. , Jacquemond, V. , & Buj‐Bello, A. (2009). T‐tubule disorganization and defective excitation‐contraction coupling in muscle fibres lacking myotubularin lipid phosphatase. Proceedings National Academy of Science USA, 106(44), 18763–18768. - PMC - PubMed
    1. Annoussamy, M. , Lilien, C. , Gidaro, T. , Gargaun, E. , Chê, V. , Schara, U. , Gangfuß, A. , D'Amico, A. , Dowling, J. J. , Darras, B. T. , Daron, A. , Hernandez, A. , de Lattre, C. , Arnal, J. M. , Mayer, M. , Cuisset, J. M. , Vuillerot, C. , Fontaine, S. , Bellance, R. , …, Servais, L. (2019). X‐linked myotubular myopathy: A prospective international natural history study. Neurology, 92(16), e1852‐e1867. - PMC - PubMed
    1. Baylor, S. M. , & Hollingworth, S. (2011). Calcium indicators and calcium signalling in skeletal muscle fibres during excitation‐contraction coupling. Progress in Biophysics and Molecular Biology, 105(3), 162–179. - PMC - PubMed
    1. Bodnar, D. , Geyer, N. , Ruzsnavszky, O. , Olah, T. , Hegyi, B. , Sztretye, M. , Fodor, J. , Dienes, B. , Balogh, A. , Papp, Z. , Szabo, L. , Muller, G. , Csernoch, L. , & Szentesi, P. (2014). Hypermuscular mice with mutation in the myostatin gene display altered calcium signalling. The Journal of Physiology, 592(6), 1353–1365. - PMC - PubMed

Publication types

MeSH terms