Cholesterol transfer via endoplasmic reticulum contacts mediates lysosome damage repair
- PMID: 36408828
- PMCID: PMC9753466
- DOI: 10.15252/embj.2022112677
Cholesterol transfer via endoplasmic reticulum contacts mediates lysosome damage repair
Abstract
Lysosome integrity is essential for cell viability, and lesions in lysosome membranes are repaired by the ESCRT machinery. Here, we describe an additional mechanism for lysosome repair that is activated independently of ESCRT recruitment. Lipidomic analyses showed increases in lysosomal phosphatidylserine and cholesterol after damage. Electron microscopy demonstrated that lysosomal membrane damage is rapidly followed by the formation of contacts with the endoplasmic reticulum (ER), which depends on the ER proteins VAPA/B. The cholesterol-binding protein ORP1L was recruited to damaged lysosomes, accompanied by cholesterol accumulation by a mechanism that required VAP-ORP1L interactions. The PtdIns 4-kinase PI4K2A rapidly produced PtdIns4P on lysosomes upon damage, and knockout of PI4K2A inhibited damage-induced accumulation of ORP1L and cholesterol and led to the failure of lysosomal membrane repair. The cholesterol-PtdIns4P transporter OSBP was also recruited upon damage, and its depletion caused lysosomal accumulation of PtdIns4P and resulted in cell death. We conclude that ER contacts are activated on damaged lysosomes in parallel to ESCRTs to provide lipids for membrane repair, and that PtdIns4P generation and removal are central in this response.
Keywords: cholesterol; lysosome; membrane contact site; membrane repair; phosphoinositide.
© 2022 The Authors. Published under the terms of the CC BY NC ND 4.0 license.
Figures
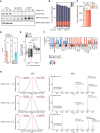
Representative western blot showing purity of immuno‐affinity purified lysosomal (LAMP1+) and negative control (IgG Control) treated with 250‐μM LLOMe for 0, 10 min, and 45 min. Membrane was probed using anti‐TOM20 and anti‐Calnexin antibodies to verify the absence of mitochondrial and ER membrane, respectively. Enrichment of lysosomes was judged by using an anti‐LAMP1 antibody.
Numbers of lipid species identified in the produced WCLs and LAMP1+ fraction, belonging to the lipid categories of glycerophospholipids (GPL), sphingolipids (SL), and sterol lipids (ST).
Total molar quantities of lipids identified in aliquots of the whole‐cell lysates (WCL) produced during lysosome purification.
Mol% values of the cardiolipin (CL) and bis(monoacylglycero)phosphate/phosphatidylglycerol (BMP/PG) classes in the LAMP1+ fraction and WCL of untreated HeLa cells. BMP and PG classes are isobaric and reported together as BMP/PG.
Enrichment of individual BMP/PG species after purification (log2‐transformed fold change, mol% in LAMP1+: mol% in WCL) presented as box plots with individual species as circles, the central band representing the median, the box the upper and lower quartiles, and the whiskers the highest and lowest values. Species are grouped according to the total number of acyl double bonds.
Enrichment of monitored lipid classes (log2‐transformed fold change, mol% in LAMP1+: mol% in WCL) after purification of lysosomes from untreated cells, presented in a heatmap. The bar plot depicts the percentage of species in the individual classes having positive or negative values of log2 fold changes.
Representative mass spectra of three PtdInsP species. Precursor ions detected in the MS1 and their theoretical m/z values (MS1) and MS2 spectra obtained after their fragmentations, displaying the relative intensities of the ions.
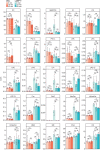

Total molar quantity of lipids identified in the produced LAMP1‐positive (LAMP1+) and the corresponding IgG negative control fractions, produced from HeLa cells treated with LLOMe for 0, 10, or 45 min.
Molar percentages (mol%) values of lipid categories of glycerophospholipids (GPL), sphingolipids (SL), and sterol lipids (ST) in the LAMP1+ fractions and the corresponding whole‐cell lysate (WCL).
LLOMe‐induced fold change (log2‐transformed) in the mol% values of lipid classes in the WCLs and LAMP1+ fractions, in the first 10 min (mol% at 10 min: mol% at 0 min) and the following 45 min (mol% at 45 min: mol% at 10 min) of treatment.
Mol% values of diacyl‐GPL lipid classes phosphatidylcholine (PC) and phosphatidylserine (PS), and cholesterol (Chol) in the LAMP1+ fractions.
Mean total numbers of acyl double bonds in the PC and PS classes in the WCLs and LAMP1+ fractions.
Ion intensities of dehydrated phosphorylinositol headgroup recorded in MS2 after fragmentation of [M‐2H]2− ions of phosphatidylinositol phosphate (PtdInsP) species detected in the negative ion mode MS1. Intensities measured in the four replicates are displayed in individual rows.
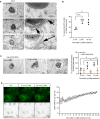
Representative electron micrographs of HeLa cells treated or not with 250 μM LLOMe for 5 or 10 min before chemical fixation. Cells were incubated for 4 h following washing steps and overnight incubation with 15‐nm gold nanoparticles conjugated to bovine serum albumin to visualize lysosomes (black spots inside lysosomes are internalized gold nanoparticles) before treatment with LLOMe and processing of samples for electron microscopy. Arrows indicate areas with increased lysosome–ER contacts.
Quantification of electron micrographs showing an increase in membrane contact sites between ER and lysosomes following 250‐μM LLOMe treatment for 5 or 10 min. Error bars denote ± SD from n = 3 independent experiments, > 48 lysosomes were quantified per experiment for each condition. Statistical significance was determined using one‐way ANOVA with Dunnett's multiple comparisons test, *P < 0.05, **P < 0.01.
Representative electron micrographs of VAP double knockout HeLa cells that were either left untreated or incubated with 250 μM LLOMe for 5 or 10 min before chemical fixation. Cells were incubated with 15‐nm gold nanoparticles conjugated to bovine serum albumin for 4 h to visualize lysosomes. After 4 h, gold nanoparticles were washed off and cells were incubated overnight before treatment with LLOMe and processing samples for electron microscopy (same as in A). Quantification of electron micrographs showing no increase in membrane contact sites between ER and lysosomes following 250‐μM LLOMe treatment for 5 or 10 min in VAP double knockout cells. Error bars denote ± SD from n = 3 independent experiments, > 40 lysosomes were quantified per experiment for each condition. Statistical significance was determined using one‐way ANOVA with Tukey's multiple comparisons test, *P < 0.05, ns = not statistically significant.
Representative movie stills of a live‐cell imaging experiment illustrating the recruitment of transiently expressed eGFP‐ORP1L to lysosomes following 250‐μM LLOMe treatment. Cells were pre‐treated for 30 min with 75 nM Lysotracker Deep Red to monitor lysosome damage (judged by the decreased number of Lysotracker spots after LLOMe treatment). The graph represents the quantification of eGFP‐ORP1L foci per cell after LLOMe treatment. Error bars denote ± SEM from n = 3 independent live‐cell imaging experiments, > 25 cells were analyzed per experiment.
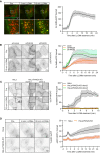
Movie stills from a live‐cell imaging experiment showing rapid 2xSidM‐eGFP recruitment to damaged lysosomes upon 250‐μM LLOMe treatment (indicated in green). Lysosomes were visualized using transiently overexpressed LAMP1‐mCherry (indicated in red). Yellow spots show colocalized PtdIns4P probe (2xSidM‐eGFP) and LAMP1‐mCherry after 3 and 10 min of LLOMe treatment. The graph shows the quantification of 2xSidM‐eGFP foci per cell after LLOMe treatment. Error bars denote ± SEM from n = 3 independent live‐cell imaging experiments, > 20 cells were analyzed per experiment.
HeLa cells were transfected with control siRNA or siRNA targeting PI4K2A or PI4K2B for 48 h (KD efficiency is shown in Fig EV5C) and transiently transfected with the 2xSidM‐eGFP probe to monitor PtdIns4P recruitment after LLOMe treatment by live‐cell imaging. Representative movie stills show the dynamics of 2xSidM‐eGFP recruitment in control, PI4K2A, and PI4K2B depleted cells. The graph represents the quantification of 2xSidM‐eGFP foci per cell after LLOMe treatment. Error bars denote ± SEM from n = 3 independent live‐cell imaging experiments, > 25 cells were analyzed per experiment for each condition.
CRISPR‐Cas9‐mediated knockout of PI4K2A abolishes recruitment of the 2xSidM‐eGFP probe (PtdIns4P) to damaged lysosomes. Two different clones (clone 2 and clone 3) were tested. The graph represents the quantification of 2xSidM‐eGFP foci per cell after LLOMe treatment. Error bars denote ± SD from n = 2 independent live‐cell imaging experiments, > 20 cells were analyzed per experiment for each condition.
Representative movie stills from live fluorescence microscopy showing reduced eGFP‐ORP1L recruitment in PI4K2A knockout cells compared to wild‐type HeLa cells upon treatment with 250‐μM LLOMe. The graph represents the quantification of eGFP‐ORP1L foci per cell after LLOMe treatment. Error bars denote ± SEM from n = 4 independent live‐cell imaging experiments, > 80 cells were analyzed per experiment for each condition.
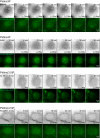

Movie stills from live‐cell imaging experiments of HeLa cells transiently expressing the PtdIns4P probe 2xSidM‐eGFP and the lysosomal marker LAMP1‐mCherry. Cells were incubated with 10‐nM PI4K3A inhibitor GSK‐A1 for approximately 16 min before 250‐μM LLOMe was added.
Movie stills from live‐cell imaging experiments of HeLa cells transiently expressing the PtdIns4P probe 2xSidM‐eGFP and the lysosomal marker LAMP1‐mCherry. Cells were incubated with 25‐nM PI4K3B inhibitor PI4K3B‐IN‐10 for approximately 30 min before 250‐μM LLOMe was added.
Knockdown efficiency of siRNA against PI4K2A or CRISPR‐Cas9‐mediated knockout of PI4K2A (clone 2 and clone 3) as detected by western blot using an anti‐PI4K2A antibody. β‐actin used as a loading control.
Exogenous expression of PI4K2A‐mNG and the PtdIns4P probe SidM‐mCherry in clone 2 and clone 3 of PI4K2A‐KO cells shows recruitment of SidM‐mCherry after incubation with 250‐μM LLOMe.
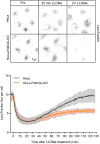
HeLa cells were co‐transfected with siRNAs targeting ESCRT proteins TSG101 and ALIX (siTSG101 + siALIX) or with non‐targeting siRNA control (siControl) and incubated for 24 h before transfection with the PtdIns4P binding probe 2xSidM‐eGFP. Twenty‐four‐hour post‐transfection, lysosomes were damaged with 250‐μM LLOMe and PtdIns4P recruitment to damaged lysosomes was monitored using the 2xSidM‐eGFP probe in live‐cell imaging experiments. The graph shows the quantification of 2xSidM‐eGFP foci per cell in cells co‐depleted of TSG101 + ALIX and control (siControl) cells. Error bars denote ± SD from n = 2 independent live‐cell imaging experiments, > 27 cells were analyzed per experiment for each condition.
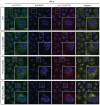
Representative fluorescence micrographs of HeLa‐PI4K2A knockout cells treated with 250‐μM LLOMe or an equal volume of DMSO (Pre) for 5 min, 15 min, and 1 h before fixation and immunostained with Hoechst (blue), anti‐CHMP4B (red), anti‐GAL3 (green), and anti‐ALIX (white).

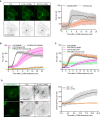
Representative movie stills of a live‐cell imaging experiment illustrate faster recruitment of the PtdIns4P probe 2xSidM‐eGFP to damaged lysosomes when compared to cholesterol as indicated by the mCherry‐D4 probe. The graph shows the quantification of 2xSidM‐eGFP and mCherry‐D4 foci per cell. Error bars denote ± SD from n = 2 independent live‐cell imaging experiments, > 26 cells were analyzed per experiment for each condition.
Graph showing quantification of mCherry‐D4 and 2xSidM‐eGFP foci per cell in parental HeLa cells (Ctrl) and PI4K2A knockout cells (PI4K2A‐KO). Error bars correspond to ± SEM from n = 3 independent experiments, > 30 cells per condition were analyzed.
Quantification graph of 2xSidM‐eGFP and mCherry‐D4 foci per cell in HeLa and VAP double knockout cells. Error bars denote ± SEM from n = 3 independent experiments, > 30 cells per condition were analyzed.
HeLa cells expressing an eGFP‐tagged ORP1L mutant incapable of binding to VAP (mFFAT) show no accumulation of the cholesterol reporter mCherry‐D4 upon lysosomal damage induced with 250‐μM LLOMe when compared to wild‐type (wt) eGFP‐ORP1L. The quantification graph shows D4‐mCherry foci per cell. Error bars denote ± SEM from n = 4 independent live‐cell imaging experiments, > 50 cells were analyzed per experiment for each condition.
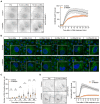
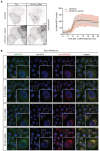
Representative movie stills from live‐cell imaging experiments indicate recruitment of CHMP4B‐eGFP to damaged lysosomes in control and U18666A‐treated cells. HeLa cells stably expressing CHMP4B‐eGFP were treated with 2 μM U18666A for 17 h before treatment with 250‐μM LLOMe. The graph shows the quantification of CHMP4B‐eGFP foci per cell. Error bars denote ± SEM from n = 4, > 30 cells per experiment for each condition.
Representative immunofluorescence images illustrate Galectin‐3 recruitment kinetics on the damaged lysosomes upon treatment with 2 μM U18666A for 17 h. HeLa cells were treated or not (Control) with U18666A and ± LLOMe for the indicated time points, fixed, and processed for immunofluorescence microscopy. Endogenous levels of Galectin‐3 were visualized.
Number of Galectin‐3‐positive dots per cell was automatically quantified from the dataset described in (B). Error bars denote ± SEM from n = 3 independent experiments. > 225 cells were analyzed per condition, and distribution was visualized as violin plots. One‐way ANOVA, Tukey's multiple comparisons test, **P < 0.01, ***P < 0.001, ns = not statistically significant.
Representative movie stills from live‐cell imaging experiments indicate recruitment of the PtdIns4P probe 2xSidM‐eGFP to damaged lysosomes in control but not in the U18666A‐treated cells. HeLa cells were treated with 2 μM U18666A for 17 h before treatment with 250‐μM LLOMe. The graph shows the quantification of 2xSidM‐eGFP foci per cell. Error bars denote ± SEM from n = 3 independent experiments, > 25 cells per experiment for each condition.
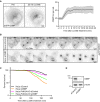
Representative movie stills of a live‐cell imaging experiment show recruitment dynamics of transiently expressed eGFP‐OSBP in HeLa cells treated with 250‐μM LLOMe. The graph shows quantifications of OSBP foci per cell. Error bars denote ± SEM from n = 5 independent live‐cell imaging experiments, > 22 cells per experiment.
Representative movie montage from a live‐cell fluorescence imaging experiment indicating accumulation of the 2xSidM‐eGFP probe and subsequent cell death in cells depleted of OSBP compared to control following treatment with 250‐μM LLOMe.
Kaplan–Meier plot represents a decrease in cell viability in siRNA knockdown of OSBP (HeLa siOSBP) as compared to control cells (HeLa siControl). The rapid cell death observed in HeLa cells depleted of OSBP was ameliorated with PtdIns4P depletion (HeLa‐PI4K2A‐KO siOSBP and HeLa‐PI4K2A‐KO siControl). The graph represents data from n = 3 independent live‐cell imaging experiments, > 100 cells per experiment for each condition.
Knockdown efficiency of siRNA depletion of OSBP in HeLa cells as detected by western blot. β‐actin used as a loading control.

Similar articles
-
A phosphoinositide signalling pathway mediates rapid lysosomal repair.Nature. 2022 Sep;609(7928):815-821. doi: 10.1038/s41586-022-05164-4. Epub 2022 Sep 7. Nature. 2022. PMID: 36071159 Free PMC article.
-
RILP Induces Cholesterol Accumulation in Lysosomes by Inhibiting Endoplasmic Reticulum-Endolysosome Interactions.Cells. 2024 Aug 6;13(16):1313. doi: 10.3390/cells13161313. Cells. 2024. PMID: 39195203 Free PMC article.
-
ER-lysosome contacts enable cholesterol sensing by mTORC1 and drive aberrant growth signalling in Niemann-Pick type C.Nat Cell Biol. 2019 Oct;21(10):1206-1218. doi: 10.1038/s41556-019-0391-5. Epub 2019 Sep 23. Nat Cell Biol. 2019. PMID: 31548609 Free PMC article.
-
Cholesterol transfer at endosomal-organelle membrane contact sites.Curr Opin Lipidol. 2018 Jun;29(3):212-217. doi: 10.1097/MOL.0000000000000506. Curr Opin Lipidol. 2018. PMID: 29629999 Review.
-
Lysosomal quality control Review.Autophagy. 2025 Jul;21(7):1413-1432. doi: 10.1080/15548627.2025.2469206. Epub 2025 Feb 24. Autophagy. 2025. PMID: 39968899 Free PMC article. Review.
Cited by
-
Annexin A7 mediates lysosome repair independently of ESCRT-III.Front Cell Dev Biol. 2024 Jan 23;11:1211498. doi: 10.3389/fcell.2023.1211498. eCollection 2023. Front Cell Dev Biol. 2024. PMID: 38348092 Free PMC article.
-
Lysosomal physiology and pancreatic lysosomal stress in diabetes mellitus.eGastroenterology. 2024 Oct;2(3):e100096. doi: 10.1136/egastro-2024-100096. Epub 2024 Aug 29. eGastroenterology. 2024. PMID: 39512752 Free PMC article.
-
RpH-ILV: Probe for lysosomal pH and acute LLOMe-induced membrane permeabilization in cell lines and Drosophila.Sci Adv. 2025 Jan 3;11(1):eadr7325. doi: 10.1126/sciadv.adr7325. Epub 2025 Jan 3. Sci Adv. 2025. PMID: 39752501 Free PMC article.
-
Phosphoinositide switches in cell physiology - From molecular mechanisms to disease.J Biol Chem. 2024 Mar;300(3):105757. doi: 10.1016/j.jbc.2024.105757. Epub 2024 Feb 15. J Biol Chem. 2024. PMID: 38364889 Free PMC article. Review.
-
Collapse of late endosomal pH elicits a rapid Rab7 response via the V-ATPase and RILP.J Cell Sci. 2024 May 1;137(9):jcs261765. doi: 10.1242/jcs.261765. Epub 2024 May 13. J Cell Sci. 2024. PMID: 38578235 Free PMC article.
References
-
- Ballabio A, Bonifacino JS (2020) Lysosomes as dynamic regulators of cell and organismal homeostasis. Nat Rev Mol Cell Biol 21: 101–118 - PubMed
-
- Bilgin M, Nylandsted J, Jaattela M, Maeda K (2017) Quantitative profiling of lysosomal lipidome by shotgun lipidomics. Methods Mol Biol 1594: 19–34 - PubMed
Publication types
MeSH terms
Substances
LinkOut - more resources
Full Text Sources
Other Literature Sources
Research Materials

