Stearate-derived very long-chain fatty acids are indispensable to tumor growth
- PMID: 36408830
- PMCID: PMC9841326
- DOI: 10.15252/embj.2022111268
Stearate-derived very long-chain fatty acids are indispensable to tumor growth
Erratum in
-
Stearate-derived very long-chain fatty acids are indispensable to tumor growth.EMBO J. 2023 Sep 4;42(17):e114802. doi: 10.15252/embj.2023114802. Epub 2023 Jul 27. EMBO J. 2023. PMID: 37496466 Free PMC article.
Abstract
Reprogramming of lipid metabolism is emerging as a hallmark of cancer, yet involvement of specific fatty acids (FA) species and related enzymes in tumorigenesis remains unclear. While previous studies have focused on involvement of long-chain fatty acids (LCFAs) including palmitate in cancer, little attention has been paid to the role of very long-chain fatty acids (VLCFAs). Here, we show that depletion of acetyl-CoA carboxylase (ACC1), a critical enzyme involved in the biosynthesis of fatty acids, inhibits both de novo synthesis and elongation of VLCFAs in human cancer cells. ACC1 depletion markedly reduces cellular VLCFA but only marginally influences LCFA levels, including palmitate that can be nutritionally available. Therefore, tumor growth is specifically susceptible to regulation of VLCFAs. We further demonstrate that VLCFA deficiency results in a significant decrease in ceramides as well as downstream glucosylceramides and sphingomyelins, which impairs mitochondrial morphology and renders cancer cells sensitive to oxidative stress and cell death. Taken together, our study highlights that VLCFAs are selectively required for cancer cell survival and reveals a potential strategy to suppress tumor growth.
Keywords: acetyl-CoA carboxylase; fatty acid elongation; fatty acid synthase; mitochondria potential; very long-chain fatty acids.
© 2022 The Authors.
Figures

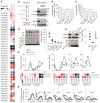
A scheme to show de novo synthesis of palmitate and fatty acid elongation achieved by enzymes, ELOLVs, KAR, HACDs, and TECR.
Western blot verification of knockout of FASN, ACC1, and/or ACC2 in MDA‐MB‐231 cells.
Cell proliferation rate of MDA‐MB‐231 and HeLa cells with knockout of FASN, ACC1, and/or ACC2.
Colony formation ability of MDA‐MB‐231 cells with knockout of FASN, ACC1, and/or ACC2.
Invasion ability of MDA‐MB‐231 cells with knockout of FASN, ACC1, and/or ACC2. The right panel shows the pictures of invasive cells, and the cell numbers are quantified in the left panel. Scale bar: 20 μm.
Tumor formation ability in nude mice of MDA‐MB‐231 and HeLa cells with gene knockout as indicated.

Western blot verification of knockout of FASN, ACC1, and/or ACC2 in HeLa cells.
Colony formation ability of HeLa cells with knockout of FASN, ACC1 and/or ACC2.
Western blot verification of knockout of FASN, ACC1, and/or ACC2 in MCF7 cells.
Cell proliferation rate of MCF7 cells with knockout of FASN, ACC1, and/or ACC2.
Colony formation ability of MCF7 cells with knockout of FASN, ACC1, and/or ACC2. The right panel shows the pictures of colonies, and the colony numbers are quantified in the left panel.
Invasion ability of MCF7 cells with knockout of FASN, ACC1, and/or ACC2. The right panel shows the pictures of invasive cells, and the cell numbers are quantified in the left panel. Scale bar: 50 μm.

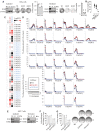
Relative cellular levels of acetyl‐CoA and malonyl‐CoA in MDA‐MB‐231 cells with knockout of FASN, ACC1, and/or ACC2.
Binomial distribution model of 13C6‐glucose‐labeled fatty acids indicates de novo synthesis of fatty acids and elongation of existing precursors.
Mass isotopomer analysis of fatty acids in MDA‐MB‐231 cells with knockout of FASN, ACC1, and/or ACC2 cultured with 10 mM of 13C6‐glucose for 48 h. Solid arrows show the reported pathways; dotted arrows indicate the possible pathways based on the labeling results.
Relative cellular levels of fatty acids in MDA‐MB‐231 cells with knockout of FASN, ACC1 and/or ACC2. Each colored datum shows the mean from three independent cultures.

Mass isotopomer analysis of fatty acids in HeLa cells with knockout of FASN, ACC1, and/or ACC2 cultured with 10 mM of 13C6‐glucose for 48 h. Results are shown as mean ± SD from three independent cultures.
Relative cellular levels of fatty acids in HeLa cells with knockout of FASN, ACC1, and/or ACC2. Each colored datum shows the mean from three independent cultures.

- A
Relative cellular levels of lipids in MDA‐MB‐231 cells with knockout of FASN, ACC1, and/or ACC2. Each colored datum shows the mean from three independent cultures. TG, triglyceride; DHCeramide, dihydroceramide; Hex1Cer, hexosylceramide; Hex2Cer, dihexosylceramide; Hex3Cer, trihexosylceramide; GM3, monosialodihexosylganglioside; SM, sphingomyelin; PC, phosphatidylcholine; PE, phosphatidylethanolamine; PG, phosphatidylglycerol; PI, phosphatidylinositol; PS, phosphatidylserine; PC(o) and PE(o), ether lipids.
- B–D
Relative cellular levels of lipid‐containing fatty acids in MDA‐MB‐231 cells with knockout of FASN, ACC1, and/or ACC2. The top curve plot indicates the fraction of the corresponding fatty acid. Each colored datum shows the mean from three independent cultures.
- E
Correlation of lipid‐containing fatty acids in MDA‐MB‐231 cells with knockout of FASN, ACC1 or ACC2 with those of ACC1/2‐DKO cells. Each datum is mean from three independent cultures.
- F
Relationship between cellular level and carbon number of lipid‐contained fatty acids in MDA‐MB‐231 cells with ACC1/2‐DKO.

- A
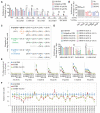
Western blot verification of knockout of KAR or TECR in MDA‐MB‐231 cells.
- B, C
Cell proliferation rate and colony formation ability of MDA‐MB‐231 cells with knockout of KAR or TECR. Error bars represent mean ± SD. Data are from triplicate experiments, and all experimental data were verified in at least two independent experiments. **P < 0.01 (t‐test); asterisk shows comparison with wild‐type group.
- D, E
Tumor formation ability in nude mice of MDA‐MB‐231 cells with gene knockout, as indicated. Error bars represent mean ± SD (n = 6 for D, n = 8 for E).
- F
Relative cellular levels of fatty acids in MDA‐MB‐231 cells with knockout of KAR or TECR. Each colored datum shows the mean from three independent cultures.
- G
Relative cellular levels of lipid‐containing fatty acids in MDA‐MB‐231 cells with knockout of KAR or TECR. The top curve plot indicates the fraction of the corresponding fatty acid. Each colored datum shows the mean from three independent cultures.
- H
Mass isotopomer analysis of fatty acids in MDA‐MB‐231 cells with knockout of KAR or TECR cultured with 10 mM of 13C6‐glucose for 48 h. Error bars represent mean ± SD. Data are from three independent cultures.

Western blot verification of knockout of KAR or TECR in HeLa cells and colony formation ability of HeLa cells with knockout of KAR or TECR.
Tumor formation ability in nude mice of HeLa cells with KAR or TECR knockout as indicated. The tumor picture was shown in Fig 1F.
Relative cellular levels of fatty acids in HeLa cells with knockout of KAR or TECR. Each colored datum shows the mean from three independent cultures.
Mass isotopomer analysis of fatty acids in HeLa cells with knockout of KAR or TECR cultured with 10 mM of 13C6‐glucose for 48 h. Results are shown as mean ± SD from three independent cultures.
Western blot verification of knockout of KAR or TECR in MCF7 cells.
Cell proliferation rate of MCF7 cells with knockout of KAR or TECR.
Colony formation of MCF7 cells with knockout of KAR or TECR. The right panel shows the pictures of colonies, and the colony numbers are quantified in the left panel.

Proliferation rate of MDA‐MB‐231 cells with gene knockout, as indicated, in FBS medium or delipidized FBS (DFBS) medium supplemented with 0, 10, or 20 μM of palmitate.
Proliferation rate of MDA‐MB‐231/ACC‐DKO in FBS medium or DFBS medium supplemented with or without exogenous LCFAs (2 μM FA 16:0, 2 μM 18:0, 2 μM FA 20:0) or VLCFAs (2 μM FA 22:0, 2 μM FA 24:0, 2 μM FA 26:0).
A scheme to show the elongation of fatty acids from precursors.
Proliferation rate of MDA‐MB‐231/FASN‐KO cells in FBS medium or DFBS medium supplemented with or without 10 μM of fatty acids as indicated.
Mass isotopomer analysis of fatty acids in MDA‐MB‐231/FASN‐KO cells in FBS medium or DFBS medium supplemented with or without 20 μM of stearate. Cells were cultured with 25 mM of 13C6‐glucose for 36 h.
Relative cellular levels of fatty acids in MDA‐MB‐231/FASN‐KO cells in FBS medium or DFBS medium supplemented with or without 20 μM of stearate.

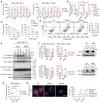
MDA‐MB‐231 Wt cells or ACC‐DKO cells were pretreated for 24 h and then cultured in FBS medium or DFBS medium with the indicated treatment for 5 days. Treatments were as follows: z‐VAD‐FMK (z‐VAD, 10 μM), necrostain‐1 (Nec‐1, 2 μM), Disulfiram (0.4 μM), ferrostain‐1 (Ferr‐1, 10 μM), Trolox (100 μM), N‐Acetyl‐L‐cysteine (NAC, 3 mM), and deferoxamine mesylate (DFOM, 10 μM). Data are presented relative to the values obtained for the control cells cultured in FBS medium. Dotted line shows the survival level of cells in DFBS medium without treatment (control).
Relative cellular levels of ROS in MDA‐MB‐231/ACC‐DKO and Wt cells cultured in FBS medium or DFBS medium for 5 days with or without exogenous VLCFA supplement.
The inhibitory effects of H2O2 and PMS on MDA‐MB‐231 ACC‐DKO or Wt cells cultured in FBS medium for 24 h with indicated concentrations.
The protein levels of PARP1 and caspase‐3 in MDA‐MB‐231/ACC‐DKO and Wt cultured in FBS or DFBS medium.
Annexin‐V & Dead cell (7‐AAD) flow cytometry analysis of MDA‐MB‐231/ACC‐DKO and Wt cultured in DFBS medium. The right panel shows the quantification of annexin V‐positive cells in the left panels.
The relative cell survival of MDA‐MB‐231/ACC‐DKO or Wt with control vector or Bcl‐2 or Bcl‐xL overexpression cultured in FBS medium or DFBS medium for 5 days. The left panels show the cell survival, and the right panels verify the overexpression of Bcl‐2 and Bcl‐xL.
The transmembrane potential in mitochondria of MDA‐MB‐231/ACC‐DKO and Wt cells cultured in FBS medium or DFBS medium was detected by FACS analysis. The bar graphs show the percentage of JC‐1 monomer.
MDA‐MB‐231/ACC‐DKO and Wt cells were stained for Mito Tracker to visualize mitochondria. Scale bar, 10 μm. Mitochondrial morphology was scored in the cell types indicated. Data represent three independent experiments, and at least 100 cells were counted per cell type.

- A
HeLa/ACC‐DKO cells or Wt cells were pretreated for 24 h and then cultured in FBS medium or DFBS medium with indicated treatment for 5 days. Treatments were as follows: z‐VAD (10 μM), Ferr‐1 (10 μM), Trolox (100 μM), and NAC (3 mM). Data are presented relative to the values obtained for the control cells cultured in FBS medium. Dotted line shows the survival level of cells in DFBS medium without treatment (control).
- B
Relative cellular levels of ROS in HeLa/ACC‐DKO and Wt cells cultured in FBS medium or DFBS medium for 6 days.
- C
The inhibitory effects of H2O2 and PMS on HeLa/Wt and ACC‐DKO cells cultured in FBS medium for 48 h with indicated concentrations.
- D
The inhibitory effects of H2O2 and PMS on MDA‐MB‐231/Wt and TECR‐KO cells cultured in FBS medium for 24 h with indicated concentrations.
- E
The protein levels of PARP1 and caspase‐3 in HeLa/ACC‐DKO and Wt cultured in FBS medium or DFBS medium. The left panels show the cell survival, and the right panels verify the overexpression of Bcl‐2 and Bcl‐xL.
- F
The relative survival of HeLa/Wt and ACC‐DKO cells with control vector or Bcl‐2 or Bcl‐xL overexpression cultured in FBS medium or DFBS medium for 5 days.
- G, H
The transmembrane potential in mitochondria of HeLa /ACC‐DKO (G) and MDA‐MB‐231/TECR‐KO (H) cells cultured in FBS medium or DFBS medium was detected by FACS analysis.

Relative mitochondrial lipids in MDA‐MB‐231/ACC‐DKO cells. Lipids are abbreviated as in Fig 3A. Error bars represent mean ± SD, and data are from three independent cultures.
A scheme to show the synthesis of glucosylceramides and sphingomyelins.
Relative cellular levels of lipid‐containing fatty acids in MDA‐MB‐231/ACC‐DKO and Wt cells. The top curve plot indicates the fraction of the corresponding fatty acid. Each colored datum shows the mean from three independent cultures.
MDA‐MB‐231/ACC‐DKO cells were in FBS medium with or without exogenous LCFA or VLCFA supplementation and were stained for MitoTracker to visualize mitochondria. Scale bar, 10 μm.
Mitochondrial morphology in (D) was scored in the cell types indicated. Data represent three independent experiments, and at least 100 cells were counted per cell type. Error bars represent mean ± SD, and data are from triplicate experiments.

- A, B
HeLa/ACC‐DKO (A) and MDA‐MB‐231/TECR‐KO cells were stained with MitoTracker to visualize mitochondria. Scale bar, 10 μm. Mitochondrial morphology was scored in the cell types indicated. Data represent three independent experiments, and at least 100 cells were counted per cell type. **P < 0.01 (t‐test). Asterisk shows comparison with wild‐type group.
- C
Western blot verification of knockout of SPTLC1 in MDA‐MB‐231 cells.
- D–F
The cell proliferation rate (D), colony formation (E) and mitochondrial morphology (F) of SPTLC1‐knockout MDA‐MB‐231 cells. Scale bar, 10 μm. Mitochondrial morphology was scored in the cell types indicated. Data represent three independent experiments, and at least 100 cells were counted per cell type. *P < 0.05, **P < 0.01 (t‐test). Asterisk shows comparison with wild‐type group.
Similar articles
-
Fatty acid biosynthesis in Erlich cells. The mechanism of short term control by exogenous free fatty acids.J Biol Chem. 1975 Jul 25;250(14):5419-25. J Biol Chem. 1975. PMID: 237919
-
Acetyl-CoA carboxylase 1 depletion suppresses de novo fatty acid synthesis and mitochondrial β-oxidation in castration-resistant prostate cancer cells.J Biol Chem. 2023 Jan;299(1):102720. doi: 10.1016/j.jbc.2022.102720. Epub 2022 Nov 19. J Biol Chem. 2023. PMID: 36410440 Free PMC article.
-
Coordination of peroxisomal beta-oxidation and fatty acid elongation in HepG2 cells.J Biol Chem. 2004 Oct 1;279(40):41302-9. doi: 10.1074/jbc.M406766200. Epub 2004 Jul 23. J Biol Chem. 2004. PMID: 15277519
-
The role of very long chain fatty acids in yeast physiology and human diseases.Biol Chem. 2020 Nov 23;402(1):25-38. doi: 10.1515/hsz-2020-0234. Print 2020 Nov 18. Biol Chem. 2020. PMID: 33544487 Review.
-
Regulation of energy metabolism by long-chain fatty acids.Prog Lipid Res. 2014 Jan;53:124-44. doi: 10.1016/j.plipres.2013.12.001. Epub 2013 Dec 18. Prog Lipid Res. 2014. PMID: 24362249 Review.
Cited by
-
A fatty acid elongase complex regulates cell membrane integrity and septin-dependent host infection by the rice blast fungus.Mol Plant Pathol. 2024 Jul;25(7):e13494. doi: 10.1111/mpp.13494. Mol Plant Pathol. 2024. PMID: 39003585 Free PMC article.
-
Alteration of Colonic Bacterial and Fungal Composition and Their Inter- and Intra-Kingdom Interaction in Patients with Adenomas with Low-Grade Dysplasia.Microorganisms. 2023 May 18;11(5):1327. doi: 10.3390/microorganisms11051327. Microorganisms. 2023. PMID: 37317301 Free PMC article.
-
Exploring the role of ELOVLs family in lung adenocarcinoma based on bioinformatic analysis and experimental validation.BMC Cancer. 2025 Jan 10;25(1):62. doi: 10.1186/s12885-024-13415-y. BMC Cancer. 2025. PMID: 39794751 Free PMC article.
-
Integrating Single-Cell RNA-Seq and Bulk RNA-Seq Data to Explore the Key Role of Fatty Acid Metabolism in Breast Cancer.Int J Mol Sci. 2023 Aug 25;24(17):13209. doi: 10.3390/ijms241713209. Int J Mol Sci. 2023. PMID: 37686016 Free PMC article.
-
Very long-chain fatty acids accumulate in breast cancer tissue and serum.Cancer Cell Int. 2025 Aug 4;25(1):296. doi: 10.1186/s12935-025-03928-2. Cancer Cell Int. 2025. PMID: 40759952 Free PMC article.
References
Publication types
MeSH terms
Substances
LinkOut - more resources
Full Text Sources
Medical
Miscellaneous

