

Sphingosine-1-phosphate controls endothelial sphingolipid homeostasis via ORMDL
- PMID: 36408842
- PMCID: PMC9827560
- DOI: 10.15252/embr.202254689
Sphingosine-1-phosphate controls endothelial sphingolipid homeostasis via ORMDL
Abstract
Disruption of sphingolipid homeostasis and signaling has been implicated in diabetes, cancer, cardiometabolic, and neurodegenerative disorders. Yet, mechanisms governing cellular sensing and regulation of sphingolipid homeostasis remain largely unknown. In yeast, serine palmitoyltransferase, catalyzing the first and rate-limiting step of sphingolipid de novo biosynthesis, is negatively regulated by Orm1 and 2. Lowering sphingolipids triggers Orms phosphorylation, upregulation of serine palmitoyltransferase activity and sphingolipid de novo biosynthesis. However, mammalian orthologs ORMDLs lack the N-terminus hosting the phosphosites. Thus, which sphingolipid(s) are sensed by the cells, and mechanisms of homeostasis remain largely unknown. Here, we identify sphingosine-1-phosphate (S1P) as key sphingolipid sensed by cells via S1PRs to maintain homeostasis. The increase in S1P-S1PR signaling stabilizes ORMDLs, restraining SPT activity. Mechanistically, the hydroxylation of ORMDLs at Pro137 allows a constitutive degradation of ORMDLs via ubiquitin-proteasome pathway, preserving SPT activity. Disrupting S1PR/ORMDL axis results in ceramide accrual, mitochondrial dysfunction, impaired signal transduction, all underlying endothelial dysfunction, early event in the onset of cardio- and cerebrovascular diseases. Our discovery may provide the molecular basis for therapeutic intervention restoring sphingolipid homeostasis.
Keywords: ORMDL; ceramide; endothelial dysfunction; serine palmitoyltransferase; sphingolipid.
© 2022 The Authors.
Figures
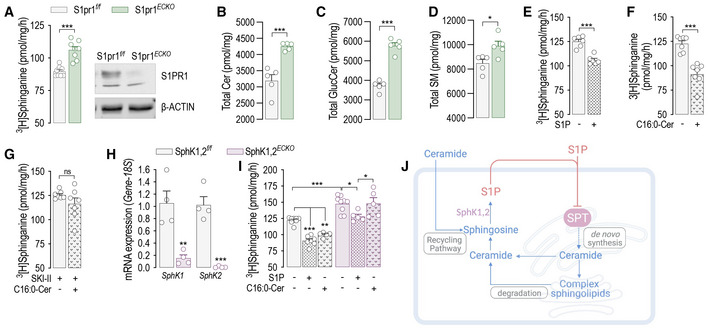
- A
SPT activity and Western blot (WB) analysis of S1PR1 in S1pr1 f/f and S1pr1 ECKO endothelial cells after 4‐OHT (1 μM, 72 h) treatment (n = 8/group from three independent EC isolations/group; four mice/EC isolation).
- B–D
LC–MS/MS quantification of Total (B) Ceramide, (C) Glucosylceramide, and (D) Sphingomyelin in S1pr1 f/f and S1Pr1 ECKO endothelial cells after 4‐OHT (1 μM, 72 h) treatment (n = 5/group from two independent EC isolations/group; four mice/EC isolation).
- E–G
SPT activity in HUVEC in (E) absence or presence of S1P (300 nM, 30′); (F) absence or presence of C16:0‐ceramide (300 nM, 30′), and (G) absence or presence of C16:0‐ceramide (300 nM, 30′), in the presence of SKI II (1 μM, 1 h pre‐treatment). (n ≥ 6 biological replicates).
- H
RT‐PCR for SphK1 and SphK2 in endothelial cells SphK1,2 f/f and SphK1,2 ECKO after 4‐OHT (1 μM, 72 h) treatment (n = 4 biological replicates).
- I
SPT activity in SphK1,2 f/f and SphK1,2 ECKO after 4‐OHT (1 μM, 72 h) treatment in absence or presence of S1P (300 nM, 30′) or C16:0‐ceramide (300 nM, 30′) (n ≥ 5/group from three independent EC isolations/group; four mice/EC isolation).
- J
Graphical abstract of the figures findings.
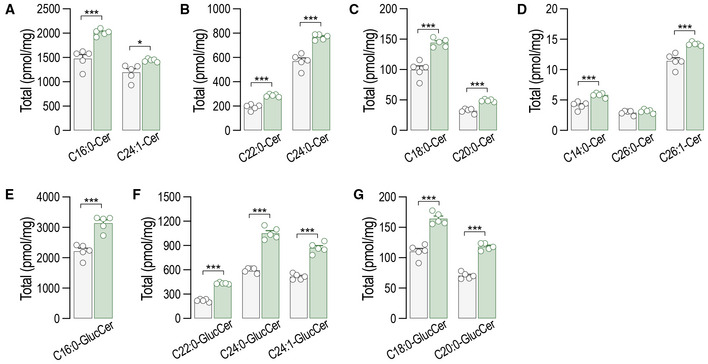
- A–G
LC–MS/MS quantification of total and specific (A–D) ceramides and (E–G) glucosylceramides in S1pr1 f/f and S1pr1 ECKO mEC after 4‐OHT (1 μM, 72 h) treatment (n = 5/group from two independent EC isolations/group; four mice/EC isolation).
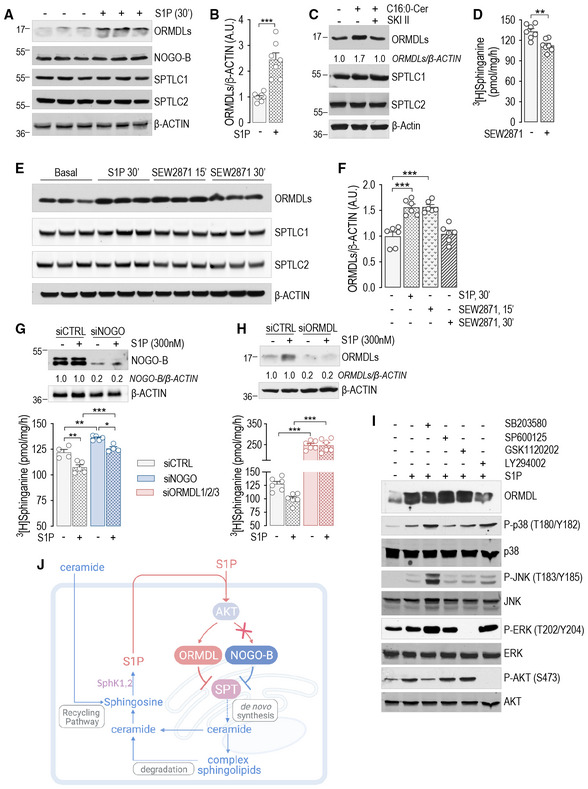
- A, B
(A) WB analysis of ORMDLs, NOGO‐B, SPTLC1, and SPTLC2 in HUVEC lysates in the absence or presence of S1P (300 nM, 30′) and (B) relative ORMDLs quantification (n = 7 biological replicates).
- C
WB analysis of ORMDLs, SPTLC1, and SPTLC2 in HUVEC lysates in the absence or presence of C16:0‐ceramide (300 nM, 30′), with or without SKI II 1 μM, 1 h pre‐treatment.
- D
SPT activity in HUVEC in the absence or presence of SEW2871 (300 nM, 15′) (n = 7 biological replicates).
- E, F
(E) WB analysis of ORMDLs, SPTLC1, and SPTLC2 in HUVEC lysates in the absence or presence of SEW2871 (300 nM, 15′ and 30′) and (F) relative ORMDLs quantification (n = 6 biological replicates).
- G, H
SPT activity and WB analysis of HUVEC treated with (G) siCTRL and siNOGO (40 nM, 72 h) (n ≥ 4/group), or with (H) siCTRL and siORMDL1/2/3 (40 nM, 72 h) (n = 4 biological replicates).
- I
WB analysis of ORMDLs, P‐p38, p38, P‐JNK, JNK, P‐ERK, ERK, P‐AKT, and AKT in HUVEC lysates in the absence or presence of the indicated inhibitors, with or without S1P (300 nM, 30′).
- J
Graphical abstract of the figures findings.
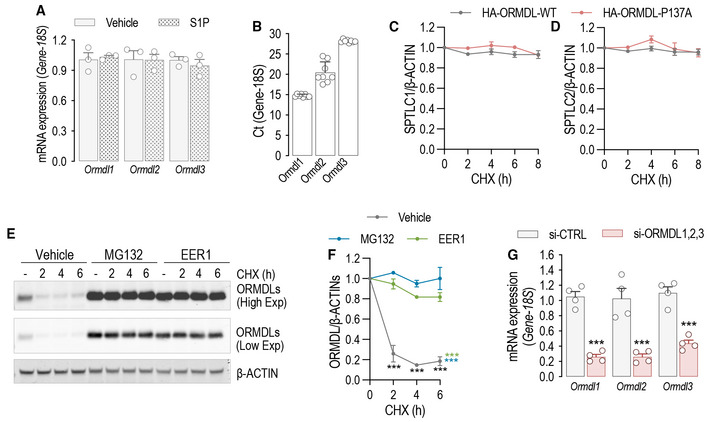
- A
RT‐PCR for Ormdl1, Ormdl2, and Ormdl3 in the presence or absence of S1P (300 nM, 30′) (n = 3 biological replicates).
- B
Ormdl isoforms mRNA abundance determined subtracting the Ct of housekeeping 18S from the Ct of Ormdls (n = 8 biological replicates).
- C, D
Quantification of © SPTLC1 and (D) SPTLC2 levels from Fig 1G.
- E, F
(E) Western blot analysis for ORMDLs in HUVEC lysates treated with CHX (10 μM) for the indicated period of time, in the presence or absence of MG132 (10 μM) or EER1 (10 μM) and (F) relative quantification.
- G
RT‐PCR for Ormdl1, Ormdl2, and Ormdl3 before and after independent silencing with the corresponding siRNA (40 nM, 72 h) (n = 4 biological replicates).
- A
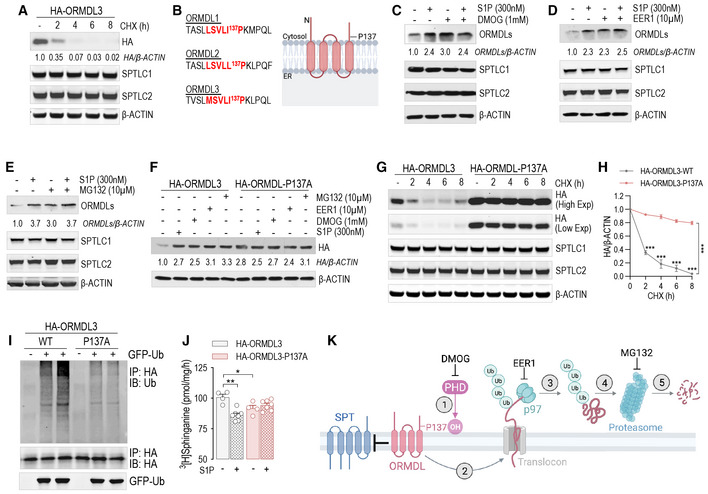
WB analysis of ORMDL3 (HA), SPTLC1, and SPTLC2 in HUVEC lysates expressing HA‐ORMDL3 and treated with cycloheximide (CHX, 10 μM) for the indicated period of time.
- B
Prolyl hydroxylase consensus sequence in the three ORMDL isoforms.
- C–E
WB analysis of ORMDLs, SPTLC1, and SPTLC2 in HUVEC lysates in absence or presence of S1P (300 nM, 30′) and with or without (C) DMOG (1 mM, 1 h pre‐treatment), (D) Eeyarestatin 1 (EER1, 10 μM, 1 h pre‐treatment), (E) MG132 (10 μM, 1 h pre‐treatment).
- F
WB analysis of HA‐ORMDL3 and HA‐ORMDL3‐P137A in HUVEC lysates in the absence or presence of S1P (300 nM, 30′), DMOG (1 mM, 1 h), EER1 (10 μM, 1 h), and MG132 (10 μM, 1 h).
- G, H
(G) WB analysis of HA‐ORMDL3 and HA‐ORMDL3‐P137A, SPTLC1, and SPTLC2 in HUVEC lysates treated with CHX (10 μM) for the indicated period of time, and (H) relative quantification.
- I
WB analysis for Ubiquitin, HA, and GFP of HEK293T transfected with GFP‐ubiquitin and with the indicated HA‐ORMDL3 plasmid, and immunoprecipitated with HA antibody.
- J
SPT activity in HUVEC expressing the HA‐ORMDL3 or HA‐ORMDL3‐P137A, and depleted of endogenous ORMDLs with siRNA, in the absence or presence of S1P (300 nM, 30′) (n ≥ 4 biological replicates).
- K
Graphical abstract of the figure findings.
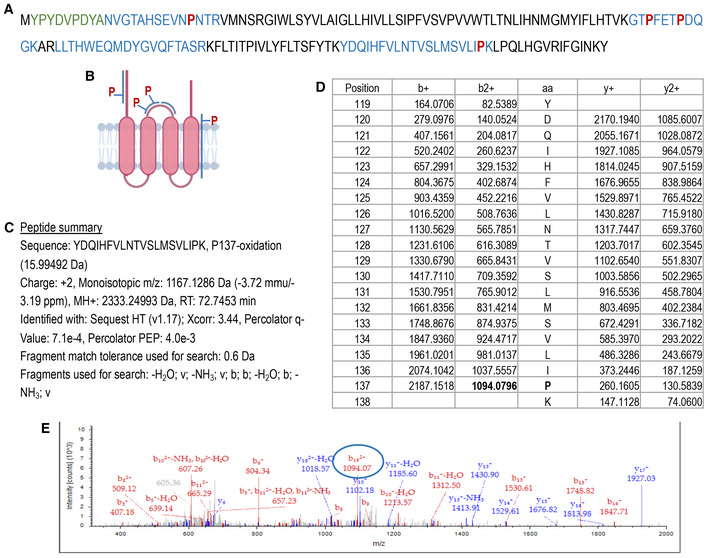
- A
HA‐ORMDL3 sequence. In green HA‐tag; in blue the peptides identified by MS; in red the prolines identified my MS.
- B
Graphical representation of the peptides identified by MS and prolines localization.
- C
Summary for the peptide containing P137.
- D
Ion masses for the amino acids in the peptide.
- E
Representative mass spectrometry showing the P137 hydroxylated.
- A, B
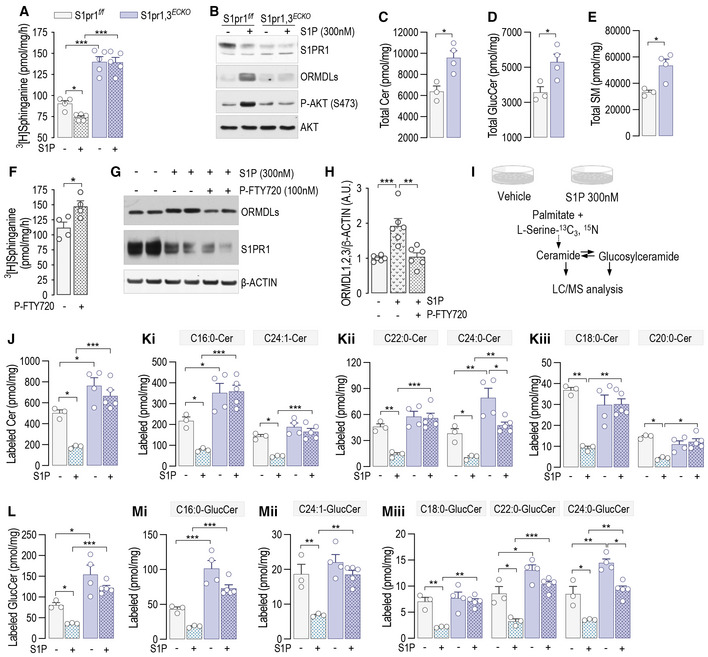
(A) SPT activity in S1pr1,3 f/f and S1pr1,2 ECKO murine endothelial cell (mEC) after 4‐OHT (1 μM, 72 h) and siS1PR3 (40 nM, 72 h) treatments, in the absence or presence of S1P (300 nM, 30′) (n ≥ 4/group from two independent EC isolations/group; four mice/EC isolation) and (B) relative WB analysis for S1PR1, ORMDLs, P‐AKT, and AKT.
- C–E
LC–MS/MS quantification of Total (C) Ceramide, (D) Glucosylceramide, and (E) Sphingomyelin in S1pr1,3 f/f and S1Pr1,3 ECKO mEC (n ≥ 3/group from two independent EC isolations/group; four mice/EC isolation).
- F–H
(F) SPT activity in HUVEC in the absence or presence of P‐FTY720 (100 nM, 30′) (n = 4 biological replicates). (G) WB analysis of ORMDLs and S1PR1 in HUVEC lysates in the absence or presence of P‐FTY720 (100 nM, 30′) and (H) relative ORMDLs quantification (n = 4 biological replicates).
- I
Experimental procedure for the measurement of the de novo synthetized Ceramides and Glucosylceramides.
- J–M
LC–MS/MS quantification of (J) total and (K) specific Ceramides, and of (L) total and (M) specific Glucosylceramides labeled with L‐Serine‐13C3, 15N in absence or presence of S1P (300 nM) (n ≥ 4/group from two independent EC isolations/group; four mice/EC isolation).
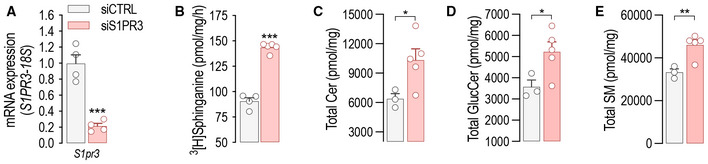
- A, B
(A) RT‐PCR for S1pr3 and (B) SPT activity in mEC after siCTRL or siS1PR3 treatment (40 nM, 72 h) (n = 4 biological replicates).
- C–E
LC–MS/MS quantification of total (C) Ceramide, (D) Glucosylceramide, and (E) Sphingomyelin in murine endothelial cell (mEC) after siCTRL or siS1PR3 treatment (40 nM, 72 h) (n = 5/group from two independent EC isolations/group; 4 mice/EC isolation).
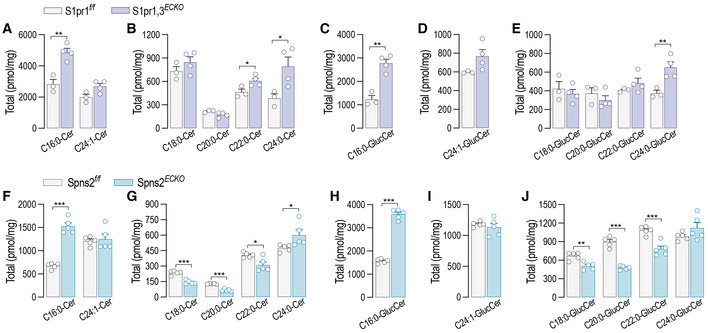
- A–E
LC–MS/MS quantification of specific (A and B) ceramides and (C–E) glucosylceramides in S1pr1,3 f/f and S1Pr1,3 ECKO murine endothelial cell (mEC) after 4‐OHT (1 μM, 72 h) and siS1PR3 (40 nM, 72 h) treatments (n = 5/group from two independent EC isolations/group; four mice/EC isolation).
- F–J
LC–MS/MS quantification of specific (F and G) ceramides and (H–J) glucosylceramides in Spns2 f/f and Spns2 ECKO mEC after 4‐OHT (1 μM, 72 h) treatment (n = 5/group from two independent EC isolations/group; four mice/EC isolation).
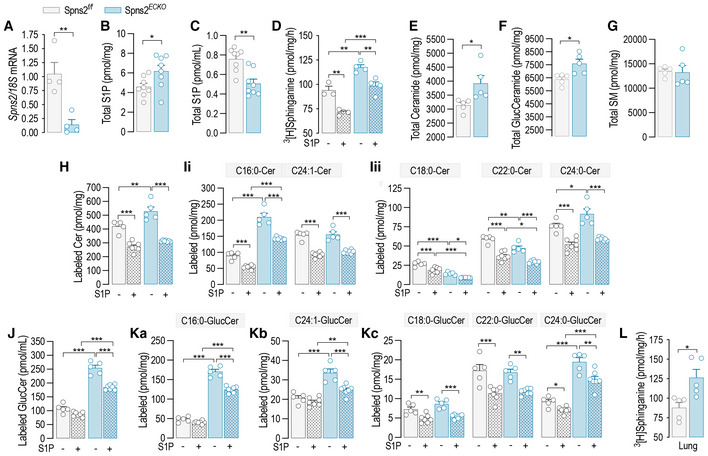
- A
RT‐PCR for Spns2 in Spns2 f/f and Spns2 ECKO murine endothelial cell (mEC) after 4‐OHT (1 μM, 72 h) treatment (n = 4 biological replicates).
- B, C
(B) Intracellular and (C) secreted S1P in Spns2 f/f and Spns2 ECKO mEC (n = 8 biological replicates).
- D
SPT activity in Spns2 f/f and Spns2 ECKO , in the absence or presence of S1P (300 nM, 30′) (n ≥ 3/group from two independent EC isolations/group; four mice/EC isolation).
- E–G
LC–MS/MS quantification of Total (E) Ceramide, (F) Glucosylceramide, and (G) sphingomyelin in Spns2 f/f and Spns2 ECKO mEC (n = 5/group from two independent EC isolations/group; four mice/EC isolation).
- H–K
LC–MS/MS quantification of (H) total and (I) specific ceramides, and of (J) total and (K) specific Glucosylceramides labeled with L‐Serine‐13C3, 15N in the absence or presence of S1P (300 nM) (n ≥ 4/group from two independent EC isolations/group; four mice/EC isolation).
- L
SPT activity in microsomes from lung of Spns2 f/f and Spns2 ECKO mice (n = 5 biological replicates).
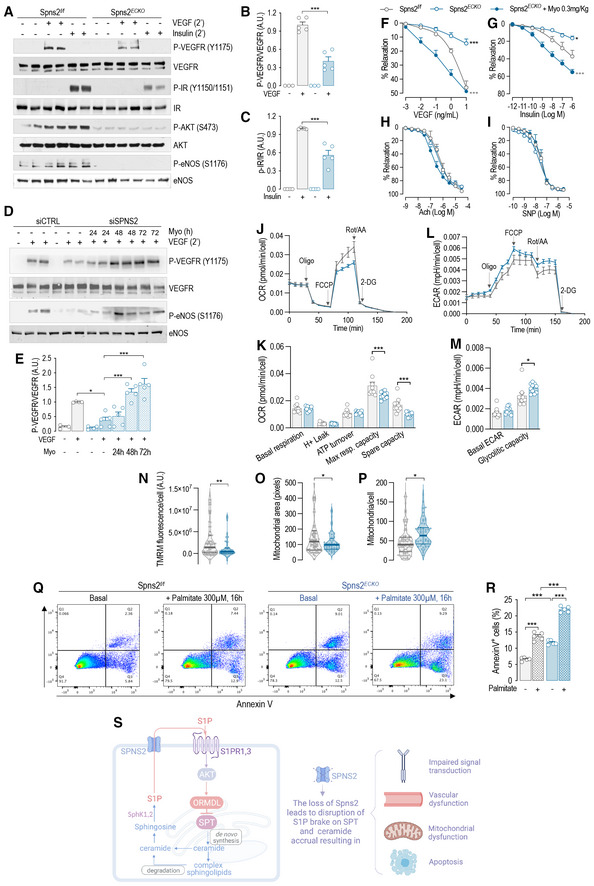
- A–C
(A) WB analysis of P‐VEGFR2 (Y1175), VEGFR2, P‐IR (Y1150/1151), IR, P‐AKT (S473), AKT, P‐eNOS (S1176), and eNOS in Spns2 f/f and Spns2 ECKO murine endothelial cell (mEC) lysates in the absence or presence of VEGF (100 ng/ml, 2′) or Insulin (1 U/ml, 2′) and (B and C) relative quantification of the indicated phospho/total protein ratios (n ≥ 3 biological replicates).
- D, E
(D) WB analysis of P‐VEGFR2 (Y1175), VEGFR2, P‐eNOS (S1176), and eNOS in Spns2 f/f and Spns2 ECKO mEC lysates in the absence or presence of VEGF (100 ng/ml, 2′), and in the absence or presence of Myriocin (300 nM) for the indicated time and (E) relative quantification of the indicated phospho/total protein ratios (n ≥ 3 biological replicates).
- F–I
Vasodilation in response to (F) VEGF, (G) Insulin, (H) acetylcholine, and (I) SNP (Spns2 f/f , n = 3; Spns2ECKO, n = 3; Spns2ECKO + Myo, n = 4 biological replicates).
- J, K
(J) Representative curves of OCR and (K) quantification of OCR metrics in Spns2 f/f and Spns2 ECKO mEC. Oligomycin (Oligo), uncoupler FCCP, rotenone, and antimycin A (Rot/AA) were added at the indicated times (n ≥ 9 biological replicates).
- L, M
(L) Representative curves of ECAR and (M) quantification of ECAR metrics in Spns2 f/f and Spns2 ECKO murine endothelial cell (mEC). Oligomycin (Oligo), uncoupler FCCP, rotenone, and antimycin A (Rot/AA) were added at the indicated times (n ≥ 9 biological replicates).
- N–P
(N) TMRM fluorescence, (O) mitochondrial area, and (P) number of mitochondria per cells, as quantified by TMRM and Hoechst fluorescence.
- Q, R
(Q) Representative dot‐plot diagrams and ® relative quantification of Spns2 f/f and Spns2 ECKO mEC, in the absence or presence of Palmitate (300 μM, 16 h), stained with Annexin V and analyzed by FACS (n ≥ 5 biological replicates).
- S
Graphical abstract of the figure findings.
Similar articles
-
The ORMDL/Orm-serine palmitoyltransferase (SPT) complex is directly regulated by ceramide: Reconstitution of SPT regulation in isolated membranes.J Biol Chem. 2019 Mar 29;294(13):5146-5156. doi: 10.1074/jbc.RA118.007291. Epub 2019 Jan 30. J Biol Chem. 2019. PMID: 30700557 Free PMC article.
-
CRISPR/Cas9 deletion of ORMDLs reveals complexity in sphingolipid metabolism.J Lipid Res. 2021;62:100082. doi: 10.1016/j.jlr.2021.100082. Epub 2021 Apr 30. J Lipid Res. 2021. PMID: 33939982 Free PMC article.
-
Orm/ORMDL proteins: Gate guardians and master regulators.Adv Biol Regul. 2018 Dec;70:3-18. doi: 10.1016/j.jbior.2018.08.002. Epub 2018 Aug 31. Adv Biol Regul. 2018. PMID: 30193828 Free PMC article. Review.
-
The individual isoforms of ORMDL, the regulatory subunit of serine palmitoyltransferase, have distinctive sensitivities to ceramide.Biochim Biophys Acta Mol Cell Biol Lipids. 2025 Oct;1870(7):159677. doi: 10.1016/j.bbalip.2025.159677. Epub 2025 Jul 29. Biochim Biophys Acta Mol Cell Biol Lipids. 2025. PMID: 40744120
-
Regulation of de novo sphingolipid biosynthesis by the ORMDL proteins and sphingosine kinase-1.Adv Biol Regul. 2015 Jan;57:42-54. doi: 10.1016/j.jbior.2014.09.002. Epub 2014 Sep 17. Adv Biol Regul. 2015. PMID: 25319495 Review.
Cited by
-
Ceramide sensing by human SPT-ORMDL complex for establishing sphingolipid homeostasis.Nat Commun. 2023 Jun 13;14(1):3475. doi: 10.1038/s41467-023-39274-y. Nat Commun. 2023. PMID: 37308477 Free PMC article.
-
Three kingdoms and one ceramide to rule them all. A comparison of the structural basis of ceramide-dependent regulation of sphingolipid biosynthesis in animals, plants, and fungi.Adv Biol Regul. 2024 Jan;91:101010. doi: 10.1016/j.jbior.2023.101010. Epub 2023 Dec 17. Adv Biol Regul. 2024. PMID: 38135565 Free PMC article.
-
Regulation of cellular and systemic sphingolipid homeostasis.Nat Rev Mol Cell Biol. 2024 Oct;25(10):802-821. doi: 10.1038/s41580-024-00742-y. Epub 2024 Jun 18. Nat Rev Mol Cell Biol. 2024. PMID: 38890457 Free PMC article. Review.
-
The Dsc ubiquitin ligase complex identifies transmembrane degrons to degrade orphaned proteins at the Golgi.Nat Commun. 2024 Oct 26;15(1):9257. doi: 10.1038/s41467-024-53676-6. Nat Commun. 2024. PMID: 39461958 Free PMC article.
-
The Implication of Sphingolipids in Viral Infections.Int J Mol Sci. 2023 Dec 9;24(24):17303. doi: 10.3390/ijms242417303. Int J Mol Sci. 2023. PMID: 38139132 Free PMC article. Review.
References
-
- Allende ML, Yamashita T, Proia RL (2003) G‐protein‐coupled receptor S1P1 acts within endothelial cells to regulate vascular maturation. Blood 102: 3665–3667 - PubMed
Publication types
MeSH terms
Substances
Grants and funding
LinkOut - more resources
Full Text Sources
Molecular Biology Databases
Miscellaneous
