. 2022 Dec 7;14(48):53511-53522.
doi: 10.1021/acsami.2c16252. Epub 2022 Nov 21.

Counterion Tuning of Near-Infrared Organic Salts Dictates Phototoxicity to Inhibit Tumor Growth

Affiliations

Counterion Tuning of Near-Infrared Organic Salts Dictates Phototoxicity to Inhibit Tumor Growth

Deanna Broadwater et al. ACS Appl Mater Interfaces. .

Abstract

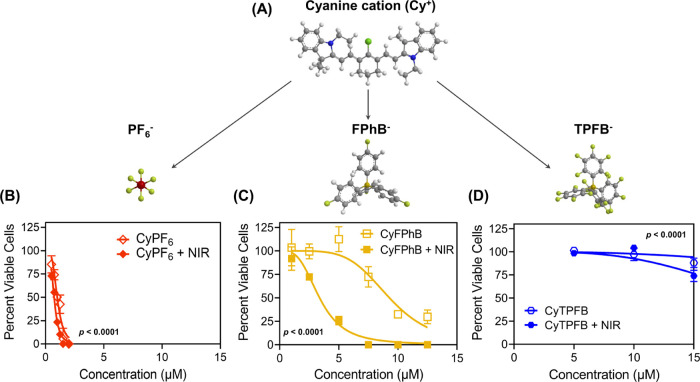
Photodynamic therapy (PDT) has the potential to improve cancer treatment by providing dual selectivity through the use of both photoactive agent and light, with the goal of minimal harmful effects from either the agent or light alone. However, current PDT is limited by insufficient photosensitizers (PSs) that can suffer from low tissue penetration, insufficient phototoxicity (toxicity with light irradiation), or undesirable cytotoxicity (toxicity without light irradiation). Recently, we reported a platform for decoupling optical and electronic properties with counterions that modulate frontier molecular orbital levels of a photoactive ion. Here, we demonstrate the utility of this platform in vivo by pairing near-infrared (NIR) photoactive heptamethine cyanine cation (Cy+), which has enhanced optical properties for deep tissue penetration, with counterions that make it cytotoxic, phototoxic, or nontoxic in a mouse model of breast cancer. We find that pairing Cy+ with weakly coordinating anion FPhB- results in a selectively phototoxic PS (CyFPhB) that stops tumor growth in vivo with minimal side effects. This work provides proof of concept that our counterion pairing platform can be used to generate improved cancer PSs that are selectively phototoxic to tumors and nontoxic to normal healthy tissues.

Keywords: heptamethine cyanine; metastatic breast cancer; near-infrared; photodynamic therapy; photosensitizer.


Conflict of interest statement

The authors declare no competing financial interest.

Figures

Figure 1
Figure 1
Fluorescent organic salts can be used as photosensitizing agents to treat breast cancer cells. Mouse mammary cancer cells (6DT1) were incubated with the indicated concentrations of organic salt pairings with or without near-infrared (NIR, 850 nm) irradiation to determine half-maximal inhibitory concentrations (IC50). (A) Photoactive heptamethine cyanine cation (Cy+) is tuned with counterions to modulate toxicity. Percent of viable cells was determined for (B) CyPF6 (CyPF6), (C) CyFPhB (CyC24H16BF4), and (D) CyTPFB (CyC24BF20). Data are displayed as means ± S.E.M., n = 3. Statistical significance (p-values) of IC50 shifts (dark IC50vs NIR IC50) are displayed in graphs.
Figure 2
Figure 2
Organic anion transporter polypeptides (Oatps) mediate the cellular uptake of CyPF6 but only partially account for CyTPFB and CyFPhB uptakes. 6DT1 cells were preincubated with 1 mM dimethyloxalylglycine (DMOG), a HIF-1α stabilizer, or 250 μM bromosulfophthalein (BSP), a competitive Oatps inhibitor. Following preincubation with Oatps modulating drugs, cells were incubated with the indicated organic salt for 25 h. Relative fluorescence units were measured for (A) 1 μM CyPF6, (B) 5 μM CyFPhB, and (C) 15 μM CyTPFB. Data are displayed as means ± S.D., n = 3. Statistically significant differences (p-value <0.05) are marked with asterisks. Curves were fit using a sigmoidal dose–response function using Origin Pro8. Sigmoidal curve fitting values are shown in Table S3.
Figure 3
Figure 3
Albumin plays a critical role in organic salt stability and uptake. (A) 6DT1 cells were incubated in serum-free media (DMEM) and complete media (DMEM + serum) for 24 h with indicated organic salts. UV–Vis spectroscopy was used to characterize 5 μM (B) CyPF6, (C) CyFPhB, and (D) CyTPFB in DMEM with increasing amounts of bovine serum albumin. Complete spectra can be found in Figure S3. 6DT1 cells were incubated with albumin in DMEM with (E) 1 μM CyPF6, (F) 5 μM CyFPhB, and (G) 15 μM CyTPFB. Data are displayed as means ± S.D., n = 3. Statistically significant differences (p-value <0.05) between initial albumin concentration and final albumin concentration are marked with asterisks.
Figure 4
Figure 4
In vivo biodistribution data show that organic salts preferentially accumulate and are retained within 6DT1 mammary tumors. Following 6DT1 mammary tumor formation, mice received a tail vein injection of 1 μmol/kg CyPF6, 3 μmol/kg CyFPhB, or 5 μmol/kg CyTPFB. (A) NIR fluorescence from the tumor-bearing fourth right mammary fat pad (tumor), liver (liver), and left fourth mammary fat pad (left mam. fat pad) was measured to determine the biodistribution of organic salts. The picture is a mouse dosed with 1 μmol/kg CyPF6 at 48 h. Fluorescence intensity was normalized to a vehicle control. Normalized fluorescence of (B) CyPF6, (C) CyFPhB, and (D) CyTPFB was measured in the tumor-bearing fourth right mammary fat pad (tumor), liver (liver), and left fourth mammary fat pad (mam fat pad). Data are displayed as means ± S.D., n = 3. Statistically significant differences (p-value <0.05) between tissue fluorescent intensity are marked with asterisks.
Figure 5
Figure 5
Counterion tuning of organic salts produces a potent photosensitizer (PS) for photodynamic therapy (PDT) in a mouse model of breast cancer. (A) Experimental overview of photodynamic therapy experimental timeline. FVB mice were injected with 10,000 6DT1 cells into the fourth right mammary fat pad. After 9 days, when a palpable tumor was present, mice were dosed with an organic salt via intravenous tail vein injection. After 2 days, the organic salt localized within the tumor and cleared from the surrounding offsite tissue. Mice were then irradiated with 150 J/cm2 of 850 nm near-infrared light (NIR) at 48 and 96 h following organic salt administration. This PDT regimen was repeated 1 week after the first organic salt injection. Tumor growth was monitored throughout the course of the experiment with manual caliper measurement for 28 days when mice are euthanized due to tumor burden. (B) Representative image of tumor-specific localization of organic salts prior to NIR light irradiation. Pictured is an FVB mouse 44 h post IV injection of 5 μmol/kg CyFPhB. Tumor volume was measured in tumor-bearing mice treated with vehicle (Veh) or (C) 5 μmol/kg CyPF6, (D) 3 μmol/kg CyFPhB, or (E) 5 μmol/kg CyTPFB with (+NIR) or without NIR irradiation. Data are displayed as means ± S.D., n = 4. Error bars represent S.D. Statistically significant differences (p-value <0.05) in CyFPhB + NIR tumor volumes from control groups at endpoint are marked with asterisks (*).
Figure 6
Figure 6
CyFPhB irradiated with NIR light induces an antitumor effect via tumor necrosis and impedes cancer progression in a breast cancer mouse model. At the end of the PDT experiment, tumor tissue was collected for further analysis of disease progression by (A) tumor weight, (B) Ki67 staining, (C) terminal deoxynucleotidyl transferase dUTP nick end labeling (TUNEL), and (D) lung histology, n = 3. Representative images of each group are shown in panel (C). Error bars represent SD. Statistically significant differences (p-value <0.05) in CyFPhB + NIR values from control groups are marked with asterisks (*).
Figure 7
Figure 7
Minimal systemic toxicity observed with CyFPhB + NIR treatment in mice. (A) Mouse weight was monitored throughout the experiment. (B) Aspartate aminotransferase (AST) and alanine aminotransferase (ALT) serum levels were measured to assess liver damage at experimental endpoint in CyFPhB + NIR treatment mice. All measurements were within normal serum levels. (C) Residual fluorescence of normal biological tissues (spleen, duodenum, kidney, liver) was measured from CyFPhB + NIR treatment mice. (D) Representative histological images from each treatment group are shown. Scale bars: 100 μm. Data are displayed as means ± SD, n = 4.

Similar articles

Cited by

References

    1. Lee C. H.; Kim K. W.; Lee S. M.; Kim S. Y. Dose-Dependent Effects of Resveratrol on Cisplatin-Induced Hearing Loss. Int. J. Mol. Sci. 2021, 22, 11310.3390/ijms22010113. - DOI - PMC - PubMed
    1. Broadwater D.; Medeiros H. C. D.; Lunt R. R.; Lunt S. Y. Current Advances in Photoactive Agents for Cancer Imaging and Therapy. Annu. Rev. Biomed. Eng. 2021, 23, 29–60. 10.1146/annurev-bioeng-122019-115833. - DOI - PubMed
    1. Dougherty T. J.; Gomer C. J.; Henderson B. W.; Jori G.; Kessel D.; Korbelik M.; Moan J.; Peng Q. Photodynamic Therapy. J. Natl. Cancer Inst. 1998, 90, 889–905. 10.1093/jnci/90.12.889. - DOI - PMC - PubMed
    1. Wang R.; Li X.; Yoon J. Organelle-Targeted Photosensitizers for Precision Photodynamic Therapy. ACS Appl. Mater. Interfaces 2021, 13, 19543–19571. 10.1021/acsami.1c02019. - DOI - PubMed
    1. Chance B. Near-Infrared Images Using Continuous, Phase-Modulated, and Pulsed Light with Quantitation of Blood and Blood Oxygenationa. Ann. N. Y. Acad. Sci. 1998, 838, 29–45. 10.1111/j.1749-6632.1998.tb08185.x. - DOI - PubMed