. 2022 Nov 11;50(20):11654-11669.
doi: 10.1093/nar/gkac1076.

Ribosomal RNA operons define a central functional compartment in the Streptomyces chromosome

Affiliations

Ribosomal RNA operons define a central functional compartment in the Streptomyces chromosome

Jean-Noël Lorenzi et al. Nucleic Acids Res. .

Abstract

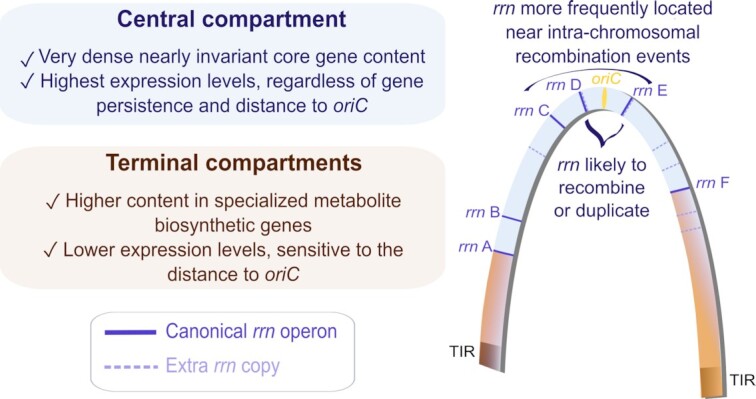
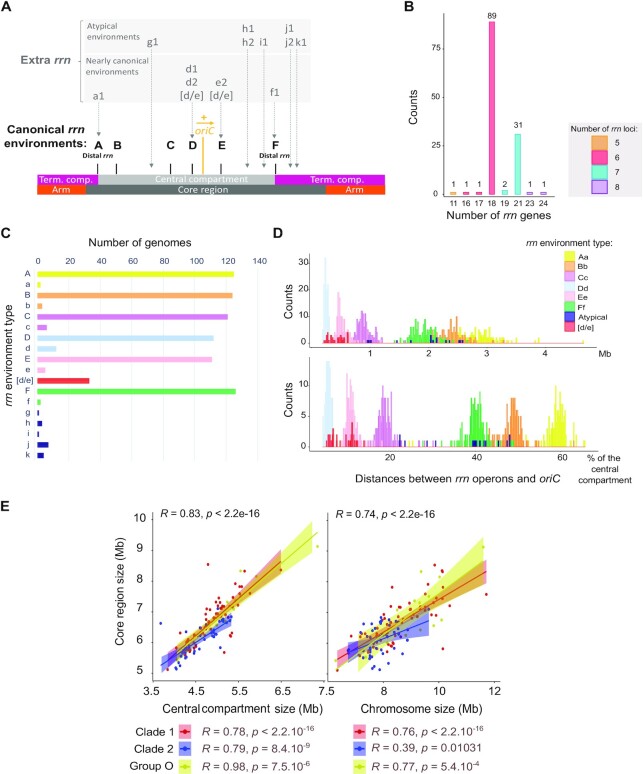
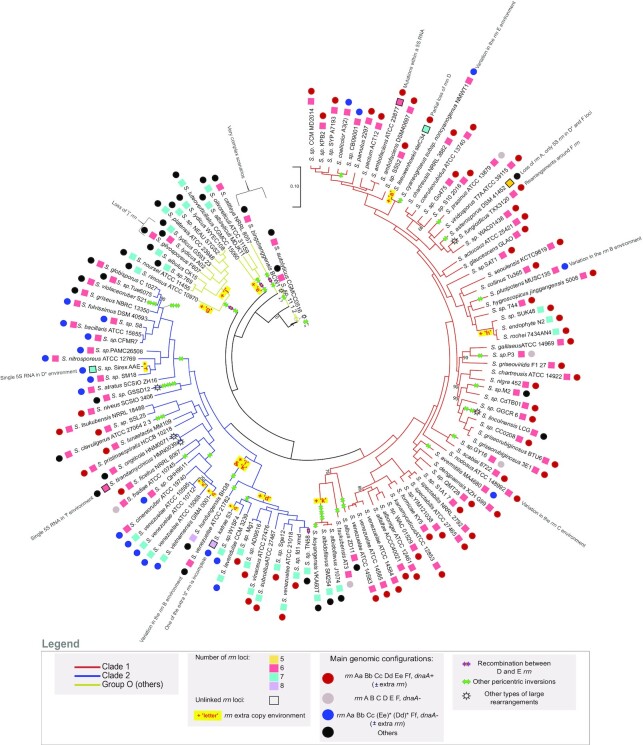
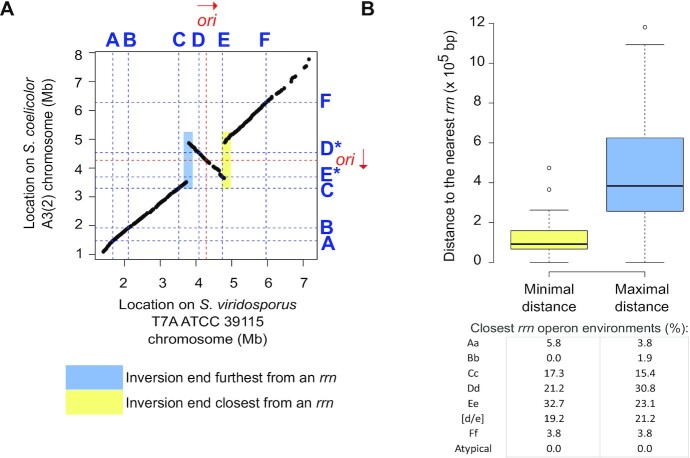
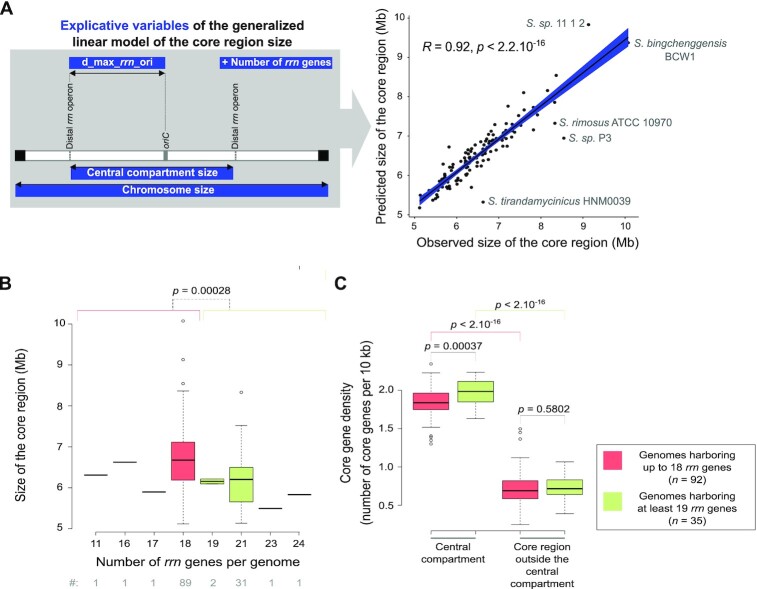
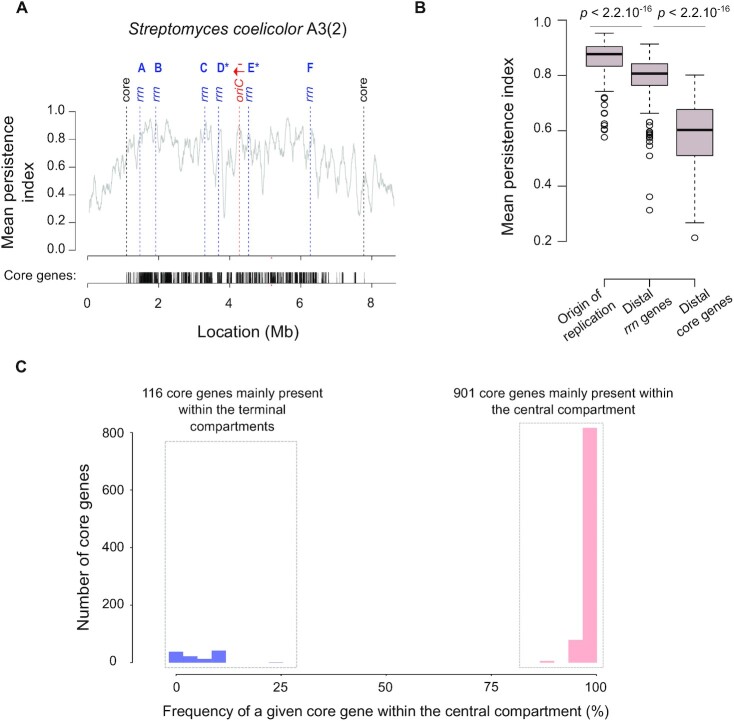
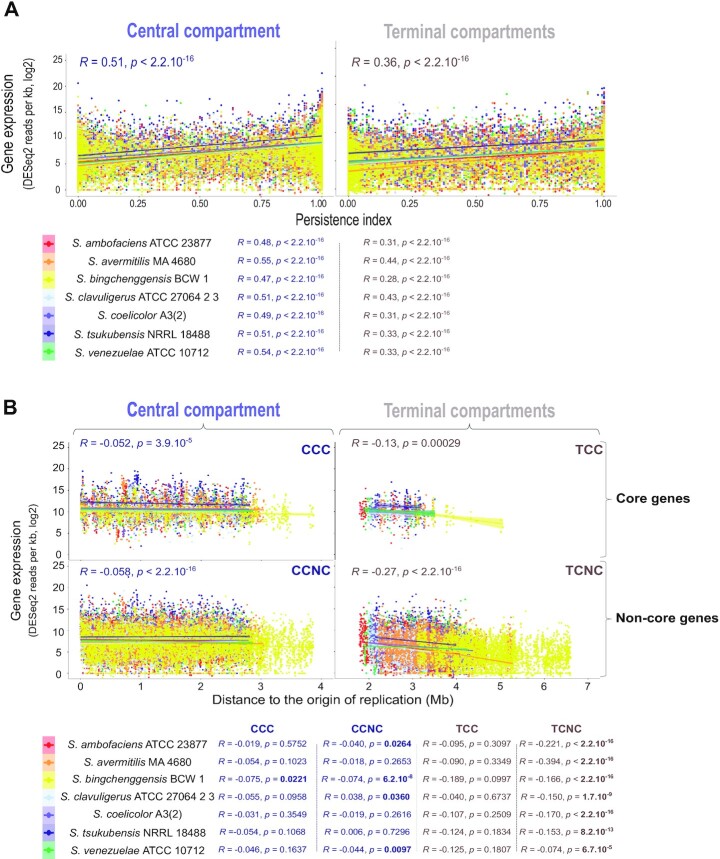
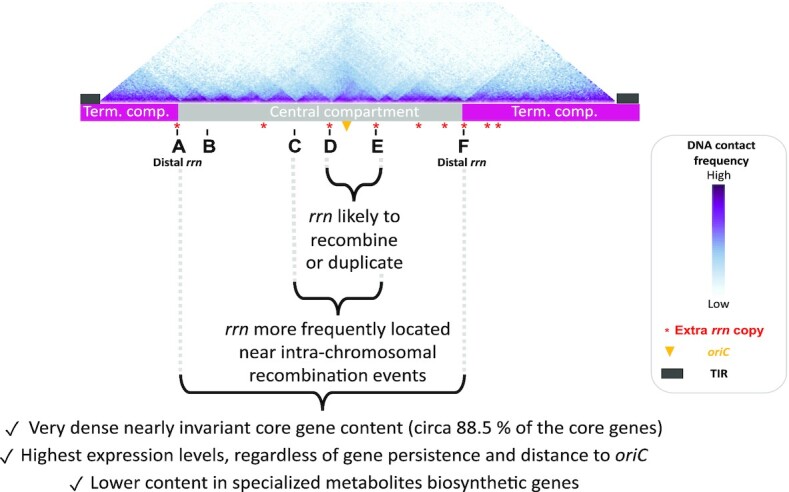
Streptomyces are prolific producers of specialized metabolites with applications in medicine and agriculture. These bacteria possess a large linear chromosome genetically compartmentalized: core genes are grouped in the central part, while terminal regions are populated by poorly conserved genes. In exponentially growing cells, chromosome conformation capture unveiled sharp boundaries formed by ribosomal RNA (rrn) operons that segment the chromosome into multiple domains. Here we further explore the link between the genetic distribution of rrn operons and Streptomyces genetic compartmentalization. A large panel of genomes of species representative of the genus diversity revealed that rrn operons and core genes form a central skeleton, the former being identifiable from their core gene environment. We implemented a new nomenclature for Streptomyces genomes and trace their rrn-based evolutionary history. Remarkably, rrn operons are close to pericentric inversions. Moreover, the central compartment delimited by rrn operons has a very dense, nearly invariant core gene content. Finally, this compartment harbors genes with the highest expression levels, regardless of gene persistence and distance to the origin of replication. Our results highlight that rrn operons are structural boundaries of a central functional compartment prone to transcription in Streptomyces.


Figures

Graphical Abstract
Graphical Abstract
Main properties of the central and terminal compartments defined by rrn operons in the Streptomyces chromosome.
Figure 1.
Figure 1.
Streptomyces rrn operon genetic distribution and link with the core genome. (A) Schematic representation of the location of rrn operons in the Streptomyces genome. The schematic representation of the chromosome is shown to scale using S. ambofaciens ATCC 23877 as reference. The origin of replication (oriC) was defined regarding the position of the dnaA gene, the yellow arrow representing the orientation of this gene. The detailed nomenclature describing each rrn environment is available in Supplementary Figure S1. Abbreviation: ‘Term. comp.’ = Terminal compartment. (B) Number of rrn genes in the panel of 127 genomes. The bars are filled according to the number of rrn loci (corresponding to complete or unlinked operons) in each genome. The values above each box correspond to the number of genomes. (C) Frequency of the different rrn core gene environments in the panel of 127 genomes. (D) Distribution of the distances between each rrn operon and the origin of replication (oriC) in the panel of 127 genomes. The distance is expressed in Mb (top) or as the percentage of the size of the ‘central compartment’ (bottom). The results are presented separately for each rrn category as defined in Supplementary Figure S1. (E) Scatter plots presenting the correlation between the core region size and the size of the central compartment or the chromosome. The rho coefficients (R) and P values of Spearman's rank correlations were calculated with the whole set of genomes (n = 127) as well as within each clade and group (nClade 1= 67, nClade 2= 43, nGroup O= 17).
Figure 2.
Figure 2.
Core genome phylogenetic tree and proposed model of Streptomyces chromosome evolution regarding rrn operons and pericentric inversions. The core genome phylogenetic tree was constructed using the 1017 core genes. The bootstrap values inferior to 95% are indicated. Branch colors represent the two clades (1 and 2) and other lineages (group ‘O’) of Streptomyces previously reported (8,57,59). The number and completeness of rrn loci as well as rrn configuration and main intra-chromosomal rearrangements are indicated for each strain as detailed in the legend panel. Some specific events are indicated next to the relevant strains/species. The most parsimonious scenario is proposed, but in some cases (indicated by a sun), complex rearrangements in the central compartment make it difficult to develop robust evolutionary scenarios. The Supplementary Figures S2 and S3 present pairwise comparisons of the core genomes that support this model. Interestingly, the pairwise comparison of the core genome order of the strains Streptomycessp. 11 1 2, S. autolyticus CGMCC0516 and S. bingchenggensis BCW 1 suggests that they probably have a common ancestor (S.sp. 11 1 2 and S. autolyticus CGMCC0516 having almost the same core gene order), which the core-based phylogenetic tree fails to resolve clearly (Supplementary Figure S3.I). The rrn configuration of each strain/species is detailed in Supplementary Table S1. The relative position of the events described (inversion, loss/acquisition of rrn, complex rearrangements) is arbitrary and does not predict the order in which the events occurred. The sign ‘x ?’ indicates that there have been several pericentric inversions, their exact number being difficult to determine due to the highly rearranged organization of the genomes.
Figure 3.
Figure 3.
Distance from rrn loci of large rearrangements occurring in the central compartment. (A) Pairwise comparison of the core genomes of S. coelicolor A3(2) and S. viridosporus T7A ATCC 39115, used as a reference for the consensus core genome order in Streptomyces. The identity of each rrn locus is specified using the nomenclature proposed in this study. The origin of replication (oriC) was defined regarding the position of the dnaA gene, the red arrow representing the orientation of this gene. The regions colored yellow and blue indicate the position of the closest and farthest ends from an rrn operon, respectively. These were subsequently used to calculate the minimum and maximum distances of the rearrangement ends to an rrn operon, with the resolution limit of the distance of these elements to the core genes. (B) Boxplot of minimal and maximal distance of the intra-chromosomal rearrangements to rrn loci. When the same event was shared by several strains, the mean values (distances of both ends to the nearest rrn loci) were calculated so that each event (n = 48) is considered only once. For each rearrangement, the closest (‘minimal’) and farthest (‘maximal’) distance of each boundary to an rrn operon was determined. The table shows the frequencies of each category of rrn found closest to these boundaries. The boxplots of both panels represent the first quartile, median and third quartile. The upper whisker extends from the hinge to the largest value no further than 1.5 × the inter-quartile range (IQR, i.e. distance between the first and third quartiles) from the hinge. The lower whisker extends from the hinge to the smallest value at most 1.5 × IQR of the hinge.
Figure 4.
Figure 4.
Interplay between rrn operons and core region dynamics. (A) Correlation between the predicted and observed core region sizes in the panel of 127 genomes of interest. The explanatory variables are represented in the left panel. The R coefficient and P value of Pearson's correlation tests were calculated with the whole set of genomes (n = 127). The names of the species are indicated for the genomes that present an unusual pattern in the diagnostic tests (Supplementary Figure S4). In fact, these genomes belong to the ‘O’ group, except for Streptomycessp. P3 genome, which has the most asymmetric organization (Supplementary Table S1). This suggests that the prediction model has limitations in the case of rather complex evolutionary scenarios or atypical genomic organizations and/or could help to identify them. (B) Boxplots presenting the size of the core region depending on the number of rrn genes. The boxplots represent the first quartile, median and third quartile. The upper whisker extends from the hinge to the largest value no further than 1.5 × the inter-quartile range (IQR, i.e. distance between the first and third quartiles) from the hinge. The lower whisker extends from the hinge to the smallest value at most 1.5 × IQR of the hinge. Outliers are represented (dots). The P values of two-sided Wilcoxon rank sum tests with continuity correction comparing the values observed in genomes harboring up to 18 rrn genes (red) in genomes harboring at least 19 rrn genes (green) are indicated. The number of genomes in each category (‘#’) is indicated below the graphs. (C) Boxplot presenting the core gene density depending on the number of rrn genes and the location inside or outside the central compartment. The boxplot represents the same parameters as in panel (B). The core gene density expressed as the number of core genes per 10 kb was calculated in the central compartment and in the core region located outside the central compartment (‘delta_core_rrn’ in the Supplementary Figure S4A). The P values of two-sided Wilcoxon rank sum tests with continuity correction are presented.
Figure 5.
Figure 5.
Gene persistence and core gene content within the central compartment. (A) Gene persistence along the chromosome of S. coelicolor A3(2). The level of persistence along the chromosome is represented using a sliding window (81 coding sequences (CDSs), with 1 CDS steps). The positions of distal core genes (‘core’) and of all rrn operons are indicated by dashed lines. The density of the core genes is indicated below the graph. The identity of each rrn operon is specified using the nomenclature as proposed in this study (Supplementary Figure S1). The origin of replication (oriC) was defined regarding the position of the dnaA gene, the red arrow representing the orientation of this gene. (B) Mean gene persistence in the regions surrounding the origin of replication, the distal rrn and core genes. The mean persistence was calculated within a window of 81 CDS centered on the genomic feature of interest. The boxplot is built as in Figure 4B. The P values of a two-sided Wilcoxon rank sum test with continuity correction comparing the mean persistence index at the vicinity of the origin of replication (n = 127), and of the distal rrn (n = 254) or core (n = 254) genes, are indicated. (C) Distribution of the core genes within and outside the central compartment.
Figure 6.
Figure 6.
Gene expression level depending on the location inside or outside the central compartment. (A) Correlation between gene expression and gene persistence in the central (left) and terminal (right) compartments. Gene transcription (in sense orientation) during the trophophase corresponds to the log 2 of the number of DESeq2 normalized reads per kb. The correlations were analyzed by a Spearman's rank correlation test, performed on the whole transcriptomes (values indicated on the graph) or for each species individually (values indicated below the graph). (B) Correlation between gene expression and the distance to the origin of replication in the central (left) and terminal (right) compartments. Core (top) and non-core (bottom) gene transcription (in sense orientation) were measured during the trophophase and expressed as the log 2 of the number of DESeq2 normalized reads per kb. The correlations were analyzed by a Spearman's rank correlation test, performed on the whole transcriptomes (values indicated on the graph) or for each species individually (values indicated below the graph). Statistically significant P-values are written in bold. Abbreviations: CCC (central compartment core genes); CCNC (central compartment non-core genes); TCC (terminal compartment core genes); TCNC (terminal compartment non-core genes).
Figure 7.
Figure 7.
Main properties of the Streptomyces chromosome in relation to rrn operons. The schematic representation of the chromosome is shown to scale using S. ambofaciens ATCC 23877 as reference. The DNA contacts along its chromosome in exponential phase have been previously reported (9). The relative positions of extra rrn copies in other Streptomyces genomes are indicated in red. Abbreviations: ‘term. comp.’ = terminal compartment; TIR = terminal inverted repeats (represented by dark grey rectangles).

Similar articles

Cited by

References

    1. Berdy J. Thoughts and facts about antibiotics: where we are now and where we are heading. J. Antibiot. (Tokyo). 2012; 65:441. - PubMed
    1. Redenbach M., Kieser H.M., Denapaite D., Eichner A., Cullum J., Kinashi H., Hopwood D.A.. A set of ordered cosmids and a detailed genetic and physical map for the 8 Mb Streptomycescoelicolor A3(2) chromosome. Mol. Microbiol. 1996; 21:77–96. - PubMed
    1. Omura S., Ikeda H., Ishikawa J., Hanamoto A., Takahashi C., Shinose M., Takahashi Y., Horikawa H., Nakazawa H., Osonoe T.et al. .. Genome sequence of an industrial microorganism Streptomycesavermitilis: deducing the ability of producing secondary metabolites. Proc. Natl. Acad. Sci. U.S.A. 2001; 98:12215–12220. - PMC - PubMed
    1. Karoonuthaisiri N., Weaver D., Huang J., Cohen S.N., Kao C.M.. Regional organization of gene expression in Streptomycescoelicolor. Gene. 2005; 353:53–66. - PubMed
    1. Ikeda H., Ishikawa J., Hanamoto A., Shinose M., Kikuchi H., Shiba T., Sakaki Y., Hattori M., Omura S.. Complete genome sequence and comparative analysis of the industrial microorganism Streptomycesavermitilis. Nat. Biotechnol. 2003; 21:526–531. - PubMed

Publication types

LinkOut - more resources