. 2022 Nov 28;50(21):12186-12201.
doi: 10.1093/nar/gkac1090.

CHD6 promotes broad nucleosome eviction for transcriptional activation in prostate cancer cells

Affiliations

CHD6 promotes broad nucleosome eviction for transcriptional activation in prostate cancer cells

Dongyu Zhao et al. Nucleic Acids Res. .

Erratum in

Abstract

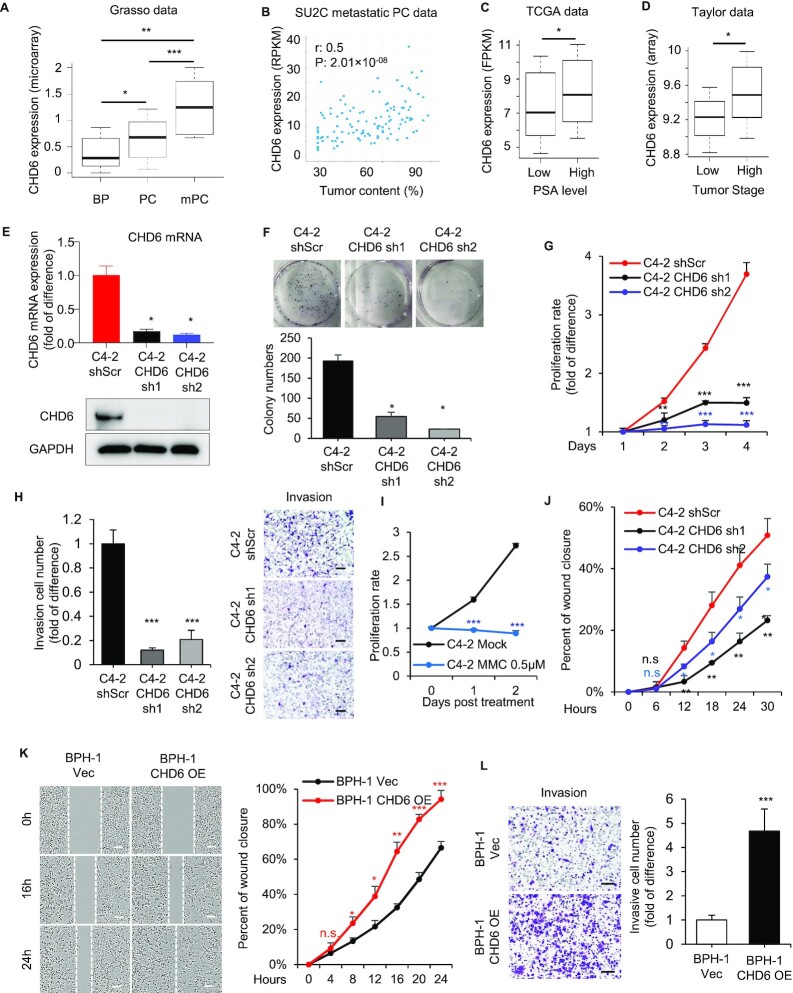
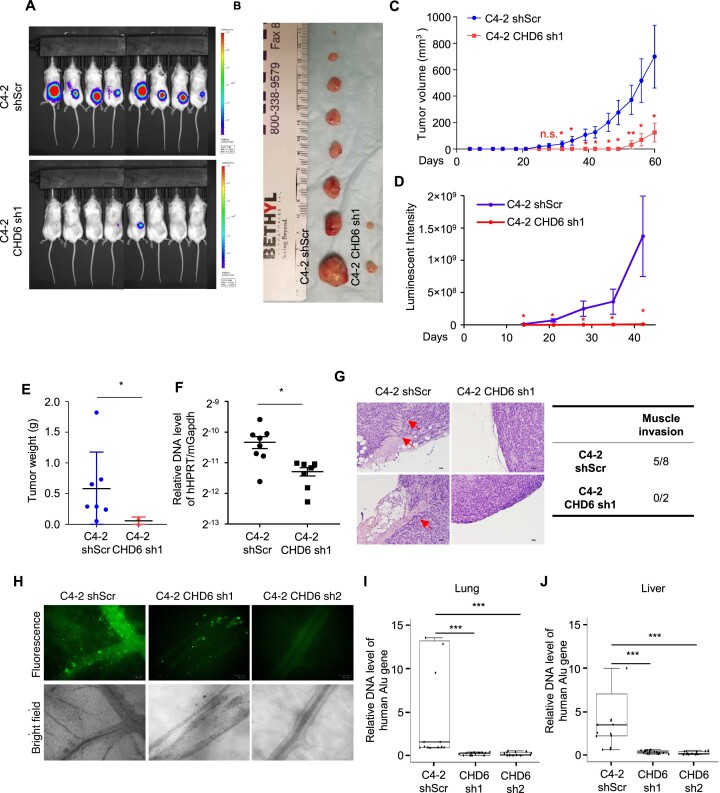
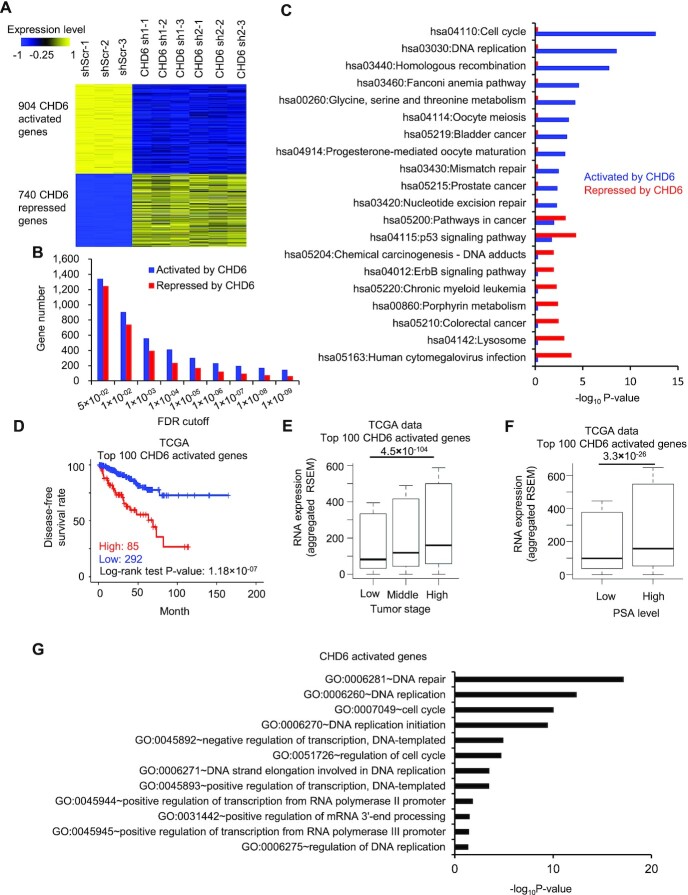
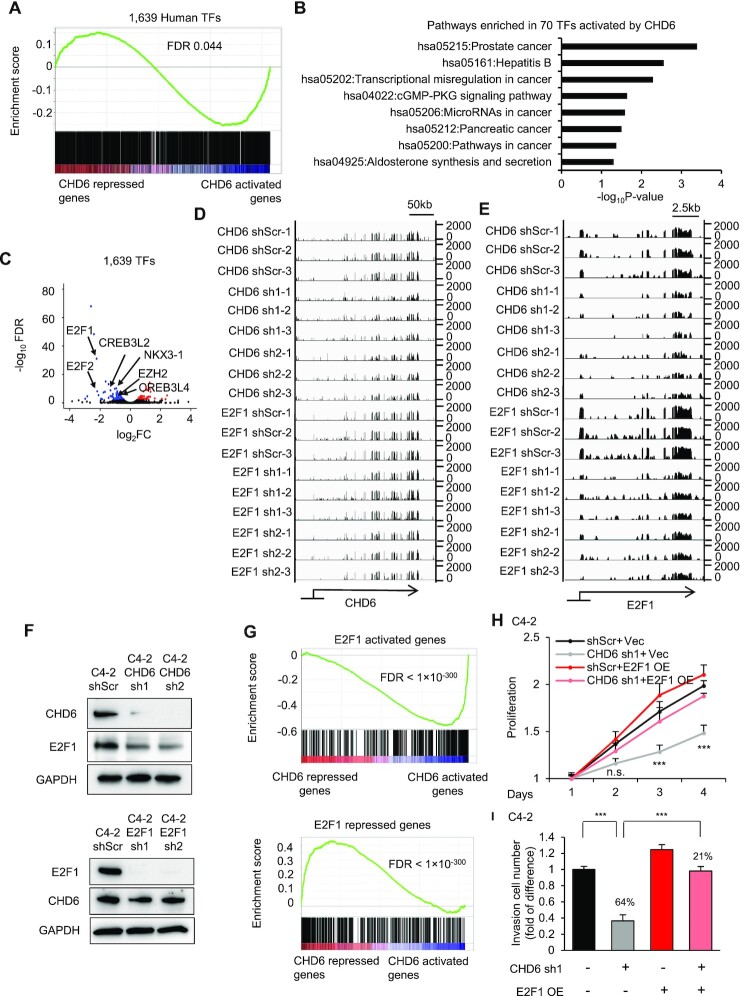
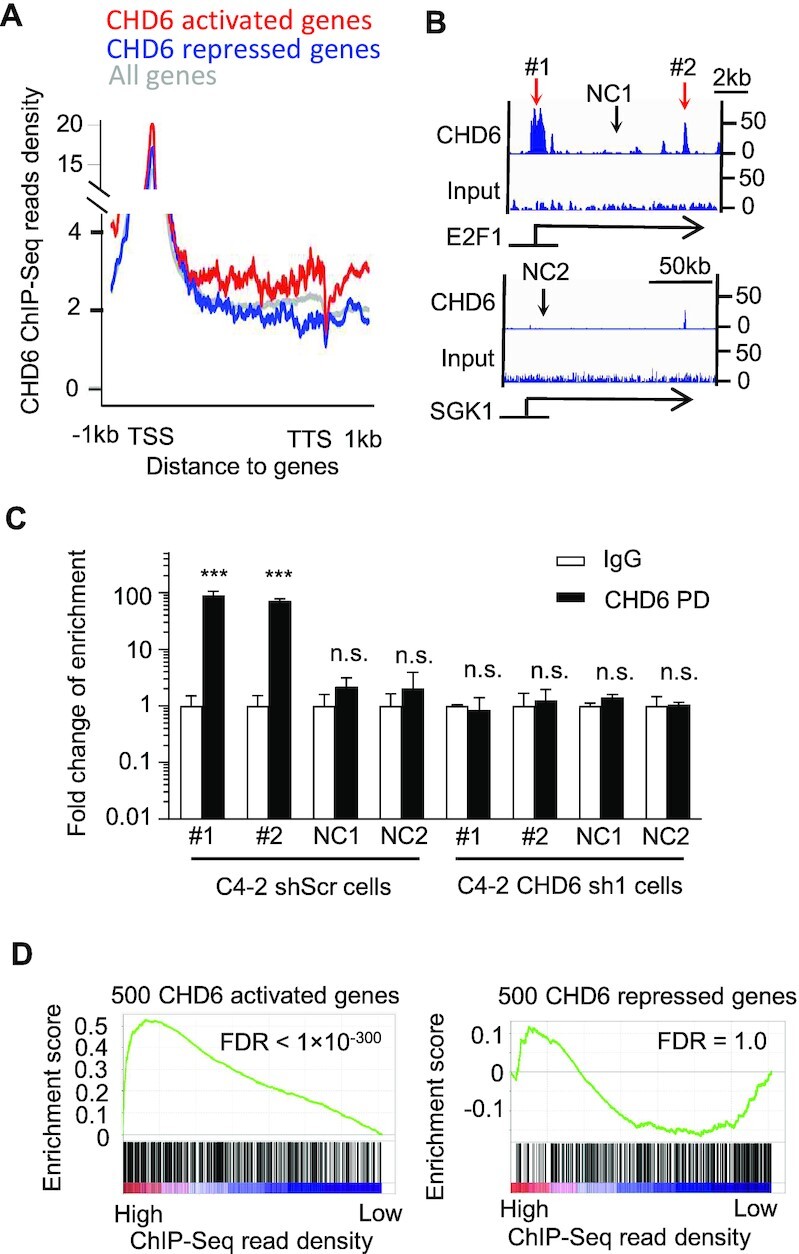
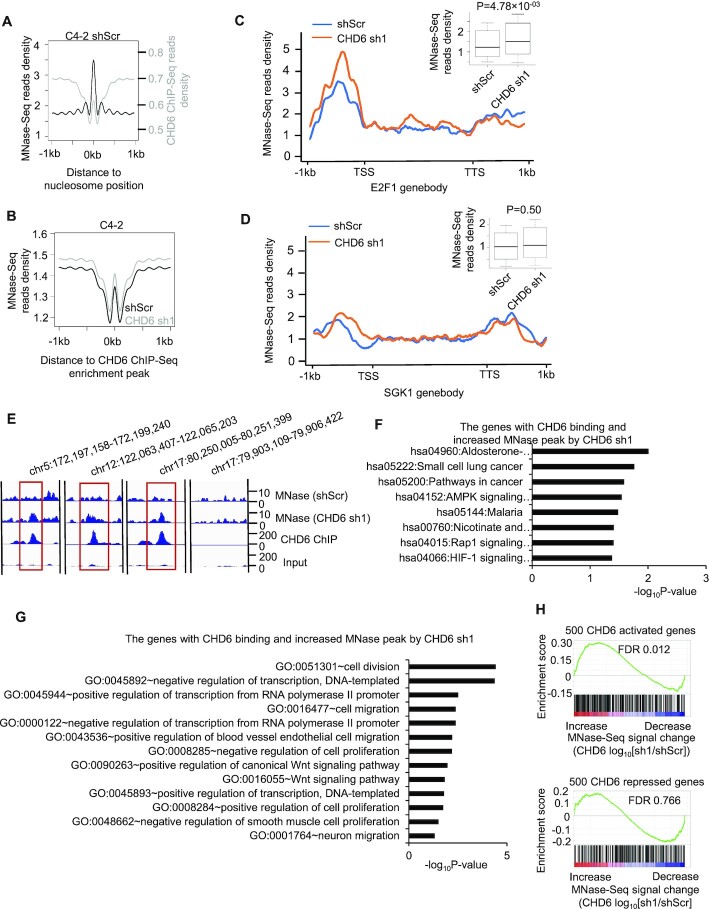
Despite being a member of the chromodomain helicase DNA-binding protein family, little is known about the exact role of CHD6 in chromatin remodeling or cancer disease. Here we show that CHD6 binds to chromatin to promote broad nucleosome eviction for transcriptional activation of many cancer pathways. By integrating multiple patient cohorts for bioinformatics analysis of over a thousand prostate cancer datasets, we found CHD6 expression elevated in prostate cancer and associated with poor prognosis. Further comprehensive experiments demonstrated that CHD6 regulates oncogenicity of prostate cancer cells and tumor development in a murine xenograft model. ChIP-Seq for CHD6, along with MNase-Seq and RNA-Seq, revealed that CHD6 binds on chromatin to evict nucleosomes from promoters and gene bodies for transcriptional activation of oncogenic pathways. These results demonstrated a key function of CHD6 in evicting nucleosomes from chromatin for transcriptional activation of prostate cancer pathways.


Figures

Figure 1.
Figure 1.
Elevation of CHD6 expression promotes prostate cancer. (A) CHD6 RNA expression level in benign prostate tissues (BP, n = 28), localized prostate cancer (PC, n = 59) and metastatic prostate cancer (mPC, n = 35) in a public dataset (GEO accession number GSE35988). (B) Scatter plot showing the relationship between CHD6 RNA expression and tumor content in SU2C metastatic prostate cancer patients, with Spearman correlation coefficient (r) and P value indicated. (C) CHD6 RNA expression level in prostate cancer patients with high and low PSA level in the TCGA data. (n(low) = 181, n(high) = 46). (D) CHD6 RNA expression level in prostate cancer patients with high and low tumor stages in the Taylor dataset. (n(low) = 86, n(high) = 55). (E) Expression level of CHD6 mRNA determined by RT-qPCR (top panel) and protein determined by Western blot (bottom panel) in C4-2 cells under individual conditions. (F, G) Colony formation (F) and proliferation (G) of C4-2 cells under individual conditions. (H) Transwell invasion of C4-2 cells under individual conditions. Proliferation (I) and wound healing assay (J) of C4-2 cells under 0.5 μM mitomycin c (MMC) treatment. Percent of wound closure at individual time points was calculated relative to the time point at 0h. (K) Wound healing assay of BPH-1 cells under individual conditions. (L) Transwell invasion of BPH-1 cells under individual conditions. OE, overexpression; Vec, empty vector; sh, shRNA; shScr, scramble control for shRNA. P values determined by one tail Wilcoxon test (A, C, D) or two-tailed student's t-test based on technical replicates (different biological samples analyzed in parallel) (E-L); n = 3 (E-L) in the t tests; *, P < 0.05; **, P < 0.01; ***, P < 0.001; n.s., not significant. Scale bar: 100 μm.
Figure 2.
Figure 2.
CHD6 ablation impairs growth and metastasis of tumors derived from prostate cancer cells in mouse xenograft model. (A, B) Tumors formed by C4-2 control and CHD6 knockdown cells. (C-E) Volume (C), luminescent intensity (D), and weight (E) of tumors derived from C4-2 control and CHD6 knockdown cells. (F) Human genomic DNA content determined by qPCR at the HPRT gene locus in lungs of mice bearing C4-2 control and CHD6 knockdown cells. (G) Hematoxylin and eosin staining of tumors derived from C4-2 cells. Red arrows, areas of muscle invasion. Quantification was shown in table. (H) Representative images of C4-2-GFP control and CHD6 knockdown cells in lower CAM membrane. Green fluorescent dots: GFP labeled C4-2 cells, black: blood vessels. (I, J) qPCR quantification of human genomic DNA content at the Alu gene locus in chicken lungs (I) and livers (J) from CAM tumor models. sh, shRNA; shScr, scramble control of shRNA; P value determined by two tails student's t test. N = 8 for mice experiments (A-C). N = 5, N = 5, and N = 6 for the control, sh2, and sh1 embryos (H-J), with three technical replicates for each embryo. *, P < 0.05; **, P < 0.01; ***, P < 0.001; n.s., not significant. Scale bar: 100 μm.
Figure 3.
Figure 3.
Expression of the genes activated by CHD6 is associated with poor outcome of prostate cancer patients. (A) Heatmap to show expression level of genes down- or up-regulated by CHD6 knockdown in C4-2 cells. (B) Number of genes activated or repressed by CHD6 when defined with individual FDR cutoffs in C4-2 cells. (C) KEGG pathway analysis of genes activated or repressed by CHD6 in C4-2 cells. (D) Kaplan-Meier plot of disease-free survival rate in prostate cancer patients with high or low RNA expression of CHD6 activation signature genes in the TCGA data. (E) RNA expression level of CHD6 activation signature genes at different tumor stages in the TCGA data. (n(low) = 186, n(middle) = 293, n(high) = 10). (F) RNA expression level of CHD6 activation signature genes in patients with low and high PSA level in the TCGA data. (n(low) = 181, n(high) = 46). (G) Gene ontology analysis of genes activated by CHD6. P values determined by one tail Wilcoxon test (E, F). sh, shRNA; shScr, scramble control of shRNA. *, P < 0.05; **, P < 0.01; ***, P < 0.001; n.s., not significant. The results were generated based on integration of three independent biological replicates.
Figure 4.
Figure 4.
Many oncogenic transcription factors are downstream targets of CHD6. (A) GSEA analysis showing enrichment of 1,639 transcription factors in genes regulated by CHD6 in C4-2 cells. (B) KEGG pathway analysis of 70 transcription factors activated by CHD6 in C4-2 cells. (C) Volcano plot to show expression change of transcription factors upon knockdown of CHD6 in C4-2 cells. (D, E) Genome browser track to show RNA-Seq data at the CHD6 (D) and E2F1 (E) loci in individual samples. (F) Protein levels of CHD6 and E2F1 in C4-2 cells under individual conditions. (G) GSEA analysis showing enrichment of the E2F1-activated and -repressed genes in genes regulated by CHD6 in C4-2 cells. (H) Proliferation of C4-2 cells under individual conditions. (I) Transwell invasion assay of C4-2 cells under individual conditions. TF, transcription factor; sh, shRNA; shScr, scramble control of shRNA. Two tails student's t test P value were shown (H and I); n = 3 technical replicates (different samples analyzed in parallel); *, P < 0.05; **, P < 0.01; ***, P < 0.001; n.s., not significant.
Figure 5.
Figure 5.
Binding of CHD6 protein on chromatin is linked to transcriptional activation of the target genes in C4-2 cells. (A) CHD6 ChIP-Seq read density on gene body and flanking regions of individual gene groups in C4-2 cells. (B) Genome browser tracks showing CHD6 ChIP-Seq read density at example genes in C4-2 cells. (C) ChIP-qPCR to verify CHD6 ChIP-Seq enrichment sites in C4-2 control and CHD6 knockdown cells. (D) GSEA analysis to show enrichment of CHD6-activated or -repressed genes as a function of CHD6 ChIP-Seq read density on gene body. NC, negative control. P value determined by two tails student's t-test (C) and KS test (D); n = 3 (C); *, P < 0.05; **, P < 0.01; ***, P < 0.001; n.s., not significant. The results were generated based on integration of three independent biological replicates.
Figure 6.
Figure 6.
Binding of CHD6 protein on chromatin is linked to nucleosome eviction at active genes in C4-2 cells. (A) Average MNase-seq and CHD6 ChIP-Seq read density plotted around MNase-Seq enrichment peaks in C4-2 control cells. (B) Average MNase-Seq read density in C4-2 control cells and CHD6 knockdown cells around CHD6 ChIP-Seq enrichment peaks defined in control cells. (C, D) MNase-seq read density plotted around E2F1 gene body (C) and SGK1 gene body (D) in C4-2 control cells and CHD6 knockdown cells. A boxplot was added to the top right corner to further show difference in MNase-Seq Read density. (E) Genome browser tracks to show MNase-Seq, CHD6 ChIP-seq and input read density in individual genomic regions. (F, G) KEGG (F) and GO (G) pathway analysis of the genes with binding of CHD6 and increased MNase peak upon CHD6 knockdown. (H) GSEA analysis to show the enrichment of CHD6-activated genes (upper panel) or CHD6-repressed genes (lower panel) in genes that display an increase or decrease of MNase-Seq signal. MNase-Seq analyses were based on integration of three independent biological replicates, in which the chromatins were digested with MNase for 15 minutes (MNase-Seq analysis based on 60 minutes digestion is in Supplementary Figure S5). P value was determined by one tail KS test (D, F).

Similar articles

Cited by

References

    1. Shen H., Laird P.W.. Interplay between the cancer genome and epigenome. Cell. 2013; 153:38–55. - PMC - PubMed
    1. Houlahan K.E., Shiah Y.J., Gusev A., Yuan J., Ahmed M., Shetty A., Ramanand S.G., Yao C.Q., Bell C., O’Connor E.et al. .. Genome-wide germline correlates of the epigenetic landscape of prostate cancer. Nat. Med. 2019; 25:1615–1626. - PMC - PubMed
    1. Ramanand S.G., Chen Y., Yuan J., Daescu K., Lambros M.B., Houlahan K.E., Carreira S., Yuan W., Baek G., Sharp A.et al. .. The landscape of RNA polymerase II-associated chromatin interactions in prostate cancer. J. Clin. Invest. 2020; 130:3987–4005. - PMC - PubMed
    1. Natesan R., Aras S., Effron S.S., Asangani I.A.. Epigenetic regulation of chromatin in prostate cancer. Adv. Exp. Med. Biol. 2019; 1210:379–407. - PubMed
    1. Feinberg A.P., Koldobskiy M.A., Gondor A.. Epigenetic modulators, modifiers and mediators in cancer aetiology and progression. Nat. Rev. Genet. 2016; 17:284–299. - PMC - PubMed

Publication types