. 2022 Dec 15;12(1):e220307.
doi: 10.1530/EC-22-0307. Print 2023 Jan 1.

Long-term effects of prenatal undernutrition on female rat hypothalamic KNDy neurons

Affiliations

Long-term effects of prenatal undernutrition on female rat hypothalamic KNDy neurons

Shiori Minabe et al. Endocr Connect. .

Abstract

The nutritional environment during development periods induces metabolic programming, leading to metabolic disorders and detrimental influences on human reproductive health. This study aimed to determine the long-term adverse effect of intrauterine malnutrition on the reproductive center kisspeptin-neurokinin B-dynorphin A (KNDy) neurons in the hypothalamic arcuate nucleus (ARC) of female offspring. Twelve pregnant rats were divided into ad-lib-fed (control, n = 6) and 50% undernutrition (UN, n = 6) groups. The UN group was restricted to 50% daily food intake of the control dams from gestation day 9 until term delivery. Differences between the two groups in terms of various maternal parameters, including body weight (BW), pregnancy duration, and litter size, as well as birth weight, puberty onset, estrous cyclicity, pulsatile luteinizing hormone (LH) secretion, and hypothalamic gene expression of offspring, were determined. Female offspring of UN dams exhibited low BW from birth to 3 weeks, whereas UN offspring showed signs of precocious puberty; hypothalamic Tac3 (a neurokinin B gene) expression was increased in prepubertal UN offspring, and the BW at the virginal opening was lower in UN offspring than that in the control group. Interestingly, the UN offspring showed significant decreases in the number of KNDy gene-expressing cells after 29 weeks of age, but the number of ARC kisspeptin-immunoreactive cells, pulsatile LH secretions, and estrous cyclicity were comparable between the groups. In conclusion, intrauterine undernutrition induced various changes in KNDy gene expression depending on the life stage. Thus, intrauterine undernutrition affected hypothalamic developmental programming in female rats.

Keywords: fetal programing; kisspeptin; low birth weight; prenatal undernutrition.


Conflict of interest statement

The authors declare no conflict of interest.

Figures

Figure 1
Figure 1
Study schema. Dams were fed either standard chow ad libitum (Ctr) or 50% of the daily intake (UN) from gestational day 9 to delivery. All dams were fed ad libitum throughout lactation. At weaning (postnatal day 21), part of the Ctr and UN offspring was sacrificed for hypothalamic KNDy gene expression, and the other rats were placed on a normal diet fed ad libitum until the animals were sacrificed.
Figure 2
Figure 2
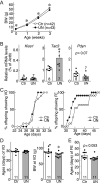
Effect of intrauterine undernutrition on puberty onset of female rats. (A) Changes in body weight (BW) in female offspring of Ctr or UN dams before weaning. Values are mean ± s.e.m. *P < 0.05 (vs Ctr group, two-way). (B) Hypothalamic KNDy gene (Kiss1, Tac3, and Pdyn) expression in Ctr and UN offspring at weaning. The mRNA levels were determined by qPCR. Relative expression levels of each gene were normalized by β-actin gene (Actb) expression. (C) Percentage of animals showing vaginal opening (VO) or first estrus (FE). (D) Ages (left) and BW (right) at VO. (E) Ages at virginal FE. *P < 0.05 (vs. Ctr group, Student’s t-test). The bar charts portray the mean ± s.e.m. with the individual data points overlaid. The numbers in each column indicate the number of animals used. Ctr, offspring of ad-libitum-fed control dams; UN, offspring of undernourished dams.
Figure 3
Figure 3
Effect of intrauterine undernutrition on metabolic parameters of female rats. (A) Changes in BW in female offspring of Ctr or UN dams after weaning. Values are mean ± s.e.m. (B) Plasma triglyceride (TG) levels (left), weight of visceral adiposity divided by the BW (middle), and calorie intake (right) in each group. *P < 0.05 (vs Ctr group, Student’s t-test). The bar charts portray the mean ± s.e.m. with the individual data points overlaid. The numbers in each column indicate the number of animals used. Ctr, offspring of ad-libitum fed control dams; UN, offspring of undernourished dams.
Figure 4
Figure 4
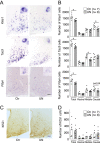
Effect of intrauterine undernutrition on ARC KNDy gene expression in mature female offspring. (A) Representative photomicrographs show Kiss1, Tac3, and Pdyn mRNA distribution using an antisense cRNA probe in the ARC. Scale bar, 100 μm. (B) The number of total Kiss1-, Tac3-, and Pdyn-expressing cells in the whole ARC, or the subtotal number in the rostral, middle, and caudal regions of the ARC. *P < 0.05 (vs the normal-diet controls, Student’s t-test). (C) Representative photomicrographs show KISS1-immunoreactive cells in the ARC. Scale bar, 100 μm. (D) The number of total kisspeptin-immunoreactive cells in the whole ARC, or the subtotal number in the rostral, middle, and caudal regions of the ARC. The bar charts portray the mean ± s.e.m. with the individual data points overlaid. Ctr, offspring of ad-libitum-fed control dams; UN, offspring of undernourished dams. All animals were OVX and received estradiol a week before the PFA perfusion.
Figure 5
Figure 5
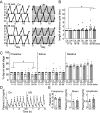
Effect of intrauterine undernutrition on reproductive functions in mature female offspring. (A) Estrous cyclicity in the representative rats in each group at 11–13 and 26–28 weeks of age. Note that the vaginal smears were examined daily for 2 weeks. E, estrus; P, proestrus; D, diestrus. (B) The average length of the estrous cycle in each group (Ctr, n  = 10; UN, n  = 10) at 11–13, 16–18, 21–23, and 26–28 weeks. (C) The percentages of proestrus, estrus, and diestrus during 2 weeks in each group (Ctr, n  = 10; UN, n  = 10) at 11–13, 16–18, 21–23, and 26–28 weeks. (D) Plasma LH profiles in the representative animals from each group. All animals were OVX and received estradiol. After 1 week, blood samples were collected every 6 min for 3 h. Arrowheads indicate the peaks of the LH pulses as identified using the PULSAR computer program. (E) Frequency of the LH pulses, mean LH concentration, and amplitude of the LH pulses were calculated for a 3 h sampling period. *P < 0.05 (vs 11–13 weeks, two-way ANOVA followed by the Bonferroni test). The bar charts portray the mean ± s.e.m. with the individual data points overlaid. The numbers in each column indicate the number of animals used. Ctr, offspring of ad-libitum-fed control dams; UN, offspring of undernourished dams.

Similar articles

Cited by

References

    1. Zambrano E, Guzman C, Rodriguez-Gonzalez GL, Durand-Carbajal M, Nathanielsz PW. Fetal programming of sexual dev1elopment and reproductive function. Molecular and Cellular Endocrinology 2014382538–549. (10.1016/j.mce.2013.09.008) - DOI - PubMed
    1. Barker DJP.In utero programming of cardiovascular disease. Theriogenology 200053555–574. (10.1016/S0093-691X(99)00258-7) - DOI - PubMed
    1. Luyckx VA, Bertram JF, Brenner BM, Fall C, Hoy WE, Ozanne SE, Vikse BE. Effect of fetal and child health on kidney development and long-term risk of hypertension and kidney disease. Lancet 2013382273–283. (10.1016/S0140-6736(13)60311-6) - DOI - PubMed
    1. Rinaudo P, Wang E. Fetal programming and metabolic syndrome. Annual Review of Physiology 201274107–130. (10.1146/annurev-physiol-020911-153245) - DOI - PMC - PubMed
    1. Duque-Guimaraes DE, Ozanne SE. Nutritional programming of insulin resistance: causes and consequences. Trends in Endocrinology and Metabolism 201324525–535. (10.1016/j.tem.2013.05.006) - DOI - PubMed

LinkOut - more resources