

Phenotypic and Genomic Comparison of Staphylococcus aureus Highlight Virulence and Host Adaptation Favoring the Success of Epidemic Clones
- PMID: 36409083
- PMCID: PMC9765012
- DOI: 10.1128/msystems.00831-22
Phenotypic and Genomic Comparison of Staphylococcus aureus Highlight Virulence and Host Adaptation Favoring the Success of Epidemic Clones
Abstract
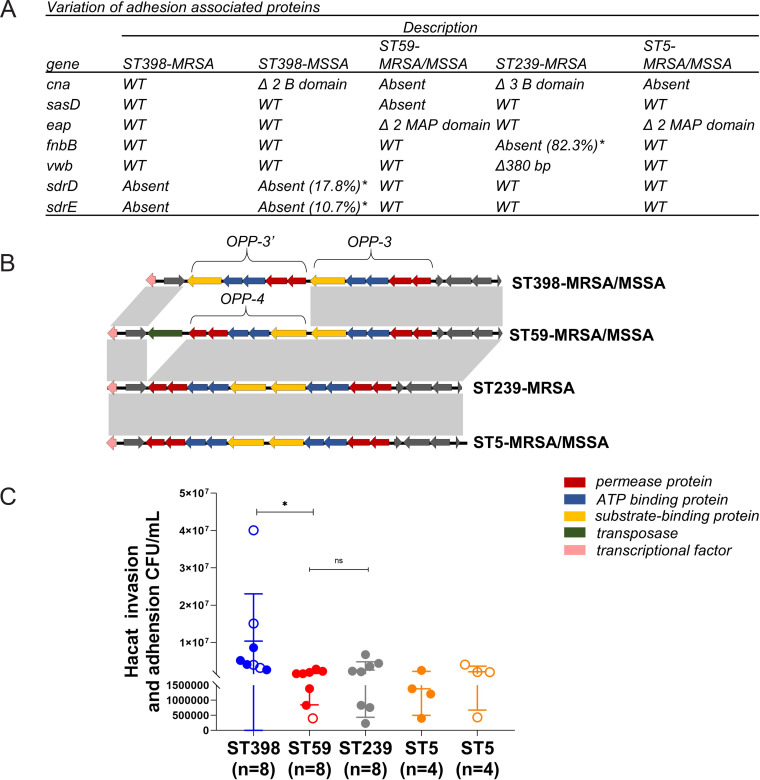
Methicillin-resistant Staphylococcus aureus (MRSA) of the sequence type 59 (ST59) and ST398 lineages has emerged in hospitals and displayed a higher virulent potential than its counterparts ST5 and ST239. However, the mechanism of the host cell-pathogen interaction and specific determinates that contribute to the success of epidemic clones remain incompletely understood. In the present study, 142 S. aureus strains (ST59, ST398, ST239, and ST5) were selected from our 7-year national surveillance of S. aureus bloodstream infections (n = 983). We revealed that ST59 and ST398 had a higher prevalence of the protease-associated genes hysAVSaβ, paiB, and cfim and enhanced proteolytic activity than the other lineages. ST59 and ST398 showed a higher expression of RNAIII and psmα and greater proficiency at causing cell lysis than other lineages. Furthermore, ST59 and ST398 were strongly recognized by human neutrophils and caused more cell apoptosis and neutrophil extracellular trap degradation than the other lineages. In addition, these strains differed substantially in their repertoire and composition of intact adhesion genes. Moreover, ST398 displayed higher adaptability to human epidermal keratinocytes and a unique genetic arrangement inside the oligopeptide ABC transport system, indicating functional variations. Overall, our study revealed some potential genomic traits associated with virulence and fitness that might account for the success of epidemic clones. IMPORTANCE Considerable efforts have been exerted to identify factors contributing to the success of epidemic Staphylococcus aureus clones, however, comparative phenotypic studies lack representation owing to the small number of strains. Large-scale strain collections focused on the description of genomic characteristics. Moreover, methicillin-resistant S. aureus infections constitute 30% to 40% of S. aureus bloodstream infections, and recent research has elucidated highly virulent methicillin-susceptible S. aureus strains. However, comprehensive research on the factors contributing to the success of epidemic S. aureus clones is lacking. In this study, 142 S. aureus strains were selected from our 7-year national surveillance of S. aureus bloodstream infections (n = 983) accompanied by a rigorous strain selection process. A combination of host cell-pathogen interactions and genomic analyses was applied to the represented strains. We revealed some potential genomic traits associated with virulence and fitness that might account for the success of epidemic clones.
Keywords: Staphylococcus aureus; adhesion and invasion; lineage replacement; neutrophil; virulence determinants.
Conflict of interest statement
The authors declare no conflict of interest.
Figures


Similar articles
-
Drivers of methicillin-resistant Staphylococcus aureus (MRSA) lineage replacement in China.Genome Med. 2021 Oct 28;13(1):171. doi: 10.1186/s13073-021-00992-x. Genome Med. 2021. PMID: 34711267 Free PMC article.
-
Genomic Epidemiology and Characterization of Methicillin-Resistant Staphylococcus aureus from Bloodstream Infections in China.mSystems. 2021 Dec 21;6(6):e0083721. doi: 10.1128/mSystems.00837-21. Epub 2021 Nov 2. mSystems. 2021. PMID: 34726482 Free PMC article.
-
Identification of a highly transmissible animal-independent Staphylococcus aureus ST398 clone with distinct genomic and cell adhesion properties.mBio. 2012 Feb 28;3(2):e00027-12. doi: 10.1128/mBio.00027-12. Print 2012. mBio. 2012. PMID: 22375071 Free PMC article.
-
Insights into the epidemiology of community-associated methicillin-resistant Staphylococcus aureus in special populations and at the community-healthcare interface.Braz J Infect Dis. 2021 Nov-Dec;25(6):101636. doi: 10.1016/j.bjid.2021.101636. Epub 2021 Oct 19. Braz J Infect Dis. 2021. PMID: 34672988 Free PMC article. Review.
-
Virulence strategies of the dominant USA300 lineage of community-associated methicillin-resistant Staphylococcus aureus (CA-MRSA).FEMS Immunol Med Microbiol. 2012 Jun;65(1):5-22. doi: 10.1111/j.1574-695X.2012.00937.x. Epub 2012 Mar 5. FEMS Immunol Med Microbiol. 2012. PMID: 22309135 Free PMC article. Review.
Cited by
-
Staphylococci in Livestock: Molecular Epidemiology, Antimicrobial Resistance, and Translational Strategies for One Health Protection.Vet Sci. 2025 Aug 13;12(8):757. doi: 10.3390/vetsci12080757. Vet Sci. 2025. PMID: 40872707 Free PMC article. Review.
-
Global genetic diversity and Asian clades evolution: a phylogeographic study of Staphylococcus aureus sequence type 5.Antimicrob Agents Chemother. 2024 Mar 6;68(3):e0117523. doi: 10.1128/aac.01175-23. Epub 2024 Jan 23. Antimicrob Agents Chemother. 2024. PMID: 38259089 Free PMC article.
-
Longitudinal surveillance of the molecular evolution of methicillin-resistant Staphylococcus aureus isolates from pediatric patients in Shanghai, China, from 2013 to 2022.mSystems. 2025 May 20;10(5):e0037125. doi: 10.1128/msystems.00371-25. Epub 2025 Apr 30. mSystems. 2025. PMID: 40304507 Free PMC article.
-
Molecular epidemiology, antimicrobial resistance, and virulence characteristics of predominant methicillin-resistant Staphylococcus aureus clones with strong biofilm-producing capability from a tertiary teaching hospital in China.BMC Microbiol. 2025 Aug 15;25(1):510. doi: 10.1186/s12866-025-04258-z. BMC Microbiol. 2025. PMID: 40817043 Free PMC article.
-
Genomic Diversity of Methicillin-Resistant Staphylococcus aureus CC398 Isolates Collected from Diseased Swine in the German National Resistance Monitoring Program GERM-Vet from 2007 to 2019.Microbiol Spectr. 2023 Jun 15;11(3):e0077023. doi: 10.1128/spectrum.00770-23. Epub 2023 May 8. Microbiol Spectr. 2023. PMID: 37154741 Free PMC article.
References
-
- Klevens RM, Morrison MA, Fridkin SK, Reingold A, Petit S, Gershman K, Ray S, Harrison LH, Lynfield R, Dumyati G, Townes JM, Craig AS, Fosheim G, McDougal LK, Tenover FC, Active Bacterial Core Surveillance of the Emerging Infections Program Network . 2006. Community-associated methicillin-resistant Staphylococcus aureus and healthcare risk factors. Emerging Infectious Diseases 12:1991–1993. doi:10.3201/eid1212.060505. - DOI - PMC - PubMed
Publication types
MeSH terms
LinkOut - more resources
Full Text Sources
Medical
