. 2022 Dec 21;10(6):e0223422.
doi: 10.1128/spectrum.02234-22. Epub 2022 Nov 21.

Plasmodium falciparum Sexual Commitment Rate Variation among Clinical Isolates and Diverse Laboratory-Adapted Lines

Affiliations

Plasmodium falciparum Sexual Commitment Rate Variation among Clinical Isolates and Diverse Laboratory-Adapted Lines

Lindsay B Stewart et al. Microbiol Spectr. .

Abstract

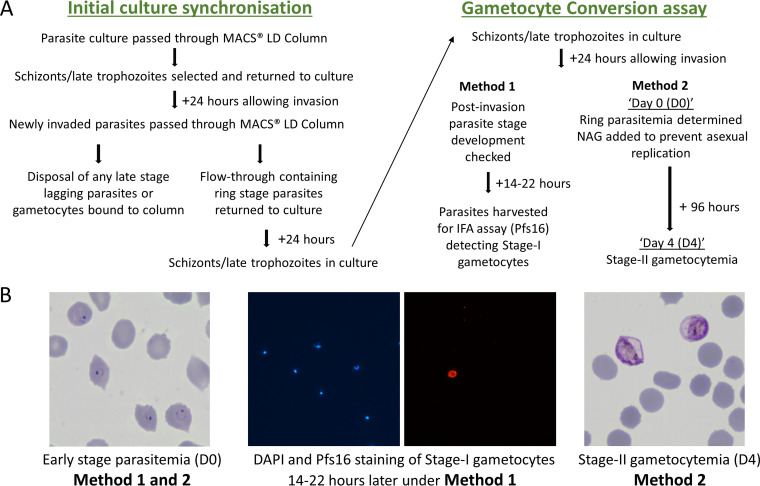
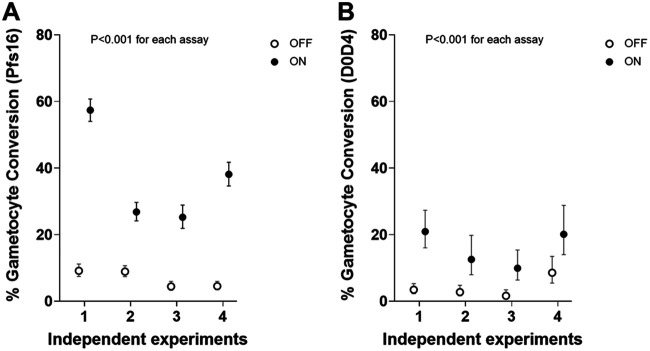
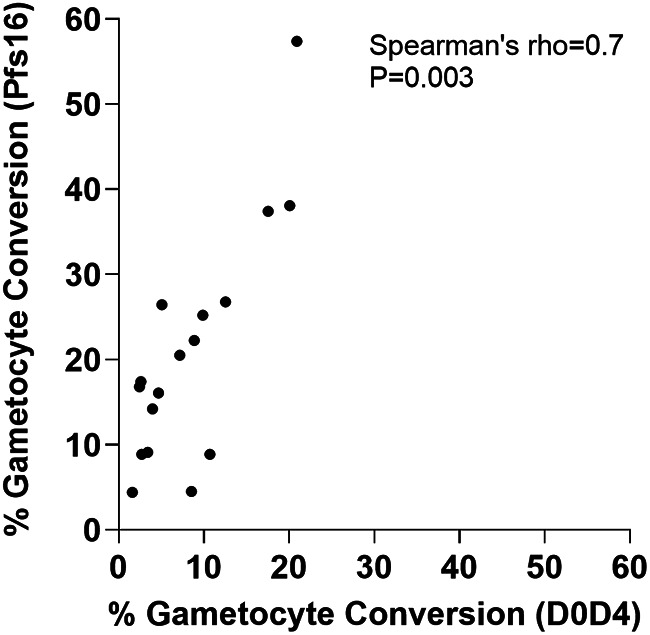
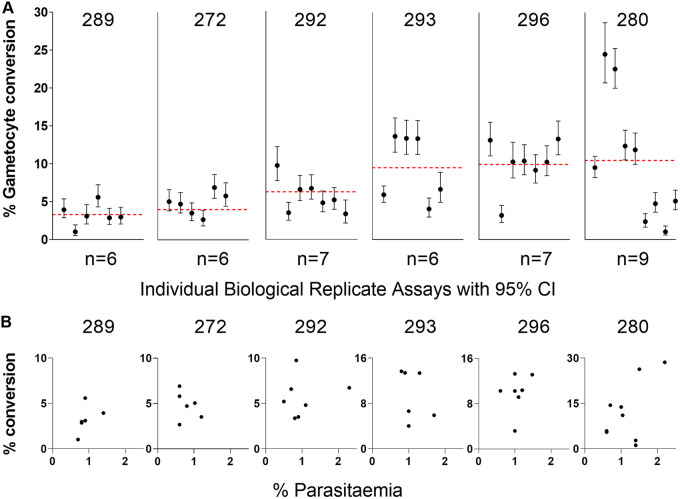
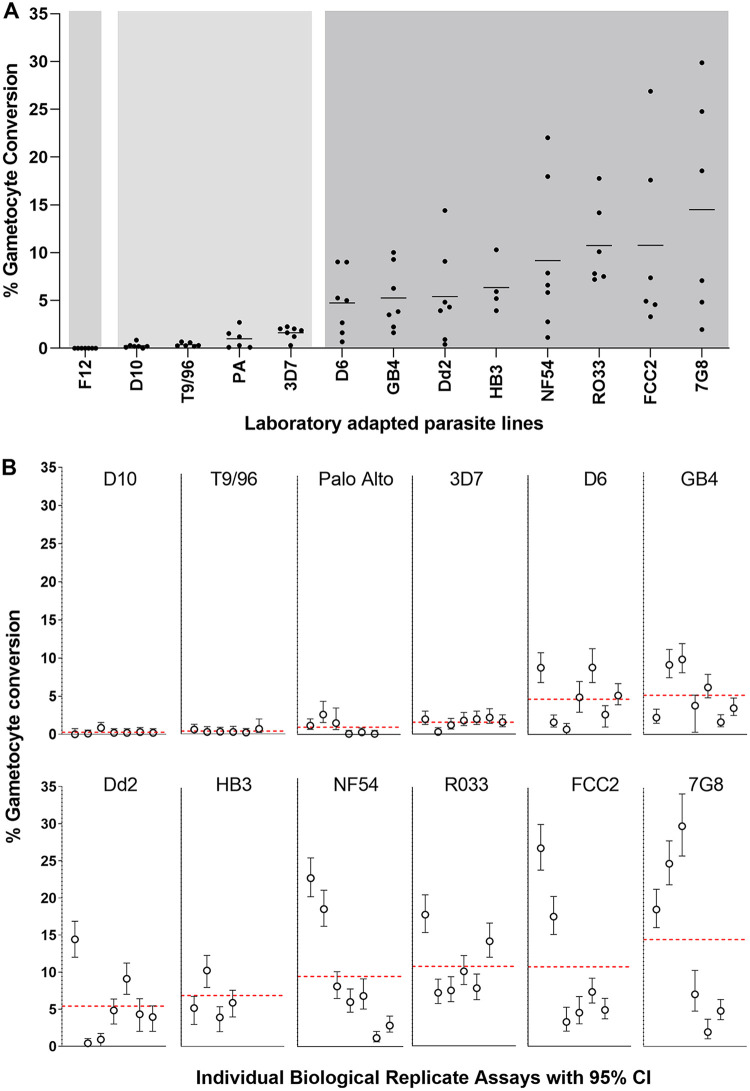
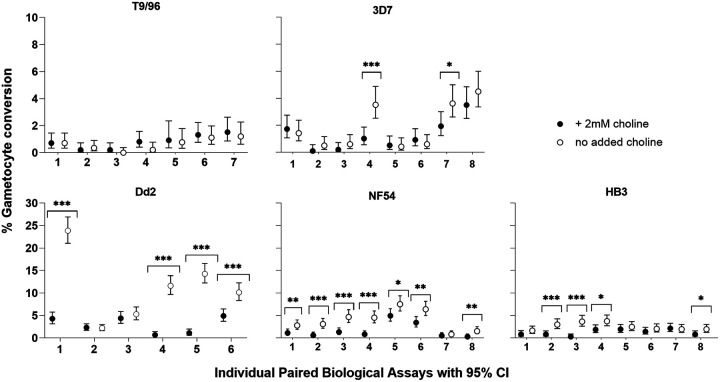
Asexual blood-stage malaria parasites must produce sexual progeny to infect mosquitoes. It is important to understand the scope and causes of intraspecific variation in sexual commitment rates, particularly for the major human parasite P. falciparum. First, two alternative assay methods of measuring sexual commitment were compared to test a genetically modified P. falciparum line with elevated commitment rates inducible by overexpression of GDV1. The methods yielded correlated measurements with higher sensitivity and precision being achieved by one employing detection of the early gametocyte differentiation marker Pfs16. Thus, this was used to survey a diverse range of parasite lines and test each in multiple biological replicate assays in a serum-free medium supplemented with Albumax. There were differences among six recent clinical isolates from Ghana in their mean rates of sexual commitment per cycle, ranging from 3.3% to 12.2%. Among 13 diverse long-term laboratory-adapted lines, mean sexual commitment rates for most ranged from 4.7% to 13.4%, a few had lower rates with means from 0.3 to 1.6%, and one with a nonfunctional ap2-g gene always showed zero commitment. Among a subset of lines tested for the effects of exogenous choline to suppress commitment, there were significant differences. As expected, there was no effect in a line that had lost the gdv1 gene and that had generally low commitment, whereas the others showed quantitatively variable but significant responses to choline, suggesting potential trait variation. The results indicated the value of performing multiple replicate assays for understanding the variation of this key reproductive trait that likely affects transmission. IMPORTANCE Only sexual-stage malaria parasites are transmitted from human blood to mosquitoes. Thus, it is vital to understand variations in sexual commitment rates because these may be modifiable or susceptible to blocking. Two different methods of commitment rate measurement were first compared, demonstrating higher sensitivity and precision by the detection of an early differentiation marker, which was subsequently used to survey diverse lines. Clinical isolates from Ghana showed significant variation in mean per-cycle commitment rates and variation among biological replicates. Laboratory-adapted lines of diverse origins had a wider range with most being within the range observed for the clinical isolates, while a minority consistently had lower or zero rates. There was quantitative variation in the effects when adding choline to suppress commitment, indicating differing responsiveness of parasites to this environmental modification. Performing multiple assay replicates and comparisons of diverse isolates was important to understand this trait and its potential effects on transmission.

Keywords: clinical isolates; differentiation; gametocyte; intraspecific variation; sexual development.


Conflict of interest statement

The authors declare no conflict of interest.

Figures

FIG 1
FIG 1
Comparison of two different methods to assay P. falciparum gametocyte conversion rates in culture (details in Materials and Methods). (A) Scheme outlining the timing of processes undertaken for the different methods, Assay Method 1 involving staining of Pfs16 as a marker of early gametocytes, and Assay Method 2 involving the counting of stage-II gametocytes after 4 days of development in cultures treated with N-acetyl-d-glucosamine (NAG) to prevent asexual parasite replication. (B) Representative microscopy images of parasites on Giemsa-stained slides used for counting ring stage parasitemia early in the cycle (day 0); counting of proportions of stage-I gametocytes 16 to 22 h later by staining of the early gametocyte differentiation marker Pfs16 (DAPI staining of parasite DNA in blue, and anti-Pfs16 monoclonal antibody staining in red) for Assay Method 1; and counting stage-II gametocytemia in the NAG-treated culture after 96 h (day 4) for Assay Method 2.
FIG 2
FIG 2
Comparison of the sensitivity and precision of two different methods for measuring P. falciparum sexual commitment in terms of gametocyte conversion rates. Multiple paired replicate assays were performed with the parasite clone 3D7/iGP_D9 (35), which allowed inducible overexpression of GDV1 fused to a destabilization domain (DD) stabilized in the presence of Shield-1 reagent to provide controlled elevation of sexual commitment (closed circles indicate GDV1–ON, open circles GDV1-OFF). Both methods showed the expected significant elevation in gametocyte conversion in the presence of Shield-1 reagent in all individual assays (P < 0.001 for each of the individual replicate assays). (A) The gametocyte conversion rate (with 95% CI) for each of seven independent experiments using Assay Method 1 involving staining of the gametocyte marker Pfs16, yielding a mean conversion rate of 38.3% under GDV1-ON and 6.3% under GDV1-OFF conditions (B) The gametocyte conversion rate (with 95% CI) for each of four experiments using Assay Method 2, which involved a comparison of day 4 (D4) gametocyte parasitemia with D0 ring-stage parasitemia (assays paired with the first four independent experiments shown for Assay Method 1), yielding a mean conversion rate of 15.9% under GDV1-ON and 4.1% under GDV1-OFF conditions. Exact parasite and erythrocyte count and statistical analyses for all assays are detailed in Table S1 in Supplemental File 1.
FIG 3
FIG 3
Significant correlation in the estimates of gametocyte conversion rate obtained by the two different assay methods being compared. Paired assays were performed using Assay Method 1 (involving Pfs16 staining to discriminate sexually developing from asexually developing parasites) and Assay Method 2 (involving counts of parasites 4 days apart to determine numbers of stage-II gametocytes compared to earlier ring stages) on multiple replicates of 3D7/iGP_D9 with a range of concentrations of Shield-1 reagent (N = 17 paired assays in total; details in Table S2 in Supplemental File 1). This significant correlation confirmed that either method gave valid measurements if used alone, whereas Assay Method 1 was more sensitive (as indicated here and in Fig. 2). Assay Method 1 was also more precise because it involved the calculation of a single numerical ratio rather than a ratio-of-ratios based on two different counts performed 4 days apart which is highly vulnerable to effects of small numbers in either count. For visual clarity, the individual assay 95% confidence intervals are not shown, but these and numerical data from all assays are in Table S2 in Supplemental File 1.
FIG 4
FIG 4
Gametocyte conversion rates of six recently culture-established Ghanaian clinical isolates. These were selected for study as they are unrelated single-genotype infections, chosen from a larger number of samples from a highly endemic population that contained many multiple-genotype infections (36). (A) For each isolate, a minimum of six biological replicate assays were performed at various times after different duration of culture (specified for each replicate in Table S3 in Supplemental File 1 and ranging between 48 to 125 days overall). The conversion rate estimate from each replicate is plotted with 95% confidence intervals, while the red dotted line represents the mean across replicate assays. There were significant differences in pairwise comparisons (Mann-Whitney tests, Table S4 in Supplemental File 1), with isolate 296 having a significantly higher conversion rate than three others (isolates 272, 289, and 292), and isolate 289 having a significantly lower rate than three others (292, 293, and 296) (Table S4 in Supplemental File 1). Details and all numerical data are given in Table S3 in Supplemental File 1. (B) For each isolate, the gametocyte conversion rate of individual replicates is plotted in relation to the culture parasitemia in the previous cycle (between 0.5 and 2.5% for all experimental replicates). The 95% confidence intervals for the individual conversion rate points are not shown because they are the same as in (A). There was no systematic trend toward positive or negative correlation, except a marginally significant positive correlation for isolate 289 (P = 0.02), which may indicate slight enhancement at higher parasitemia or a chance finding due to multiple comparisons (Table 1).
FIG 5
FIG 5
Gametocyte conversion rates of 13 long-term culture-adapted P. falciparum lines of diverse geographical origins. Each different parasite line was tested with multiple independent biological replicate assays, most individual lines having at least six replicates. All counts and calculated values for all replicates are given in full in Table S5 in Supplemental File 1. (A) For each parasite line, the conversion rates are shown for each of the biological replicates and the horizontal line shows the mean across all biological replicates, with a spectrum of variation among the different lines, means ranging from 0% to 14.5%. The background with different shades of gray show the conversion rates separating into three different groups, based on pairwise comparisons of all replicates between the parasite lines (Mann-Whitney tests, Table S6 in Supplemental File 1). One line (F12, with a non-functional ap2-g gene) shows no conversion, four lines (D10, T9/96, Palo Alto, and 3D7) show consistently low conversion (means between 0.3% and 1.6%), and eight lines (D6, GB4, Dd2, HB3, NF54, RO33, 7G8, and FCC2) shows higher levels of conversion (means between 4.7% and 14.5%). (B) Variation in the gametocyte conversion rates among independent replicate assays for each line is shown in more detail by, including 95% CI of the counts for each assay of each line, except F12 for which there was zero conversion in all assays. Identical methods were used in assaying these parasite lines as the clinical isolates shown in Fig. 4, with assays being conducted in parallel under the same conditions in the same laboratory. Erythrocytes from different erythrocyte donors used at various times throughout the series of experiments did not determine the variation between assay replicates (Table S5 in Supplemental File 1).
FIG 6
FIG 6
Variation in sensitivity of different P. falciparum lines to choline in medium to suppress sexual commitment. Closed circles represent biological replicates cultured in the presence of 2 mM choline, and open circles represent biological replicates grown in the absence of choline. T9/96 showed no response to choline in any of the seven biological replicate assays, whereas each of the other cultured lines showed responses that vary among biological replicates. Significant differences between paired measurements with and without choline in individual replicate assays for 3D7, Dd2, HB3 and NF54 are highlighted with asterisks (Fisher’s Exact Test; *, P < 0.05; **, P < 0.01; ***, P < 0.001). Across all replicates, estimated by Mantel-Haenszel rate ratios, the mean effect of choline was greatest for Dd2 (3.5-fold; 95% CI, 3.0- to 4.1-fold), intermediate for NF54 (2.4-fold; 95% CI, 2.0- to 3.0-fold) and HB3 (2.0-fold; 95% CI, 1.6- to 2.5-fold), and the least for 3D7 (1.5-fold; 95% CI, 1.2- to 1.9-fold). All individual counts and assay values for all biological replicates are in Table S7 in Supplemental File 1.

Similar articles

Cited by

References

    1. McKenzie FE, Bossert WH. 1998. The optimal production of gametocytes by Plasmodium falciparum. J Theor Biol 193:419–428. doi:10.1006/jtbi.1998.0710. - DOI - PubMed
    1. Schneider P, Greischar MA, Birget PLG, Repton C, Mideo N, Reece SE. 2018. Adaptive plasticity in the gametocyte conversion rate of malaria parasites. PLoS Pathog 14:e1007371. doi:10.1371/journal.ppat.1007371. - DOI - PMC - PubMed
    1. WHO. 2021. World Malaria Report 2021. Geneva.
    1. Barry A, Bradley J, Stone W, Guelbeogo MW, Lanke K, Ouedraogo A, Soulama I, Nebie I, Serme SS, Grignard L, Patterson C, Wu L, Briggs JJ, Janson O, Awandu SS, Ouedraogo M, Tarama CW, Kargougou D, Zongo S, Sirima SB, Marti M, Drakeley C, Tiono AB, Bousema T. 2021. Higher gametocyte production and mosquito infectivity in chronic compared to incident Plasmodium falciparum infections. Nat Commun 12:2443. doi:10.1038/s41467-021-22573-7. - DOI - PMC - PubMed
    1. Alano P, Carter R. 1990. Sexual differentiation in malaria parasites. Annu Rev Microbiol 44:429–449. doi:10.1146/annurev.mi.44.100190.002241. - DOI - PubMed

Publication types