Bacillus subtilis Stressosome Sensor Protein Sequences Govern the Ability To Distinguish among Environmental Stressors and Elicit Different σB Response Profiles
- PMID: 36409125
- PMCID: PMC9765535
- DOI: 10.1128/mbio.02001-22
Bacillus subtilis Stressosome Sensor Protein Sequences Govern the Ability To Distinguish among Environmental Stressors and Elicit Different σB Response Profiles
Abstract
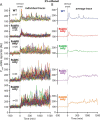
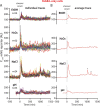
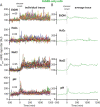
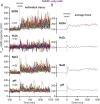
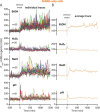
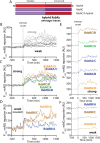
Bacteria use a variety of systems to sense stress and mount an appropriate response to ensure fitness and survival. Bacillus subtilis uses stressosomes-cytoplasmic multiprotein complexes-to sense environmental stressors and enact the general stress response by activating the alternative sigma factor σB. Each stressosome includes 40 RsbR proteins, representing four paralogous (RsbRA, RsbRB, RsbRC, and RsbRD) putative stress sensors. Population-level analyses suggested that the RsbR paralogs are largely redundant, while our prior work using microfluidics-coupled fluorescence microscopy uncovered differences among the RsbR paralogs' σB response profiles with respect to timing and intensity when facing an identical stressor. Here, we use a similar approach to address the question of whether the σB responses mediated by each paralog differ in the presence of different environmental stressors: can they distinguish among stressors? Wild-type cells (with all four paralogs) and RsbRA-only cells activate σB with characteristic transient response timing irrespective of stressor but show various response magnitudes. However, cells with other individual RsbR paralogs show distinct timing and magnitude in their responses to ethanol, salt, oxidative, and acid stress, implying that RsbR proteins can distinguish among stressors. Experiments with hybrid fusion proteins comprising the N-terminal half of one paralog and the C-terminal half of another argue that the N-terminal identity influences response magnitude and that determinants in both halves of RsbRA are important for its stereotypical transient σB response timing. IMPORTANCE Bacterial survival depends on appropriate responses to diverse stressors. The general stress-response system in the environmental model bacterium Bacillus subtilis is constantly poised for an immediate response and uses unusual stress-sensing protein complexes called stressosomes. Stressosomes typically contain four different types of putative sensing protein. We asked whether each type of sensor has a distinct role in mediating response dynamics to different environmental stressors. We find that one sensor type always mediates a transient response, while the others show distinct response magnitude and timing to different stressors. We also find that a transient response is exceptional, as several engineered hybrid proteins did not show strong transient responses. Our work reveals functional distinctions among subunits of the stressosome complex and represents a step toward understanding how the general stress response of B. subtilis ensures its survival in natural environmental settings.
Keywords: microfluidics; sigma factors; signal transduction; stress proteins; stress response.
Conflict of interest statement
The authors declare no conflict of interest.
Figures


Similar articles
-
Temporal σB stress-response profiles impact Bacillus subtilis fitness.mSphere. 2024 Feb 28;9(2):e0071923. doi: 10.1128/msphere.00719-23. Epub 2024 Jan 18. mSphere. 2024. PMID: 38236030 Free PMC article.
-
Stressosome-independent but RsbT-dependent environmental stress sensing in Bacillus subtilis.Nat Commun. 2025 Feb 13;16(1):1591. doi: 10.1038/s41467-025-56871-1. Nat Commun. 2025. PMID: 39939311 Free PMC article.
-
Stressosomes formed in Bacillus subtilis from the RsbR protein of Listeria monocytogenes allow σ(B) activation following exposure to either physical or nutritional stress.J Bacteriol. 2010 Dec;192(23):6279-86. doi: 10.1128/JB.00467-10. Epub 2010 Oct 8. J Bacteriol. 2010. PMID: 20935101 Free PMC article.
-
The RsbRST stress module in bacteria: a signalling system that may interact with different output modules.J Mol Microbiol Biotechnol. 2005;9(2):65-76. doi: 10.1159/000088837. J Mol Microbiol Biotechnol. 2005. PMID: 16319496 Review.
-
Structure and Function of the Stressosome Signalling Hub.Subcell Biochem. 2017;83:1-41. doi: 10.1007/978-3-319-46503-6_1. Subcell Biochem. 2017. PMID: 28271471 Review.
Cited by
-
Stress-dependent activation of the Listeria monocytogenes virulence program ensures bacterial resilience during infection.mBio. 2025 Jun 11;16(6):e0071925. doi: 10.1128/mbio.00719-25. Epub 2025 Apr 30. mBio. 2025. PMID: 40304513 Free PMC article.
-
Targeted genome mining with GATOR-GC maps the evolutionary landscape of biosynthetic diversity.Nucleic Acids Res. 2025 Jul 8;53(13):gkaf606. doi: 10.1093/nar/gkaf606. Nucleic Acids Res. 2025. PMID: 40626555 Free PMC article.
-
Inorganic polyphosphate and the stringent response coordinately control cell division and cell morphology in Escherichia coli.bioRxiv [Preprint]. 2024 Sep 12:2024.09.11.612536. doi: 10.1101/2024.09.11.612536. bioRxiv. 2024. Update in: mBio. 2025 Feb 05;16(2):e0351124. doi: 10.1128/mbio.03511-24. PMID: 39314361 Free PMC article. Updated. Preprint.
-
Temporal σB stress-response profiles impact Bacillus subtilis fitness.mSphere. 2024 Feb 28;9(2):e0071923. doi: 10.1128/msphere.00719-23. Epub 2024 Jan 18. mSphere. 2024. PMID: 38236030 Free PMC article.
-
Targeted genome mining with GATOR-GC maps the evolutionary landscape of biosynthetic diversity.bioRxiv [Preprint]. 2025 Feb 28:2025.02.24.639861. doi: 10.1101/2025.02.24.639861. bioRxiv. 2025. Update in: Nucleic Acids Res. 2025 Jul 8;53(13):gkaf606. doi: 10.1093/nar/gkaf606. PMID: 40060561 Free PMC article. Updated. Preprint.
References
MeSH terms
Substances
Grants and funding
LinkOut - more resources
Full Text Sources
Molecular Biology Databases

