. 2023 Jan;17(1):98-118.
doi: 10.1002/1878-0261.13346. Epub 2022 Dec 7.

Oxidative stress-induced FAK activation contributes to uterine serous carcinoma aggressiveness

Affiliations

Oxidative stress-induced FAK activation contributes to uterine serous carcinoma aggressiveness

Isabel C Lopez-Mejia et al. Mol Oncol. 2023 Jan.

Abstract

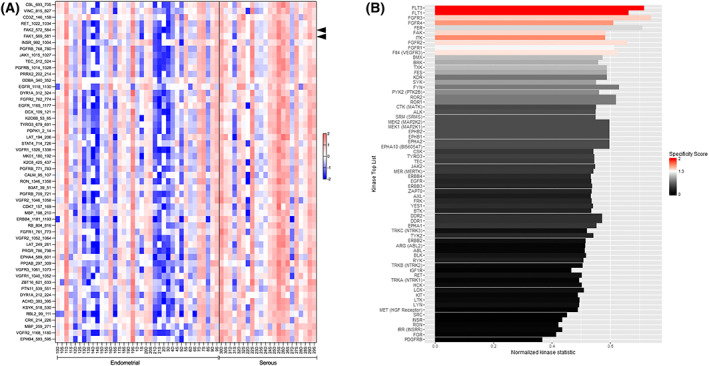
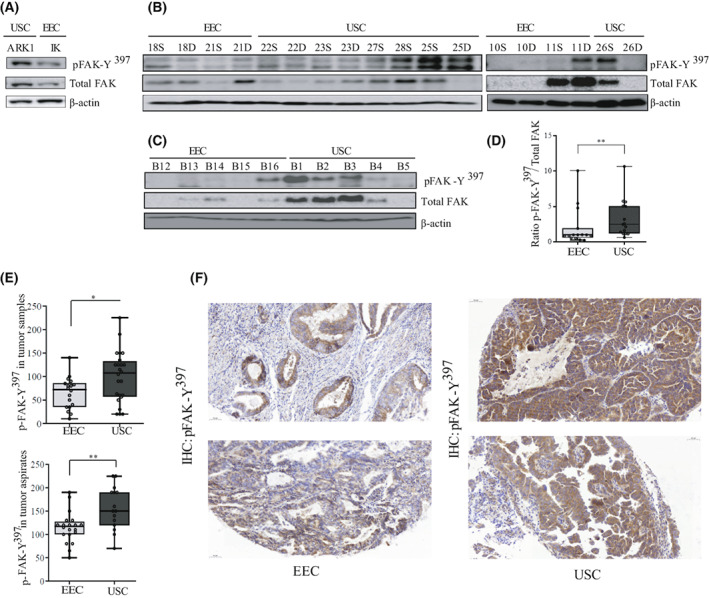
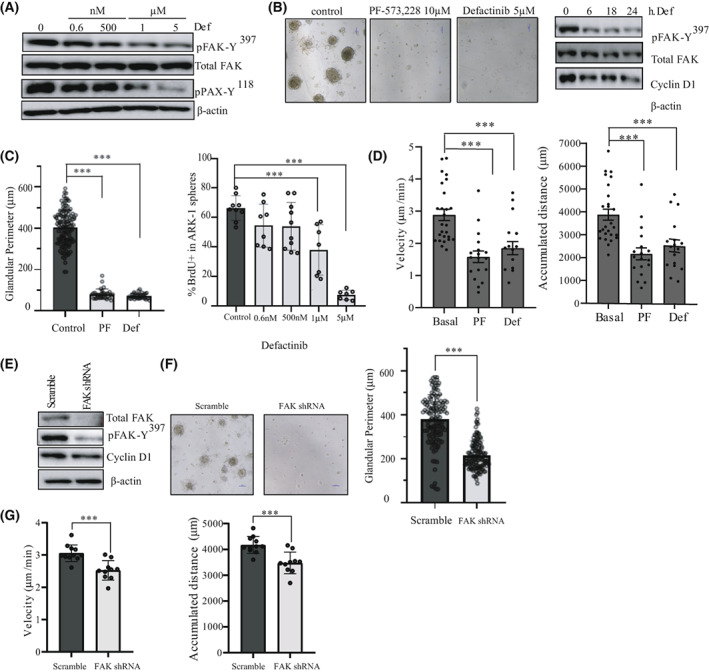
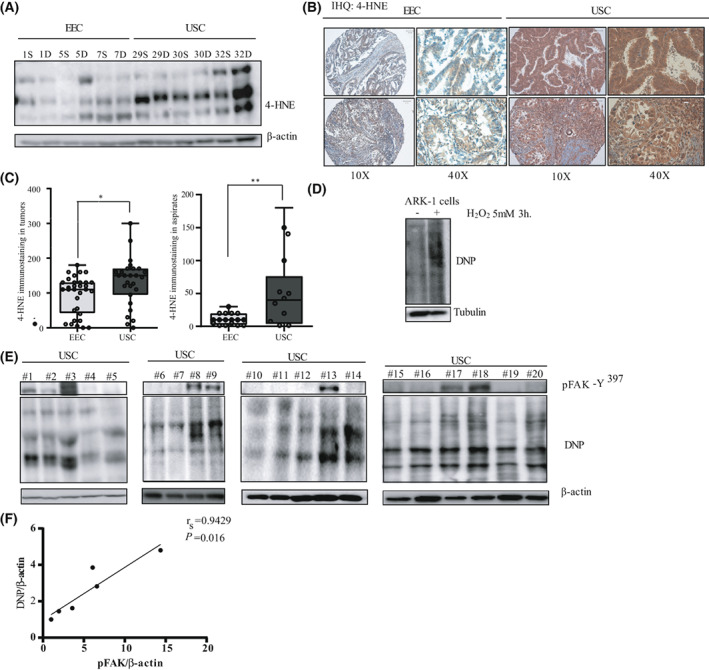
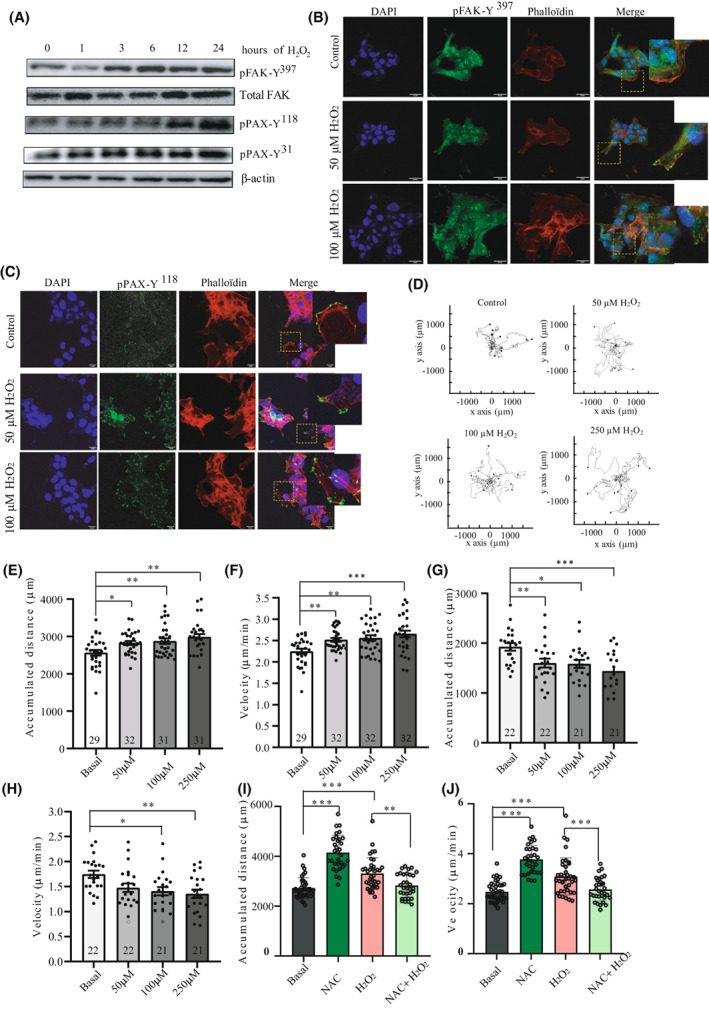
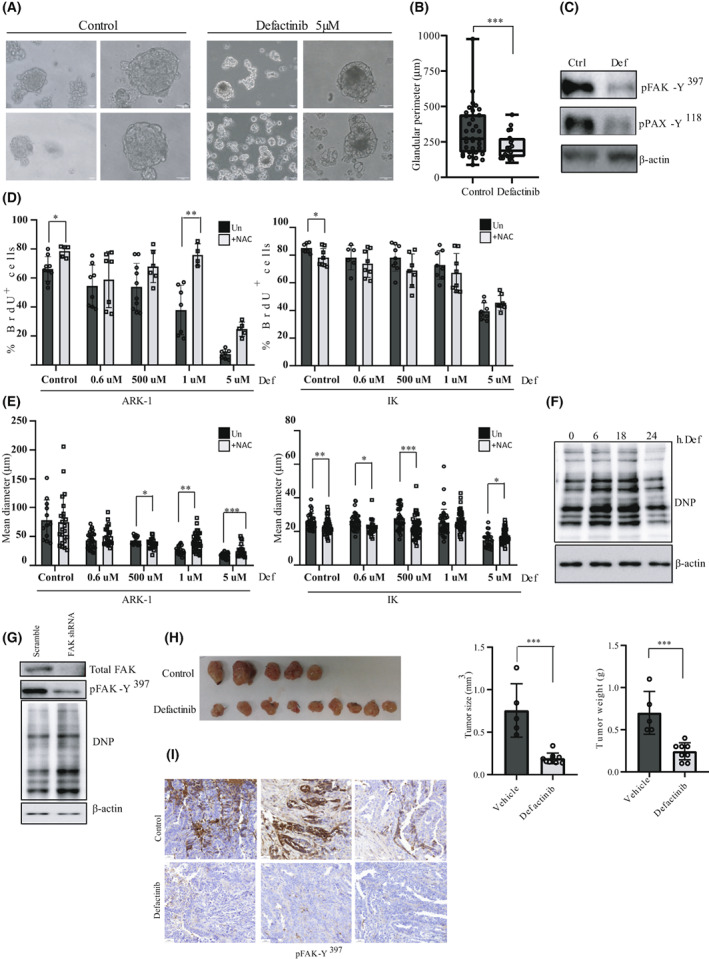
Uterine serous carcinoma (USC) is an aggressive form of endometrial cancer (EC), characterized by its high propensity for metastases. In fact, while endometrioid endometrial carcinoma (EEC), which accounts for 85% of EC, presents a good prognosis, USC is the most frequently fatal. Herein, we used for the first time a peptide-based tyrosine-kinase-activity profiling approach to quantify the changes in tyrosine kinase activation between USC and EEC. Among the tyrosine kinases highly activated in USC, we identified focal adhesion kinase (FAK). We conducted mechanistic studies using cellular models. In a USC cell line, targeting FAK either by inhibitors PF-573228 and defactinib (VS-6063) or by gene silencing limits 3D cell growth and reduces cell migration. Moreover, results from our studies suggest that oxidative stress is increased in USC tumors compared to EEC ones. Reactive oxygen species (ROS) induce tyrosine phosphorylation of FAK and a concomitant tyrosine phosphorylation of paxillin, a mediator of FAK signal transduction. Mechanistically, by tracking hundreds of individual cells per condition, we show that ROS increased cell distance and migration velocity, highlighting the role of ROS-FAK-PAX signaling in cell migration. Both defactinib and ROS scavenger N-acetylcysteine (NAC) revert this effect, pointing toward ROS as potential culprits for the increase in USC cell motility. A proof of concept of the role of FAK in controlling cell growth was obtained in in vivo experiments using cancer-tissue-originated spheroids (CTOS) and a patient-derived orthotopic xenograft model (orthoxenograft/PDOX). Defactinib reduces cell proliferation and protein oxidation, supporting a pro-tumoral antioxidant role of FAK, whereas antioxidant NAC reverts FAK inhibitor effects. Overall, our data points to ROS-mediated FAK activation in USC as being responsible for the poor prognosis of this tumor type and emphasize the potential of FAK inhibition for USC treatment.

Keywords: focal adhesion kinase; migration; reactive oxygen species; uterine serous carcinoma.


Conflict of interest statement

A. Villanueva and A. Vidal are co‐founders of Xenopat S.L. The rest of authors declare no competing interests.

Figures

Fig. 1
Fig. 1
Identification of putative tyrosine kinases with differential activities in EEC vs. USC tumor samples. (A) Forty EEC and 22 USC tumor samples were analyzed for tyrosine kinase activity. Equal amounts of tumor protein lysates were analyzed on PTK peptide microarrays. The PTK experiments were performed using a Pamstation PS12 in more than five independent runs with an equal number of samples from each experimental group. Peptide phosphorylation was analyzed using the Bionavigator software. Signal intensities of the phosphorylated peptides were monitored and represented as a z‐scored data. The heat‐map shows the 53 peptides with significant differences in phosphorylation between both groups when compared by t‐test (*P < 0.05). The increase in red color highlights an overall increase in kinase activity in USC samples compared to EEC ones. Of note, FAK1 and FAK2 peptides are highlighted by arrowheads in the figure. (B) List of putative upstream kinases with differential activity between USC and EEC samples. Putative upstream analysis was performed using the bionavigator software ‘Upstream PTK’ module. The length of the bars corresponds to the normalized kinase statistic, a positive value of the kinase statistic indicates higher activity in USC samples. The color of the bars denotes specificity score. Of note, positive kinase statistics means USC samples show higher tyrosine kinase activity compared to EEC ones.
Fig. 2
Fig. 2
Enhanced FAK activation in USC cell lines, aspirates, and tumor samples compared to their counterparts. (A) Representative western blot analysis of p‐FAK‐Y397 and total FAK levels in ARK‐1 USC and Ishikawa (IK) EEC cell lines (n = 3 independent experiments). β‐actin was used as a loading control. (B) Representative western blot of tumor samples used for the Kinome analysis. A total of 18 EEC and USC samples corresponding to either the superficial part (S) or the deep (D) part of the tumor, were processed under native conditions and analyzed for p‐FAK‐Y397 and total FAK levels. n = 3 independent experiments. β‐actin was used as a loading control. (C) Ten independent samples corresponding to five EEC tumor samples and five USC samples were processed under native conditions to corroborate previous results. (D) Values of p‐FAK‐Y397/total FAK ratio levels between all EEC and USC samples used in B, presented as median ± CI (n = 3 independent experiments). Mann–Whitney U‐test (**P = 0.007). (E) p‐FAK‐Y397 staining in tumor samples and tumor aspirates was calculated by a histoscore method (being 250 points the maximum immunoreactivity), and values are median ± CI (n = 3 independent experiments). Statistical analysis was performed to assess differences in p‐FAK‐Y397 staining between EEC and USC tumors and aspirates using Mann–Whitney U‐test. Both USC tumors and aspirates show a significant higher expression of p‐FAK‐Y397 levels compared to their EEC counterparts (*P = 0.03 and **P = 0.006, respectively). (F) Representative images of p‐FAK‐Y397staining in two EEC and two USC samples. Scale bar: 50 μm, 20× magnification.
Fig. 3
Fig. 3
FAK activation controls cell growth and migration in USC cell lines. (A) Representative western blot of p‐FAK‐Y397, total FAK, and pPAX‐Y118 levels in ARK‐1 cells treated with 0.6 nm, 500 nm, 1 μm, and 5 μm of defactinib for 1 h (n = 3 independent experiments). β‐actin expression is used as a loading control. (B) Representative phase contrast images of ARK‐1 3D cells treated with 10 μm PF‐573228 or 5 μm defactinib for 48 h (n = 3 independent experiments). Magnification 10×. Scale bar: 100 μm. Representative western blot of p‐FAK‐Y397, total FAK, and cyclin D1 levels in ARK‐1 cells treated with 5 μm of defactinib for 0, 6, 18, and 24 h. (n = 3 independent experiments). β‐actin expression is used as a loading control. (C) Quantification of glandular perimeter (μm) in ARK‐1 3D cells treated with 10 μm PF‐573228 or 5 μm defactinib for 48 h. Percentage of positive BrdU ARK‐1 cells in a 3D sphere experiment where cells were treated with 0.6 nm, 500 nm, 1 μm, and 5 μm of defactinib for 48 h. Values are means±SD (n = 3 independent experiments); One‐way ANOVA test was used followed by Tukey post hoc test (***P < 0.001). (D) Quantitative analysis of velocity plot (μm·min−1) and accumulated distance (μm) of ARK‐1 cells, treated with either 10 μm PF‐573228 or 5 μm Defactinib. Values are means ± SD (n = 3 independent experiments); One‐way ANOVA test was used followed by Tukey post hoc test (***P < 0.001). (E) Western blot of p‐FAK‐Y397, total FAK and cyclin D1 levels in ARK‐1 scramble and ARK‐1 FAK shRNA cells (n = 3 independent experiments). β‐actin expression is used as a loading control. (F) Representative images and quantification of glandular perimeter (μm) in scramble and FAK shRNA ARK1‐3D spheroids (n = 3 independent experiments); Student's t‐test (***P < 0.001). Scale bar: 100 μm. (G) Quantitative analysis of velocity plot (μm·min−1) and accumulated distance (μm) of ARK‐1 scramble vs. FAK shRNA cells. Values are means±SD (n = 3 independent experiments); Student's t‐test (***P < 0.001).
Fig. 4
Fig. 4
Enhanced oxidative stress markers in USC. (A) Representative western blot of oxidative stress marker 4‐HNE in 12 Endometrial Cancer samples (6 EEC and 6 USC). (n = 3 independent experiments). Β‐actin expression is used as a loading control. (B) Representative pictures of 4‐HNE immunostaining in two EEC samples and two USC samples. Pictures were taken at 10× and 40× magnifications. Scale bar: 100 μm. (C) 4‐HNE staining intensity score (immunohistochemistry) was calculated by a histoscore method (being 300 points the maximum immunoreactivity). Values are median ± CI (n = 3 independent experiments), statistical analysis was performed to compare 4‐HNE staining intensity in EEC and USC tumor samples and tumor aspirates. Statistical analysis of the obtained results shows a significant increase in 4‐HNE expression in USC tumors compared to EEC ones (Mann–Whitney U‐test; *P = 0.03) and in USC tumor aspirates compared to their EEC counterparts (Mann–Whitney U‐test; **P = 0.01). (D) Protein carbonylation was analyzed by western blot with anti‐DNP antibody in ARK‐1 cells that were either left untreated or stimulated with 5 mm of H2O2 for 3 h (n = 3 independent experiments). (E) Western blot with anti‐DNP in 20 USC samples (that were previously used for the kinome analysis; n = 3 independent experiments). (F) Spearman's rank correlation coefficient analysis comparing p‐FAK‐Y397/β‐actin vs. DNP/β‐actin protein levels in the six samples (numbers 15–20) of the western blot (Spearman r s  = 0.94; P = 0.016).
Fig. 5
Fig. 5
FAK activation under oxidative stress enhances USC single‐cell migration and directionality. (A) Representative western blot of ARK‐1 cells stimulated with 0.5 mm of H2O2 at the indicated times (n = 3 independent experiments). Cell lysates were immunoblotted with antibodies against p‐FAK‐Y397, total FAK, p‐PAX‐Y31, p‐PAX‐Y118. Β‐actin was used as a loading control. (B) Representative images of immunofluorescence staining of p‐FAK‐Y397 in control and H2O2‐stimulated (50 and 100 μm) ARK‐1 cells, assessed by confocal microscopy (n = 3 independent experiments). DAPI (blue), p‐FAK‐Y397 (green), and phalloidin (red). Scale bar: 20 μm. (C) Representative images of immunofluorescence staining of p‐PAX (Y118) in control and H2O2‐stimulated (50 and 100 μm) ARK‐1 cells, assessed by confocal microscopy DAPI (blue), p‐PAX‐Y118 (green), and phalloidin (red) (n = 3 independent experiments). Scale bar: 20 μm. (D) Trajectory plots showing control and H2O2‐stimulated (50, 100, and 250 μm) ARK‐1 cells trajectory for 20 h (n = 3 independent experiments). All tracks were set to a common origin (intersection of x and y axes) using Chemotaxis plugin of ImageJ/Fiji. (E) Quantitative analysis of accumulated distance (μm) and (F) velocity (μm·h−1) of single ARK‐1 control cells and cells treated with 50, 100, and 250 μm H2O2. Values are mean ± SD (n = 3 independent experiments); One‐way ANOVA was used followed by Tukey post hoc test (*P < 0.05; **P < 0.01; ***P < 0.001). (G) Quantitative analysis of accumulated distance (μm) and (H) velocity (μm·h−1) of single ARK‐1 control cells and cells treated with 50, 100, and 250 μm H2O2 and 5 μm Defactinib. Values are mean ± SD (n = 3 independent experiments); One‐way ANOVA was used followed by Tukey post hoc test (*P < 0.05; **P < 0.01; ***P < 0.001). (I) Quantitative analysis of accumulated distance (μm) and (J) velocity (μm·h−1) of single ARK‐1 control cells and cells treated with 1 mm NAC, 250 μm H2O2, and 1 mm NAC + 250 μm H2O2. Values are mean ± SD (n = 3 independent experiments); One‐way ANOVA was used followed by Tukey post hoc test (**P < 0.01; ***P < 0.001).
Fig. 6
Fig. 6
FAK inhibition reduces CTOS model cell viability and in vivo PDOX tumor growth of USC. (A) Representative phase contrast images of CTOS in untreated (control) and treated (5 μm Defactinib) cells for 24 h (n = 3 independent experiments). A magnification is shown, Scale bar: 30 μm. (B) Quantitative analysis of CTOS glandular perimeter (μm) in untreated and Defactinib‐treated spheroids. Values are median ± CI (n = 3 independent experiments; Mann–Whitney U‐test; ***P = 0.004). (C) Representative western blot of CTOS in untreated and Defactinib‐treated cells. Cell lysates were immunoblotted with antibodies against p‐FAK‐Y397 and p‐PAX‐Y118 (n = 3 independent experiments). Β‐actin was used as a loading control. (D) Percentage of BrdU‐positive cells in ARK‐1 and IK spheroid cultures. Cells were either left untreated or were pre‐treated with 1 mm NAC before stimulation at the indicated doses of Defactinib, and then allowed to form 3D spheroid cultures for 48 h, after which BrdU was added to the spheroid cultures. Values are mean ± SD (n = 3 independent experiments); Student's t‐test (*P < 0.05; **P < 0.01). (E) Quantification of spheroid mean diameter (μm) in 3D spheroids from ARK‐1 and IK cells. Values are mean ± SD (n = 3 independent experiments); Student's t‐test (*P < 0.05; **P < 0.01; ***P < 0.001). (F) Representative western blot against DNP in ARK‐1 cells stimulated for the indicated times with defactinib 5 μm (n = 3 independent experiments). (G) Representative western blot against p‐FAK‐Y397, total FAK, and DNP in scramble and lentiviral transduced FAK shRNA cells. β‐actin was used as a loading control (n = 3 independent experiments). (H) Images of PDOX tumors at mice sacrifice in untreated (control) and treated (100 mg·kg−1 Defactinib) conditions. Quantitative analysis of tumor size (mm3) and weight (g) in vehicle and Defactinib‐treated tumors. Values are mean ± SD; Student's t‐test (***P = 0.0002 and P = 0.0004, respectively). (I) Representative pictures of p‐FAK‐Y397 immunostaining in control and defactinib PDOX tumors. Scale bar: 50 μm.

References

    1. Ferlay J, Soerjomataram I, Dikshit R, Eser S, Mathers C, Rebelo M, et al. Cancer incidence and mortality worldwide: sources, methods and major patterns in GLOBOCAN 2012. Int J Cancer. 2015;136:E359–86. 10.1002/ijc.29210 - DOI - PubMed
    1. Hamilton CA, Cheung MK, Osann K, Chen L, Teng NN, Longacre TA, et al. Uterine papillary serous and clear cell carcinomas predict for poorer survival compared to grade 3 endometrioid corpus cancers. Br J Cancer. 2006;94:642–6. 10.1038/sj.bjc.6603012 - DOI - PMC - PubMed
    1. Kandoth C, Schultz N, Cherniack AD, Akbani R, Liu Y, Shen H, et al. Integrated genomic characterization of endometrial carcinoma. Nature. 2013;497:67–73. 10.1038/nature12113 - DOI - PMC - PubMed
    1. Blume‐Jensen P, Hunter T. Oncogenic kinase signalling. Nature. 2001;411:355–65. 10.1038/35077225 - DOI - PubMed
    1. Lagarrigue S, Lopez‐Mejia IC, Denechaud PD, Escoté X, Castillo‐Armengol J, Jimenez V, et al. CDK4 is an essential insulin effector in adipocytes. J Clin Invest. 2016;126:335–48. 10.1172/JCI81480 - DOI - PMC - PubMed

Publication types