. 2023 Jan;17(1):119-133.
doi: 10.1002/1878-0261.13347. Epub 2022 Dec 5.

GALNT2 promotes invasiveness of colorectal cancer cells partly through AXL

Affiliations

GALNT2 promotes invasiveness of colorectal cancer cells partly through AXL

Ying-Yu Liao et al. Mol Oncol. 2023 Jan.

Abstract

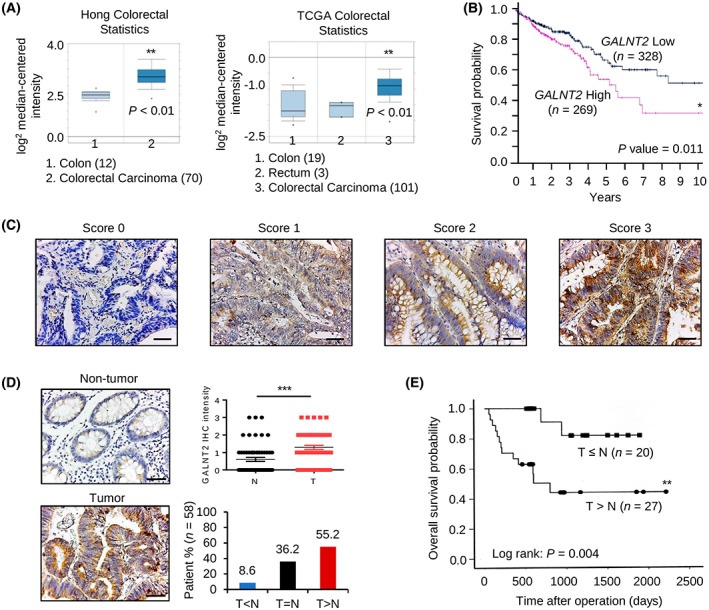
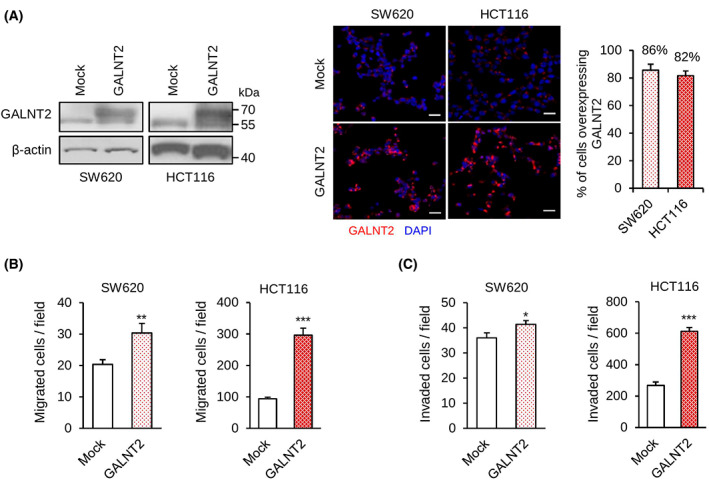
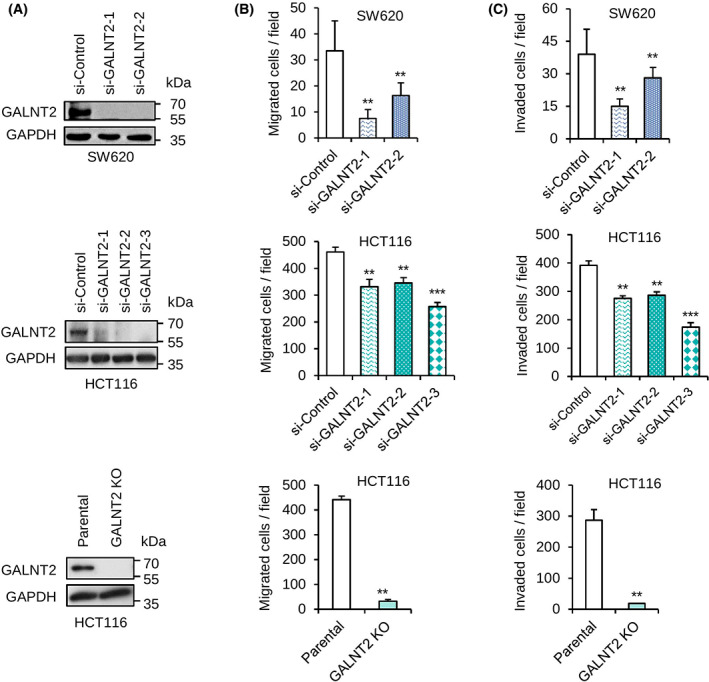
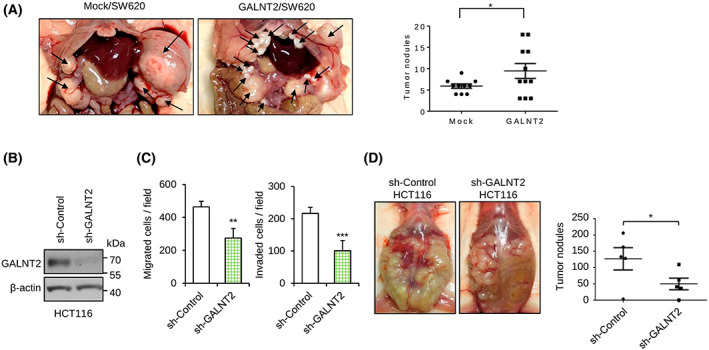
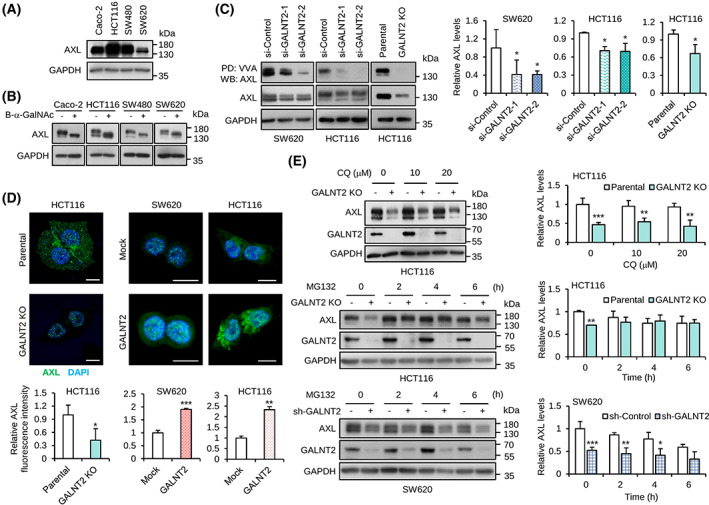
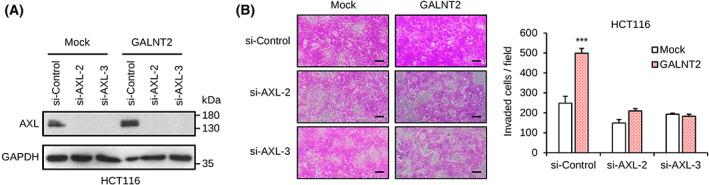
GalNAc-type O-glycosylation and its initiating GalNAc transferases (GALNTs) play crucial roles in a wide range of cellular behaviors. Among 20 GALNT members, GALNT2 is consistently associated with poor survival of patients with colorectal cancer in public databases. However, its clinicopathological significance in colorectal cancer remains unclear. In this study, immunohistochemistry showed that GALNT2 was overexpressed in colorectal tumors compared with the adjacent nontumor tissues. GALNT2 overexpression was associated with poor survival of colorectal cancer patients. Forced expression of GALNT2 promoted migration and invasion as well as peritoneal metastasis of colorectal cancer cells. In contrast, GALNT2 knockdown with siRNAs or knockout with CRISPR/Cas9 system suppressed these malignant properties. Interestingly, we found that GALNT2 modified O-glycans on AXL and determined AXL levels via the proteasome-dependent pathway. In addition, the GALNT2-promoted invasiveness was significantly reversed by AXL siRNAs. These findings suggest that GALNT2 promotes colorectal cancer invasion at least partly through AXL.

Keywords: AXL; GALNT; glycosylation; invasion.


Conflict of interest statement

The authors declare no conflict of interest.

Figures

Fig. 1
Fig. 1
GALNT2 is overexpressed in colorectal tumors and is associated with poor survival. (A) GALNT2 mRNA levels in normal and cancerous colorectal tissues in the Oncomine database. Hong colorectal statistics: 82 samples; TCGA colorectal statistics: 123 samples. Data are presented as mean ± SEM. (B) Kaplan–Meier survival curve of colorectal cancer patients based on GALNT2 mRNA levels generated using the Human Protein Atlas database. The cut‐off value of low and high GALNT2 expression is 14.64. GALNT2 low and high expression groups contain 328 and 269 patient samples, respectively. (C) Scores of GALNT2 expression were analyzed using immunohistochemistry. GALNT2 in colorectal tumors and adjacent nontumor tissues was immuno‐stained with an anti‐GALNT2 antibody using immunohistochemistry. Representative images showing the staining intensity from score 0 to 3. n = 58. Scale bars, 50 μm. (D) GALNT2 was frequently overexpressed in colorectal tumors (T) compared with their surrounding nontumor tissues (N) analyzed by immunohistochemistry (IHC). Scale bars, 50 μm. The statistical results of GALNT2 IHC in pared colorectal tumor tissues (n = 58) are shown. Data are presented as mean ± SEM. ***P < 0.001 using paired Student's t‐test. (E) Kaplan–Meier analysis shows that GALNT2 overexpression correlated with poor survival of patients with colorectal cancer. n = 47. *P < 0.05, **P < 0.01, ***P < 0.001.
Fig. 2
Fig. 2
GALNT2 overexpression promotes migration and invasion of colon cancer cells. (A) GALNT2 overexpression was confirmed using western blotting and immunofluorescence microscopy. Western blots showing GALNT2 expression in mock or GALNT2 overexpressing SW620 and HCT116 cells. β‐actin is an internal control. Representative images of immunofluorescence microscopy showing the high percentage of cells with GALNT2 overexpression in SW620 and HCT116 cells stably transfected with GALNT2 plasmid. GALNT2 was stained in red. Nuclei were stained with DAPI (blue). Five random fields of each pooled cell were calculated. Scale bars, 20 μm. Data are presented as mean ± SD. n = 3. (B) Transwell migration assays. (C) Matrigel invasion assays. Data are presented as mean ± SD. n = 3. *P < 0.05 and **P < 0.01 using Student's t‐test.
Fig. 3
Fig. 3
GALNT2 knockdown or knockout inhibits invasiveness of colon cancer cells. (A) Western blots showing GALNT2 knockdown in SW620 and HCT116 cells as well as GALNT2 knockout (KO) in HCT116 cells. n = 3. GALNT2 was knocked down with different siRNAs. GALNT2 was knocked out using the CRISPR/Cas9 system. (B) Cell migration was analyzed using transwell migration assay. (C) Cell invasion was analyzed by Matrigel invasion assay. Data are presented as mean ± SD. n = 3. **P < 0.01 and ***P < 0.001 using student's t‐test.
Fig. 4
Fig. 4
Effects of GALNT2 on invasive behaviors of colon cancer cells and peritoneal metastases in NOD/SCID mice. (A) Representative images of tumor formation in NOD/SCID mice intraperitoneally injected with control (mock) and GALNT2 overexpressing (GALNT2) SW620 cells. Mice were sacrificed on day 90. Arrows indicate tumors. Statistical results of tumor nodule numbers are presented as mean ± SD. n = 11 for each group obtained from two experiments. (B) Western blots showing stable knockdown of GALNT2 in HCT116 cells. Nontargeting shRNA (sh‐control) was used as control for GALNT2‐specific shRNA (sh‐GALNT2). n = 3. (C) Transwell migration and Matrigel invasion assays. n = 3. (D) Representative images of tumor formation in NOD/SCID mice intraperitoneally injected with HCT116 cells knocked down with sh‐control or sh‐GALNT2. Mice were sacrificed on day 30. Right panel, statistical results of tumor nodule numbers are presented as mean ± SD. n = 5 for each group. *P < 0.05, **P < 0.01, ***P < 0.001. Statistical data were analyzed and obtained through Student's t‐test.
Fig. 5
Fig. 5
GALNT2 adds O‐glycans to AXL and regulates AXL protein levels. (A) Western blots showing the expression of AXL in colon cancer cell lines. GAPDH was a loading control. n = 3. (B) Western blots showing the effect of O‐glycan biosynthesis inhibitor on the molecular weight of AXL. Cells were treated with 2 mm benzyl‐α‐GalNAc (B‐α‐GalNAc) for 24 h. n = 2. (C) VVA pull‐down assay. AXL was pulled down with VVA‐agarose beads and then immunoblotted for AXL. GAPDH was a loading control. Western blotting signals were quantified using imagej software. Statistical data showing relative AXL pulled down by VVA‐agarose beads after normalization to input AXL. n = 3. (D) Confocal microscopy of AXL. Colon cancer cells as indicated were stained with an anti‐AXL antibody followed by FITC‐conjugated secondary antibody. Nuclei were stained with DAPI. Scale bar, 20 μm. The relative intensity of AXL signals was quantified using five cells from each image. (E) Western blot analysis of AXL in cells treated with lysosome inhibitor chloroquine (CQ) or proteasome inhibitor MG132. Parental and GALNT2 knockout (KO) HCT116 cells as well as mock and stable GALNT2 knockdown (sh‐GALNT2) SW620 cells were used. Relative AXL levels normalized to GAPDH were quantified using ImageJ software (National Institutes of Health, Bethesda, Maryland, USA.) and are shown. Data are presented as mean ± SD. n = 3 for each group. *P < 0.05, **P < 0.01, ***P < 0.001, by Student's t‐test.
Fig. 6
Fig. 6
GALNT2‐promoted invasiveness is primarily through AXL in colon cancer cells. (A) Western blots showing siRNA‐mediated knockdown of AXL in GALNT2 stable overexpressing HCT116 cells. Two independent siRNAs against AXL (si‐AXL‐2 and si‐AXL‐3) were used. n = 3. (B) Effects of AXL siRNAs on GALNT2‐promoted invasion of HCT116 cells. Representative images of the Matrigel invasion assay are shown. Scale bar, 20 μm. Data are presented as mean ± SD. n = 3, ***P < 0.001, by Student's t‐test.

References

    1. Fahrner M, Bronsert P, Fichtner‐Feigl S, Jud A, Schilling O. Proteome biology of primary colorectal carcinoma and corresponding liver metastases. Neoplasia. 2021;23:1240–51. - PMC - PubMed
    1. Kawada K, Hasegawa S, Murakami T, Itatani Y, Hosogi H, Sonoshita M, et al. Molecular mechanisms of liver metastasis. Int J Clin Oncol. 2011;16:464–72. - PubMed
    1. Franko J, Shi Q, Meyers JP, Maughan TS, Adams RA, Seymour MT, et al. Prognosis of patients with peritoneal metastatic colorectal cancer given systemic therapy: an analysis of individual patient data from prospective randomised trials from the analysis and research in cancers of the digestive system (ARCAD) database. Lancet Oncol. 2016;17:1709–19. - PubMed
    1. Lemke G. Biology of the TAM receptors. Cold Spring Harb Perspect Biol. 2013;5:a009076. - PMC - PubMed
    1. Burstyn‐Cohen T, Maimon A. TAM receptors, phosphatidylserine, inflammation, and cancer. Cell Commun Signal. 2019;17:156. - PMC - PubMed

Publication types

MeSH terms

Substances