

A systematic review of computational models for the design of spinal cord stimulation therapies: from neural circuits to patient-specific simulations
- PMID: 36409303
- PMCID: PMC10259770
- DOI: 10.1113/JP282884
A systematic review of computational models for the design of spinal cord stimulation therapies: from neural circuits to patient-specific simulations
Abstract
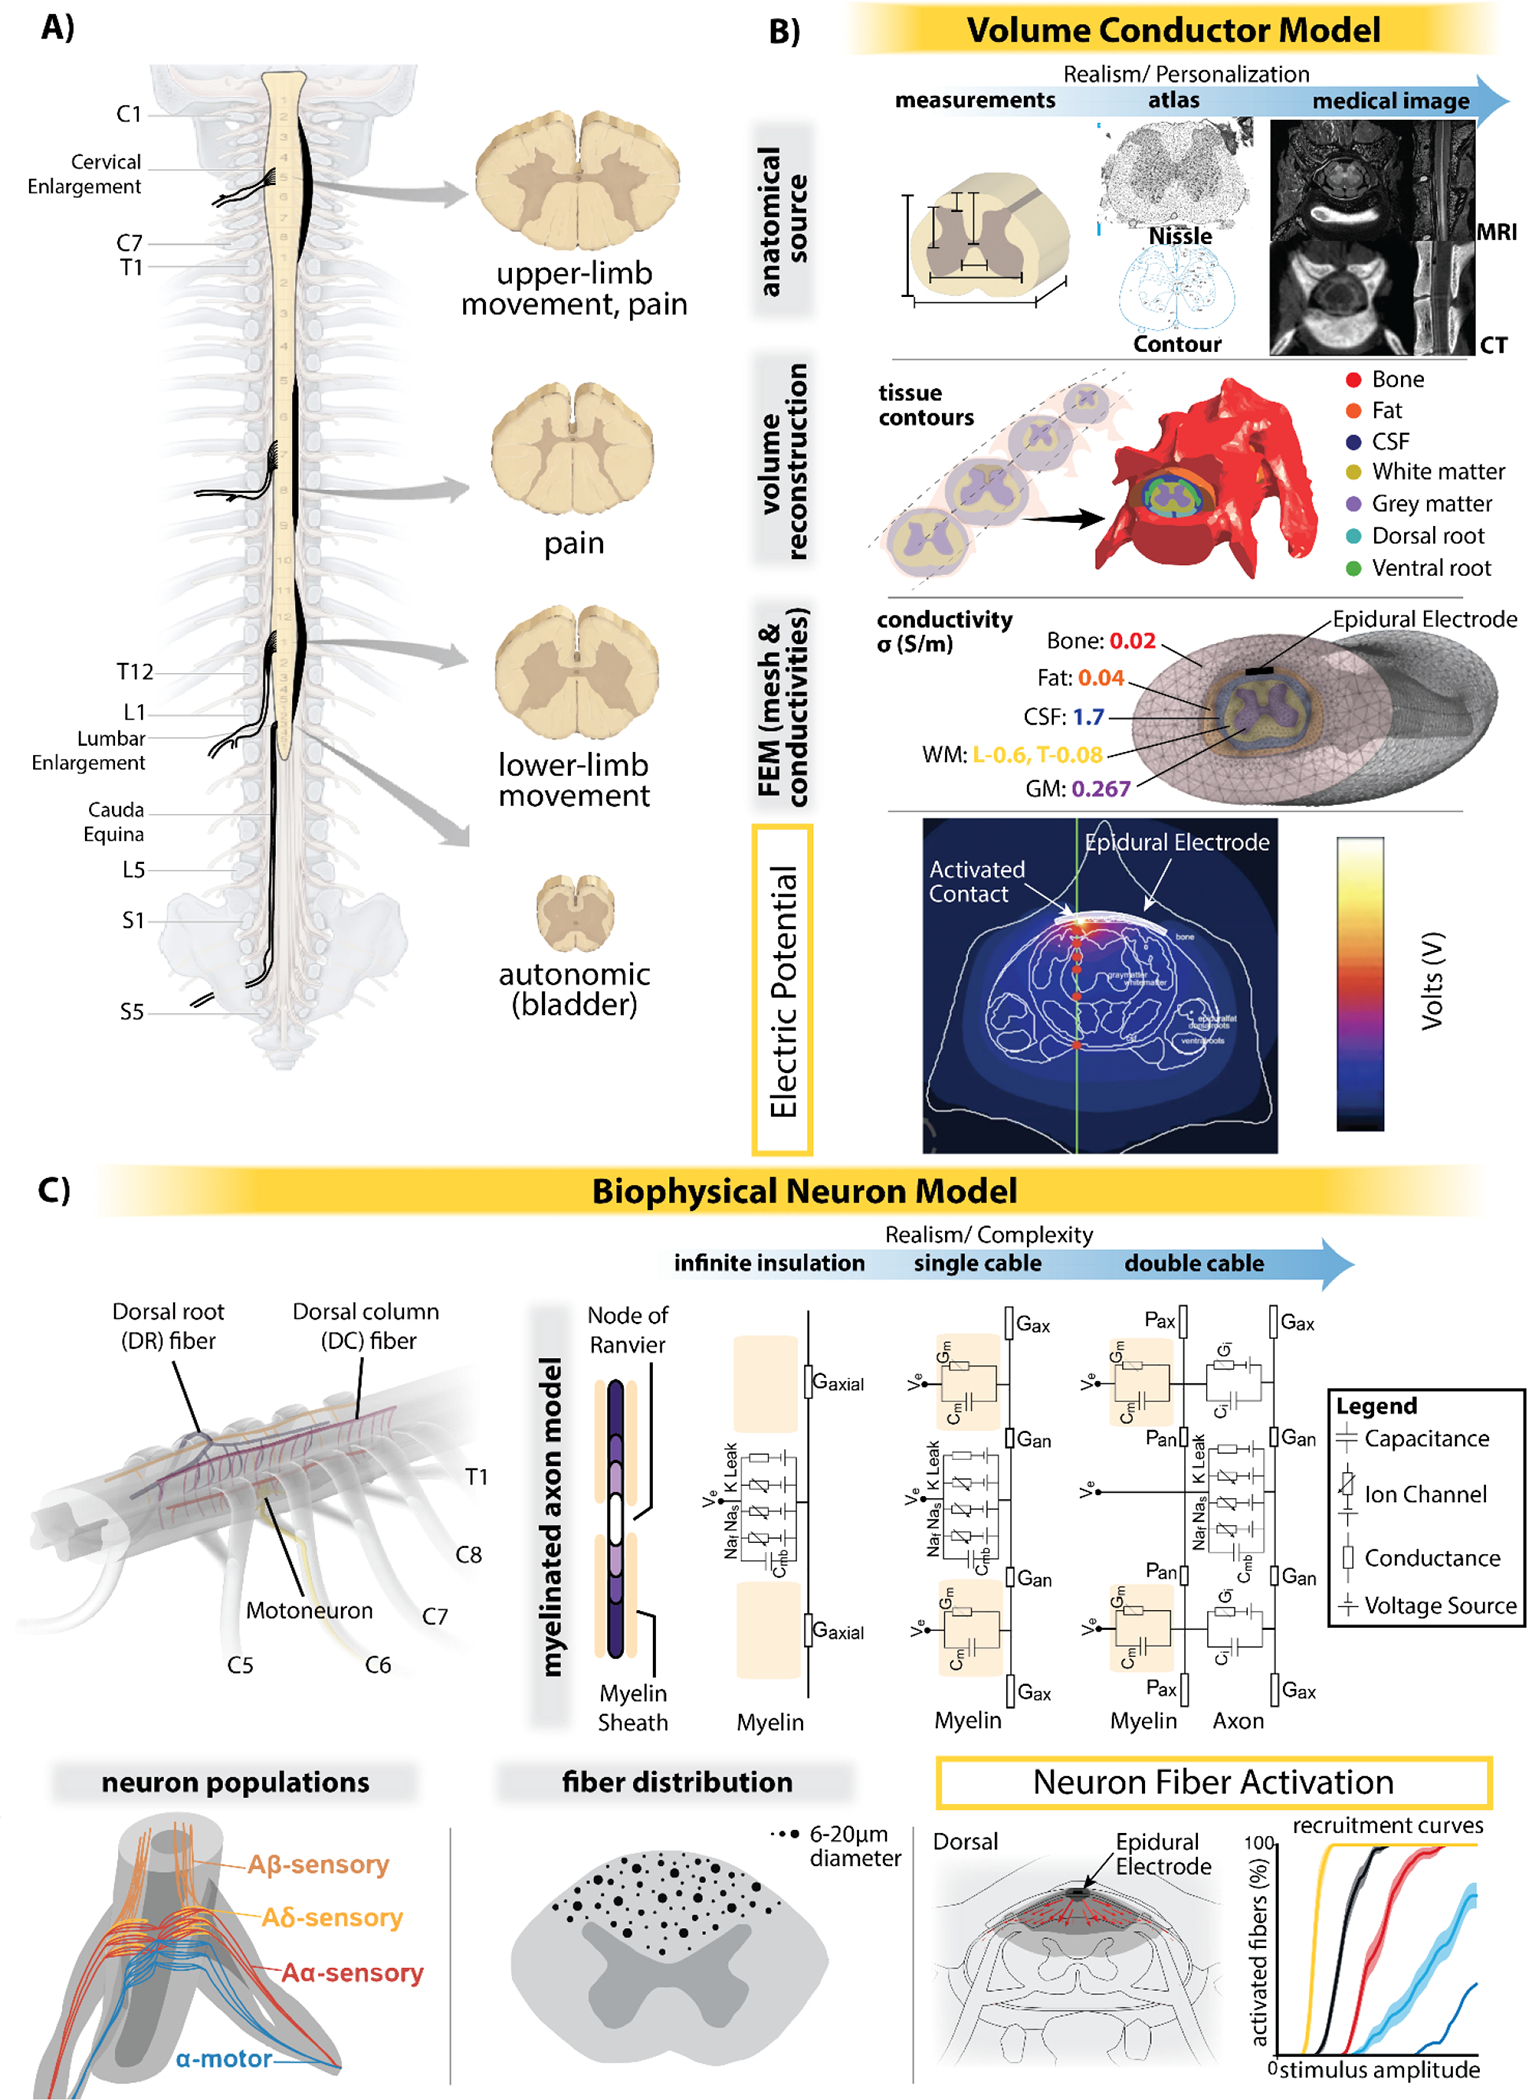
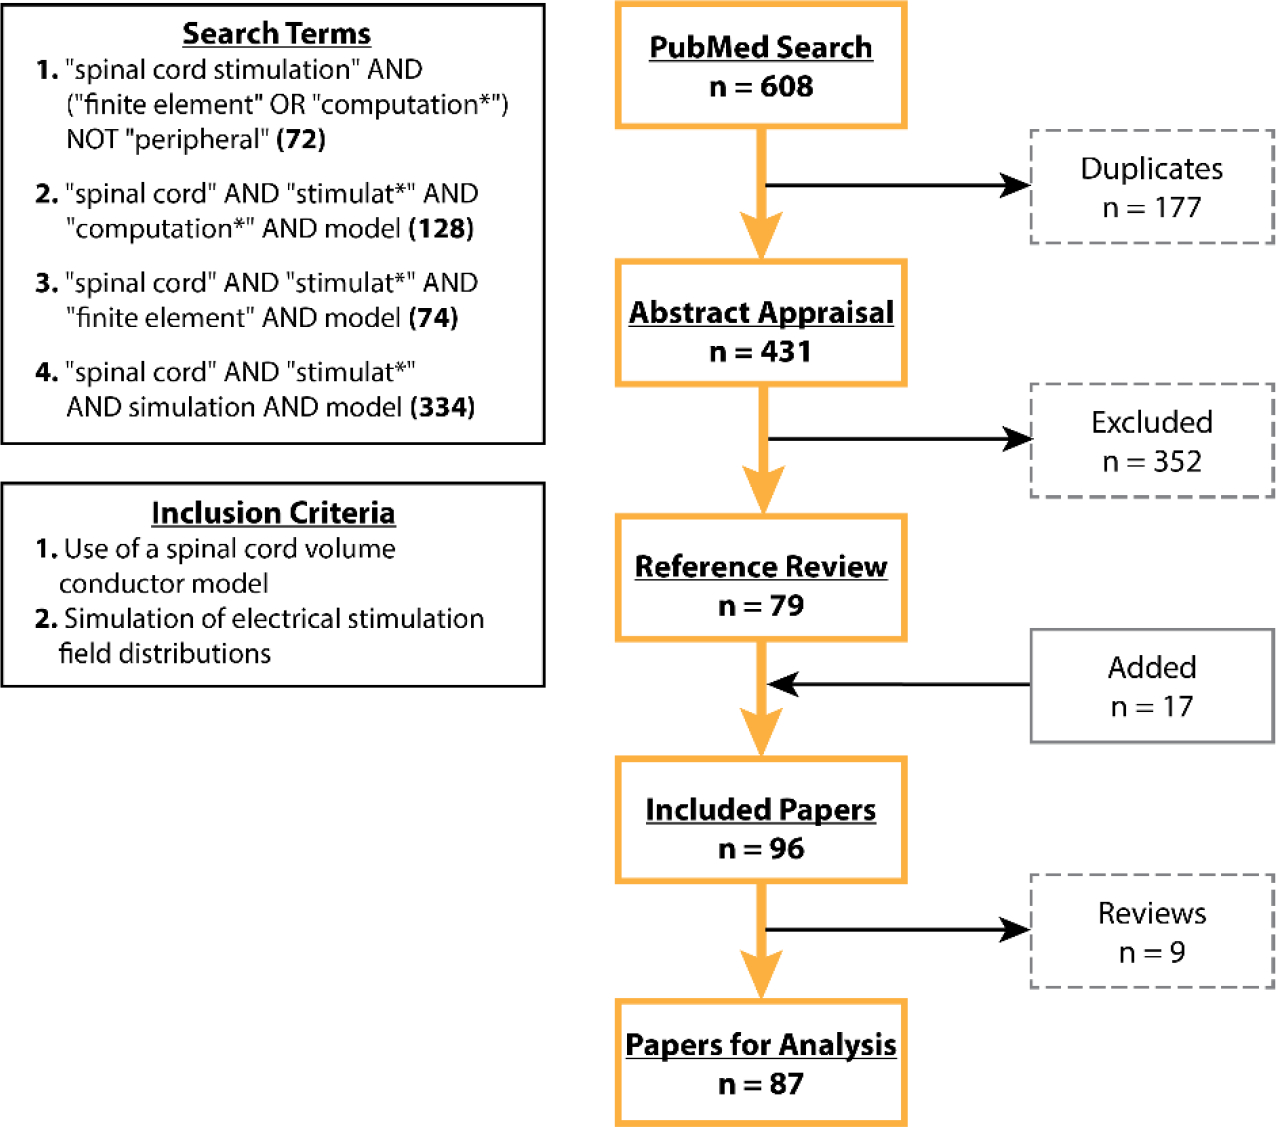
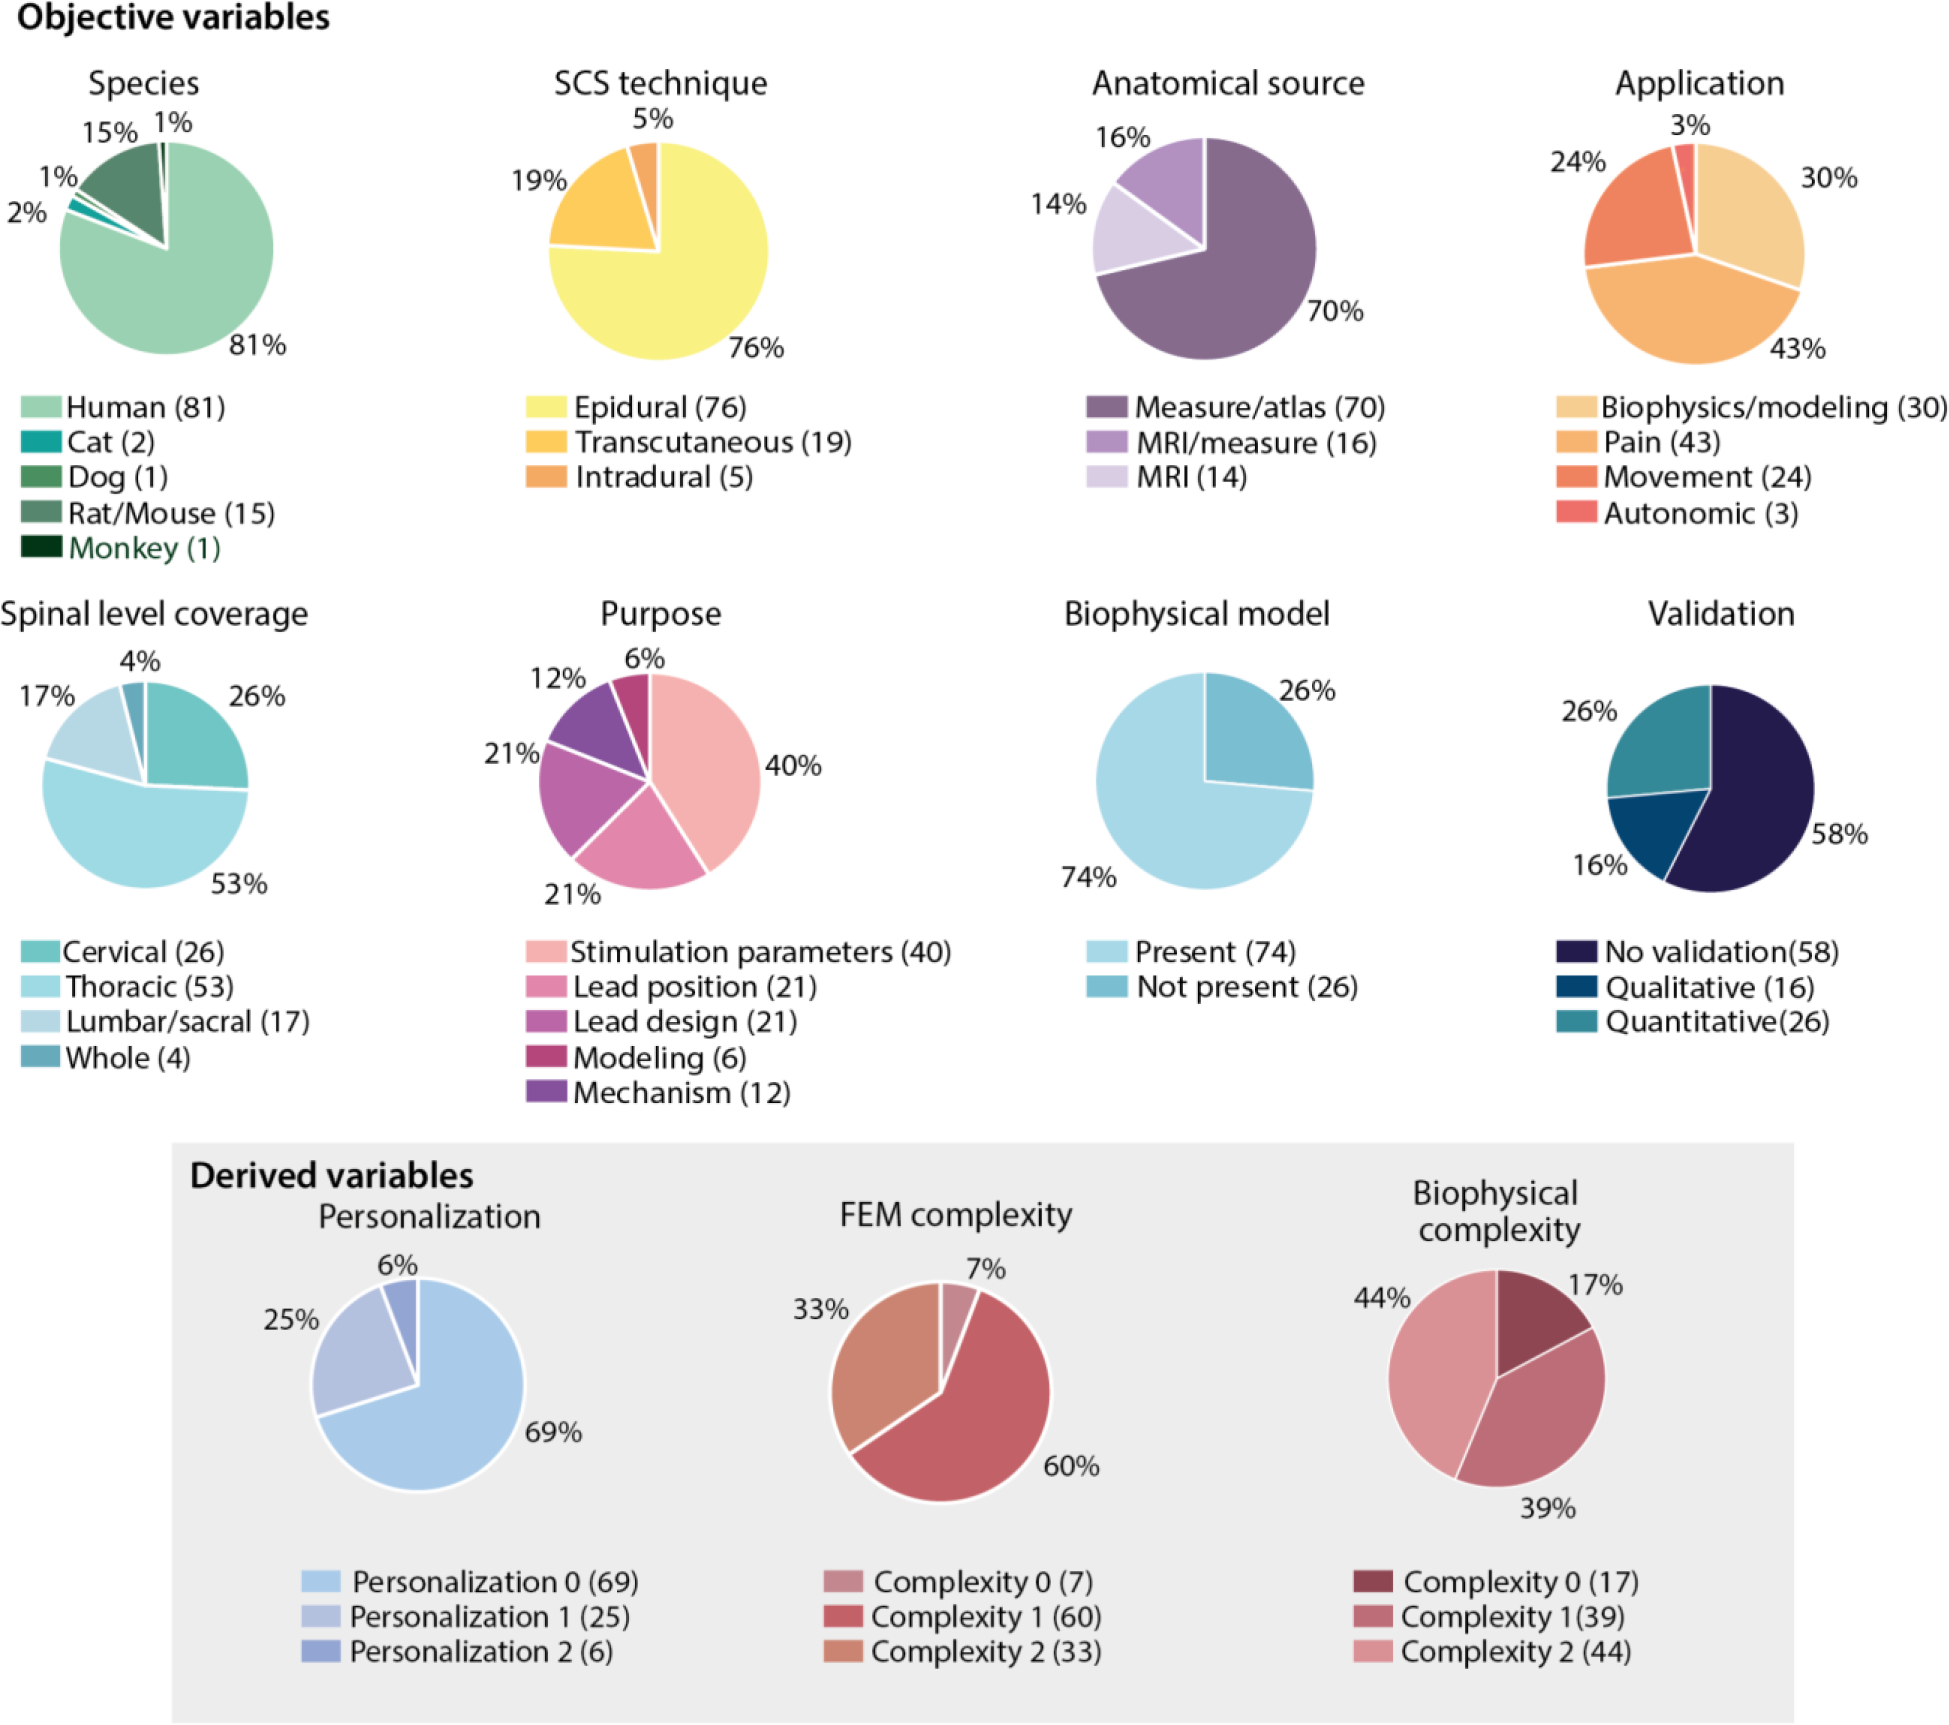
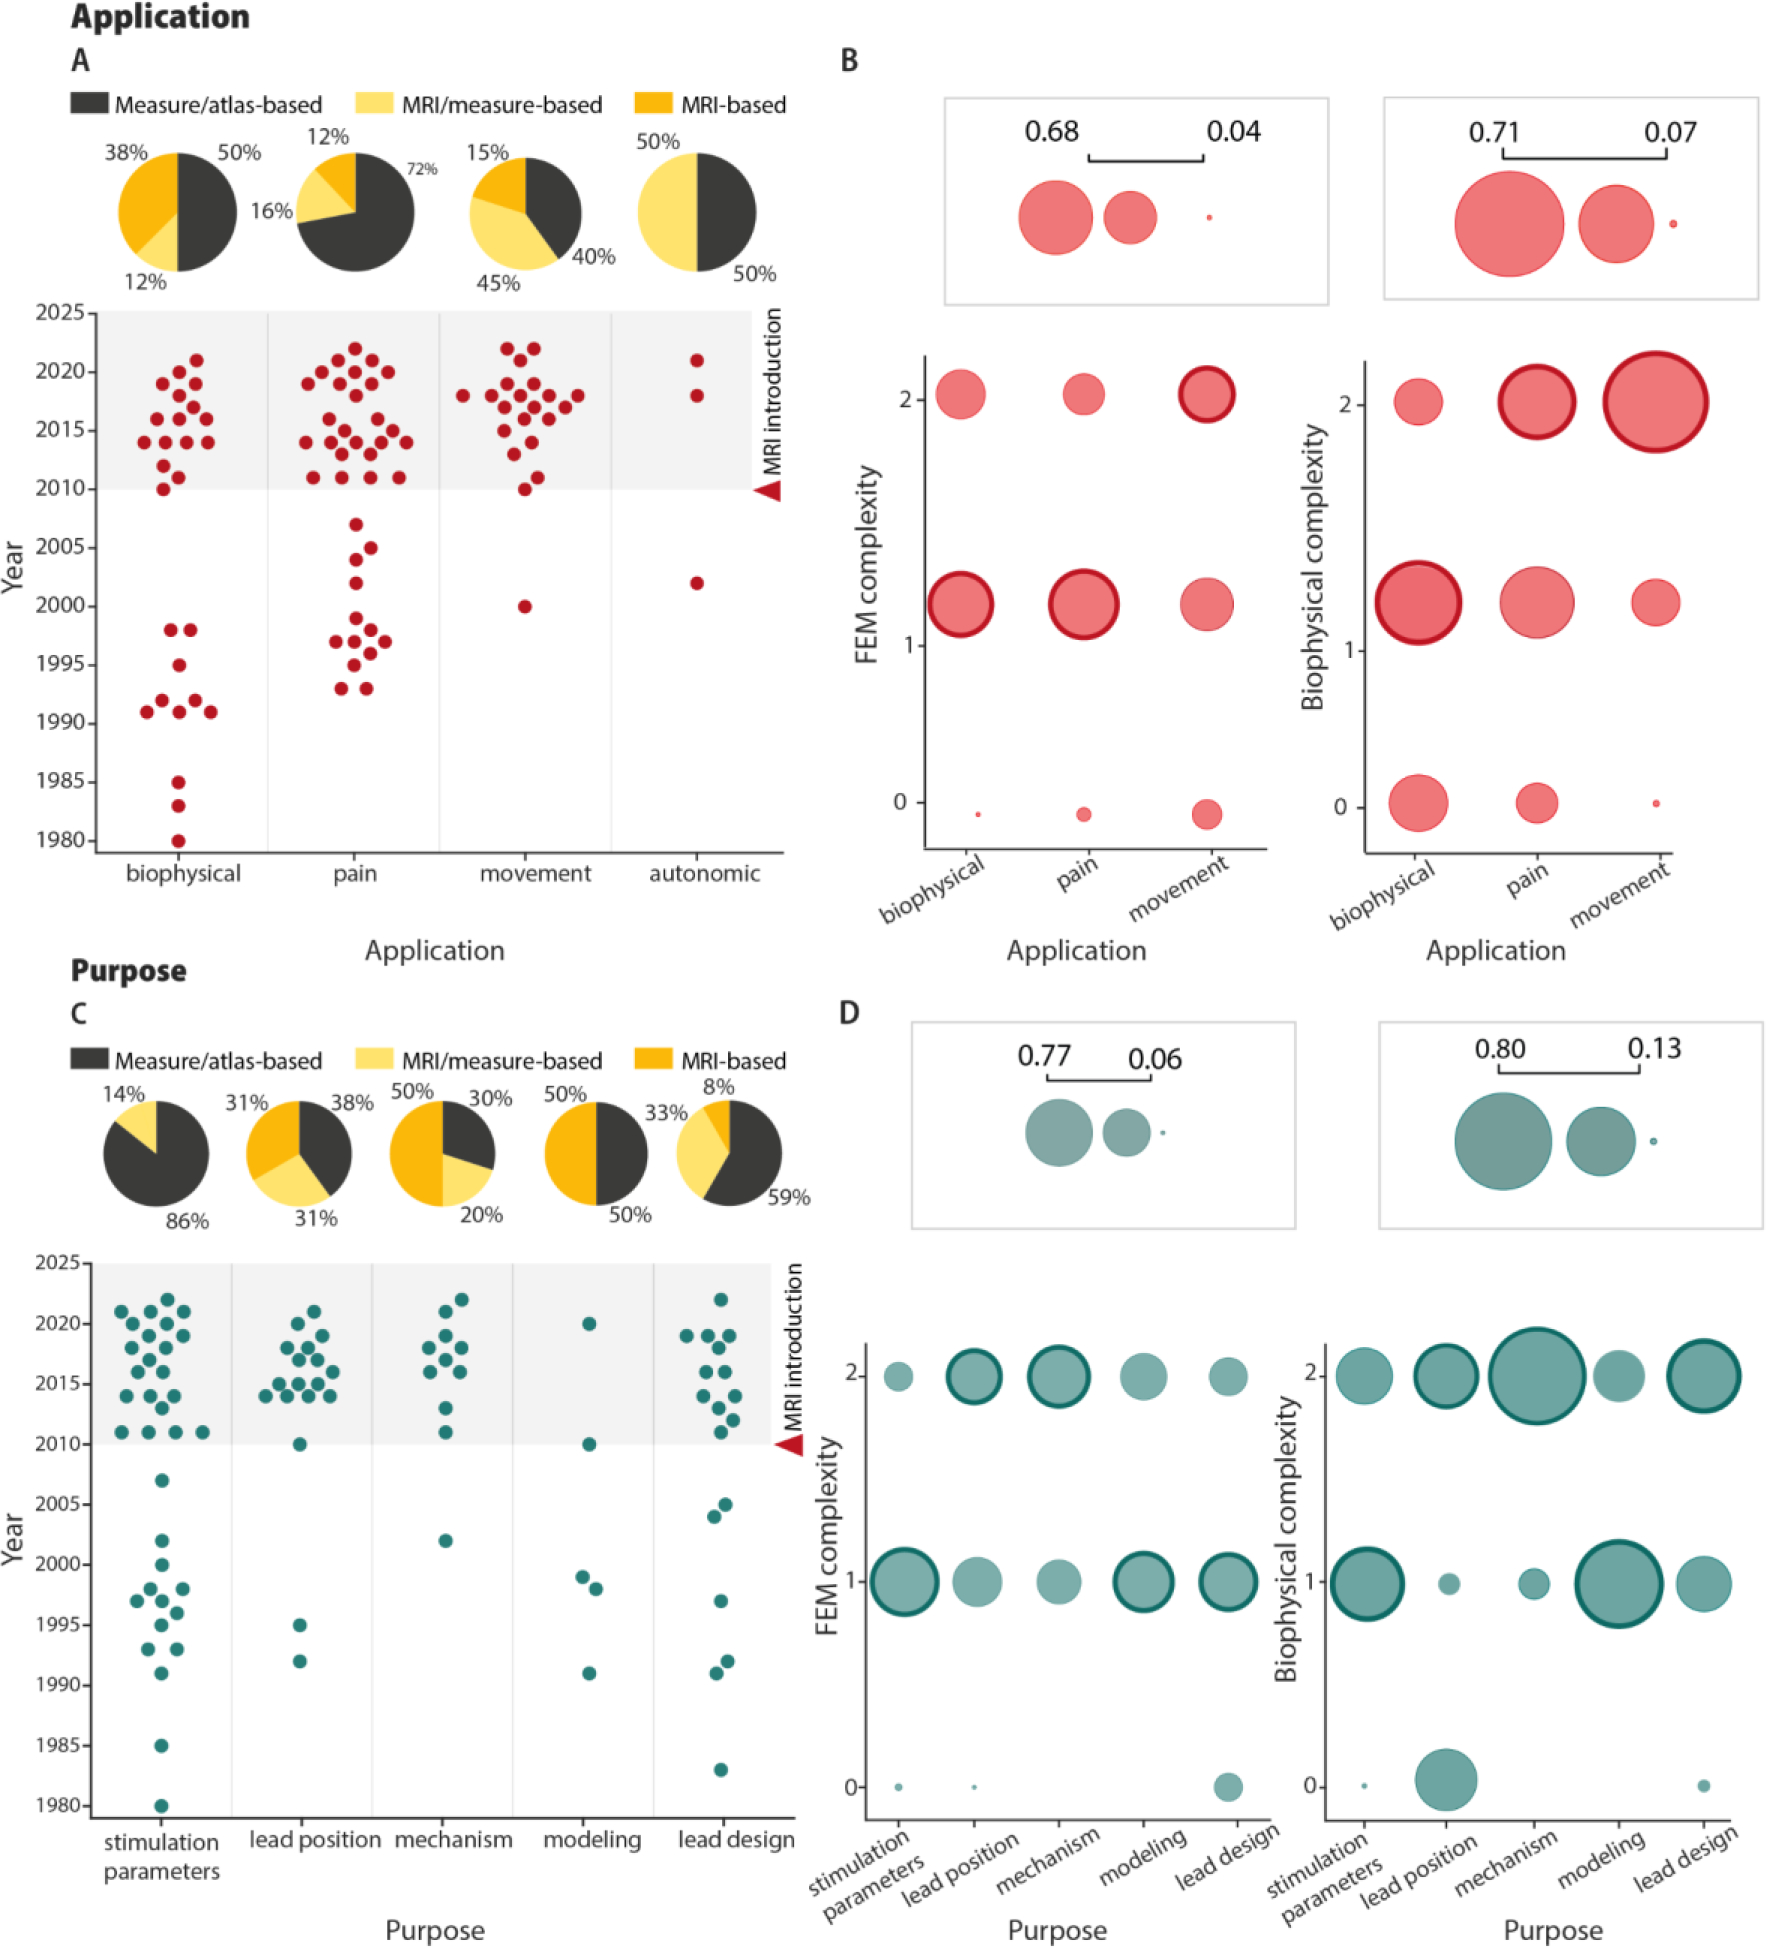
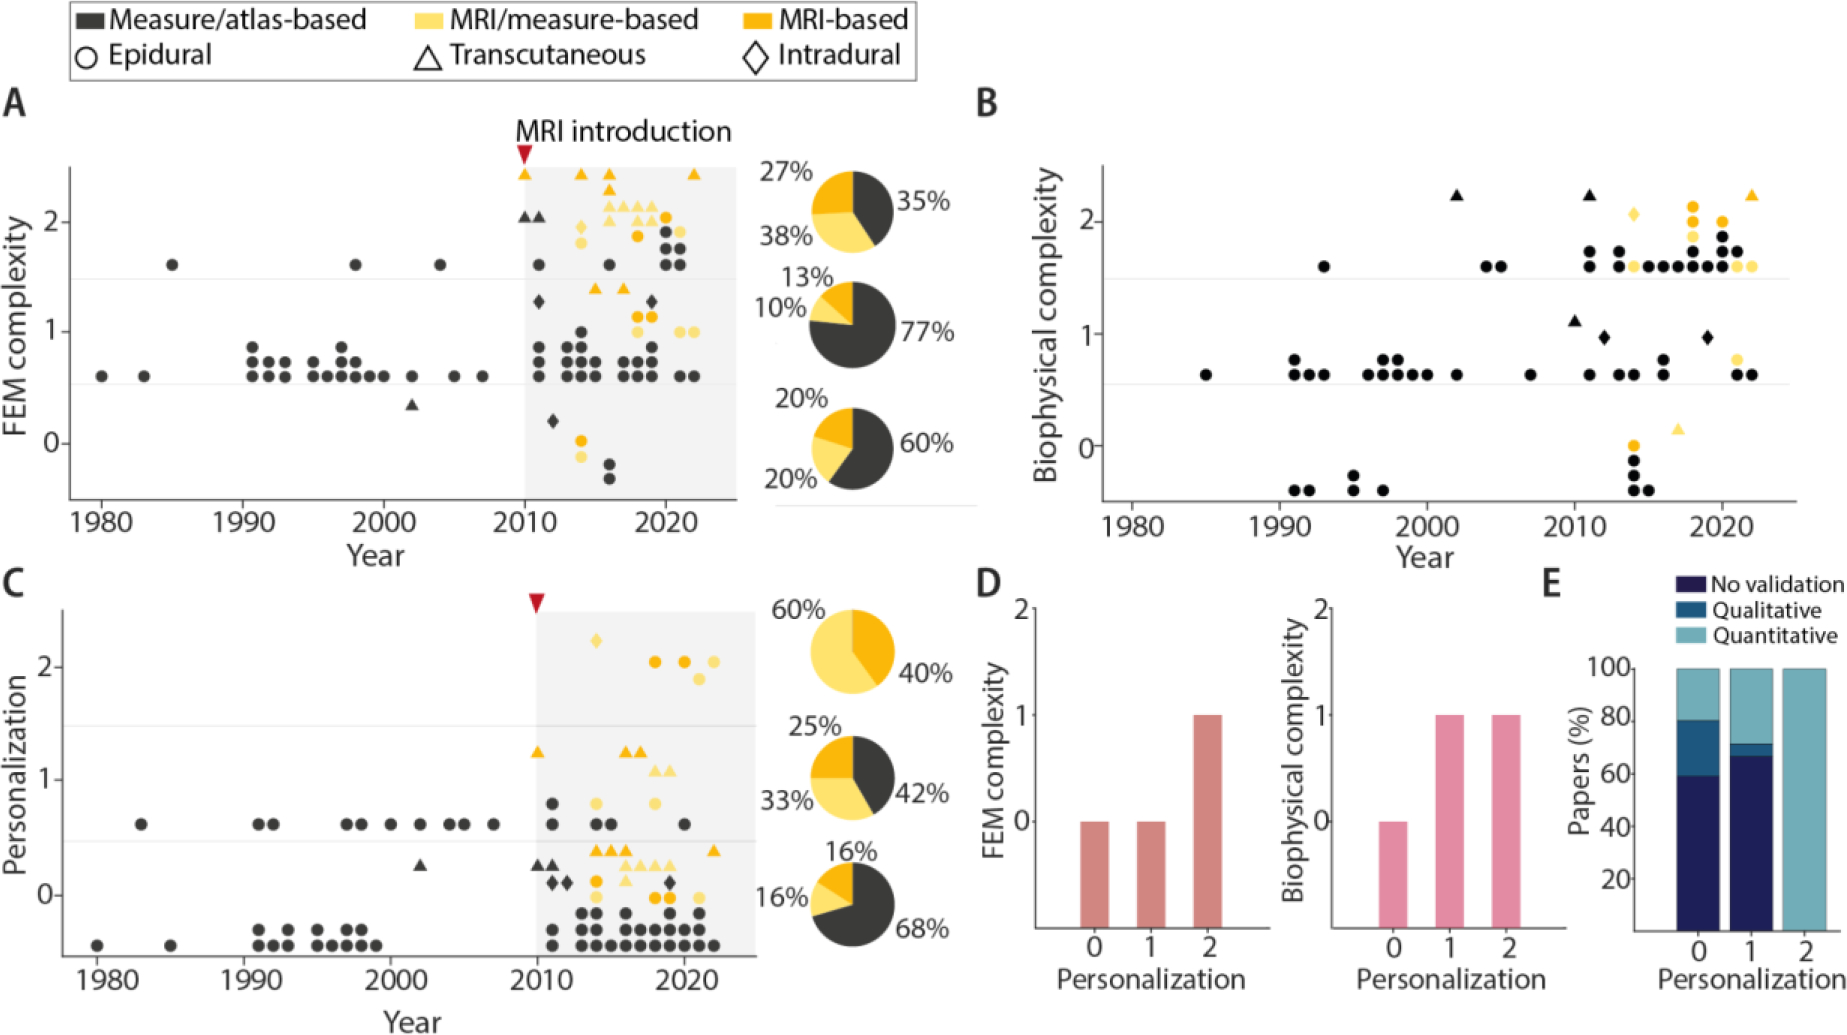
Seventy years ago, Hodgkin and Huxley published the first mathematical model to describe action potential generation, laying the foundation for modern computational neuroscience. Since then, the field has evolved enormously, with studies spanning from basic neuroscience to clinical applications for neuromodulation. Computer models of neuromodulation have evolved in complexity and personalization, advancing clinical practice and novel neurostimulation therapies, such as spinal cord stimulation. Spinal cord stimulation is a therapy widely used to treat chronic pain, with rapidly expanding indications, such as restoring motor function. In general, simulations contributed dramatically to improve lead designs, stimulation configurations, waveform parameters and programming procedures and provided insight into potential mechanisms of action of electrical stimulation. Although the implementation of neural models are relentlessly increasing in number and complexity, it is reasonable to ask whether this observed increase in complexity is necessary for improved accuracy and, ultimately, for clinical efficacy. With this aim, we performed a systematic literature review and a qualitative meta-synthesis of the evolution of computational models, with a focus on complexity, personalization and the use of medical imaging to capture realistic anatomy. Our review showed that increased model complexity and personalization improved both mechanistic and translational studies. More specifically, the use of medical imaging enabled the development of patient-specific models that can help to transform clinical practice in spinal cord stimulation. Finally, we combined our results to provide clear guidelines for standardization and expansion of computational models for spinal cord stimulation.
Keywords: chronic pain; computational models; computer simulation; electrical stimulation; medical imaging; movement restoration; personalization; spinal cord stimulation.
© 2022 The Authors. The Journal of Physiology © 2022 The Physiological Society.
Conflict of interest statement
Competing interests
MC is an inventor on several patents’ applications related to concepts presented in this work; SFL is an inventor on multiple patents related to concepts presented in this work, receives research support from Abbott Neuromodulation, Medtronic, plc, and Presidio Medical, Inc., is a shareholder in CereGate, Hologram Consultants, LLC, and Presidio Medical, Inc., and a member of the scientific advisory boards for Abbott Neuromodulation, CereGate, and Presidio Medical, Inc.
Figures
Similar articles
-
Implanted spinal neuromodulation interventions for chronic pain in adults.Cochrane Database Syst Rev. 2021 Dec 2;12(12):CD013756. doi: 10.1002/14651858.CD013756.pub2. Cochrane Database Syst Rev. 2021. PMID: 34854473 Free PMC article.
-
New method for neuromodulation against pain using minimally invasive electrodes outside the epidural space.Sci Rep. 2025 Jul 18;15(1):26131. doi: 10.1038/s41598-025-07750-8. Sci Rep. 2025. PMID: 40681525 Free PMC article.
-
Cost-effectiveness of using prognostic information to select women with breast cancer for adjuvant systemic therapy.Health Technol Assess. 2006 Sep;10(34):iii-iv, ix-xi, 1-204. doi: 10.3310/hta10340. Health Technol Assess. 2006. PMID: 16959170
-
EORTC guidelines for the use of erythropoietic proteins in anaemic patients with cancer: 2006 update.Eur J Cancer. 2007 Jan;43(2):258-70. doi: 10.1016/j.ejca.2006.10.014. Epub 2006 Dec 19. Eur J Cancer. 2007. PMID: 17182241
-
Assessing the comparative effects of interventions in COPD: a tutorial on network meta-analysis for clinicians.Respir Res. 2024 Dec 21;25(1):438. doi: 10.1186/s12931-024-03056-x. Respir Res. 2024. PMID: 39709425 Free PMC article. Review.
Cited by
-
Biophysics of Frequency-Dependent Variation in Paresthesia and Pain Relief during Spinal Cord Stimulation.J Neurosci. 2024 Jun 26;44(26):e2199232024. doi: 10.1523/JNEUROSCI.2199-23.2024. J Neurosci. 2024. PMID: 38744531 Free PMC article.
-
Quantification of porcine lower thoracic spinal cord morphology with intact dura mater using high-resolution μCT.J Neuroimaging. 2024 Nov-Dec;34(6):646-663. doi: 10.1111/jon.13239. Epub 2024 Oct 10. J Neuroimaging. 2024. PMID: 39390716
-
The ins and outs of spinal cord stimulation.Brain Commun. 2025 Jan 15;7(1):fcae416. doi: 10.1093/braincomms/fcae416. eCollection 2025. Brain Commun. 2025. PMID: 39816190 Free PMC article.
-
An optimization framework for targeted spinal cord stimulation.J Neural Eng. 2023 Sep 28;20(5):056026. doi: 10.1088/1741-2552/acf522. J Neural Eng. 2023. PMID: 37647885 Free PMC article.
-
Timing-dependent synergies between motor cortex and posterior spinal stimulation in humans.J Physiol. 2024 Jun;602(12):2961-2983. doi: 10.1113/JP286183. Epub 2024 May 17. J Physiol. 2024. PMID: 38758005 Free PMC article.
References
-
- Arle JE, Carlson KW, Mei L & Shils JL (2014). Modeling effects of scar on patterns of dorsal column stimulation. Neuromodulation Technol Neural Interface 17, 320–333. - PubMed
-
- Barola G, Singh-Sahni K, Staas WE Jr, Shatin D, Ketcik B & Allen K (1995). Epidural spinal cord stimulation in the management of spasms in spinal cord injury: a prospective study. Stereotact Funct Neurosurg 64, 153–164. - PubMed
-
- Barolat-Romana G, Myklebust JB, Hemmy DC, Myklebust B & Wenninger W (1985). Immediate effects of spinal cord stimulation in spinal spasticity. J Neurosurg 62, 558–562. - PubMed
-
- Bikson M, Truong DQ, Mourdoukoutas AP, Aboseria M, Khadka N, Adair D & Rahman A (2015). Modeling sequence and quasi-uniform assumption in computational neurostimulation. Prog Brain Res 222, 1–23. - PubMed
Publication types
MeSH terms
Grants and funding
LinkOut - more resources
Full Text Sources
Medical