

Markers of Kidney Function in Early Childhood and Association With Maternal Comorbidity
- PMID: 36409493
- PMCID: PMC9679880
- DOI: 10.1001/jamanetworkopen.2022.43146
Markers of Kidney Function in Early Childhood and Association With Maternal Comorbidity
Abstract
Importance: Kidney functional capacity is low at birth but doubles during the first 2 weeks of life and reaches near-adult levels at age 1 to 2 years. Existing reference intervals for markers of kidney function in newborns are mostly based on preterm newborns, newborns with illness, or small cohorts of term newborns, and the consequences of maternal comorbidities for newborn kidney function are sparsely described.
Objective: To establish robust reference intervals for creatinine and urea in healthy children in early childhood and to assess whether maternal comorbidity is associated with newborn creatinine and urea concentrations.
Design, setting, and participants: This multicenter, prospective, population-based cohort study assessed data and umbilical cord blood samples from participants in the Copenhagen Baby Heart Study (CBHS) who were born between April 1, 2016, and October 31, 2018, and venous blood samples from a subsample of CBHS participants who were enrolled in the COMPARE study between May 3, 2017, and November 4, 2018. Cord blood samples of 13 354 newborns from the CBHS and corresponding venous blood samples of 444 of those newborns from the COMPARE study were included. Blood samples were collected at birth, age 2 months, and age 14 to 16 months, with follow-up completed on February 12, 2020. Healthy nonadmitted term newborns from maternity wards at 3 hospitals in the Capital Region of Denmark were included.
Exposures: Maternal comorbidity.
Main outcomes and measures: Creatinine and urea concentrations.
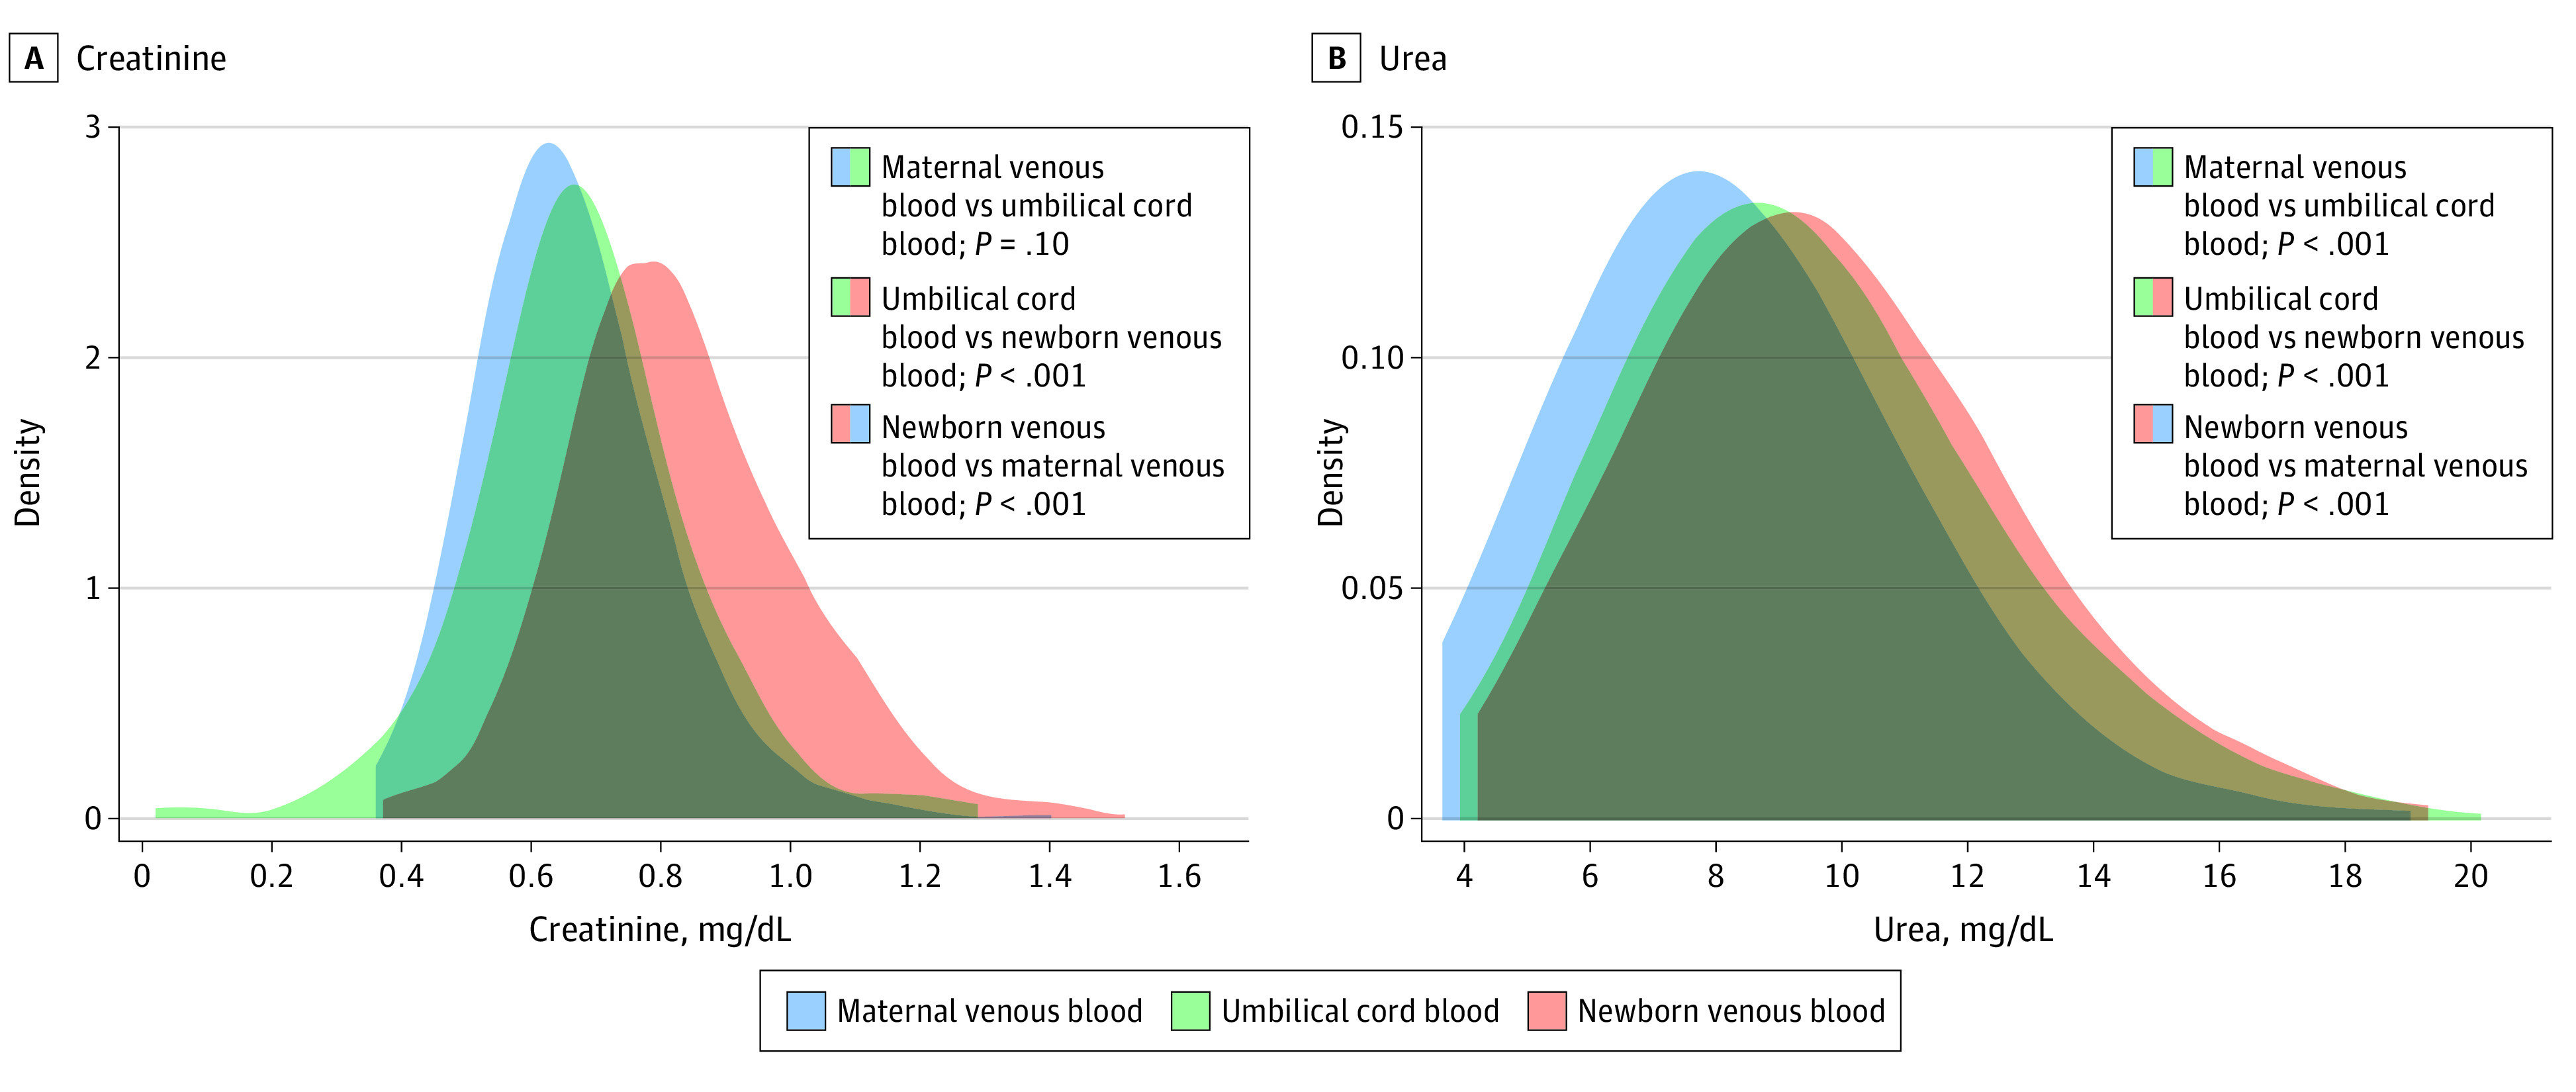
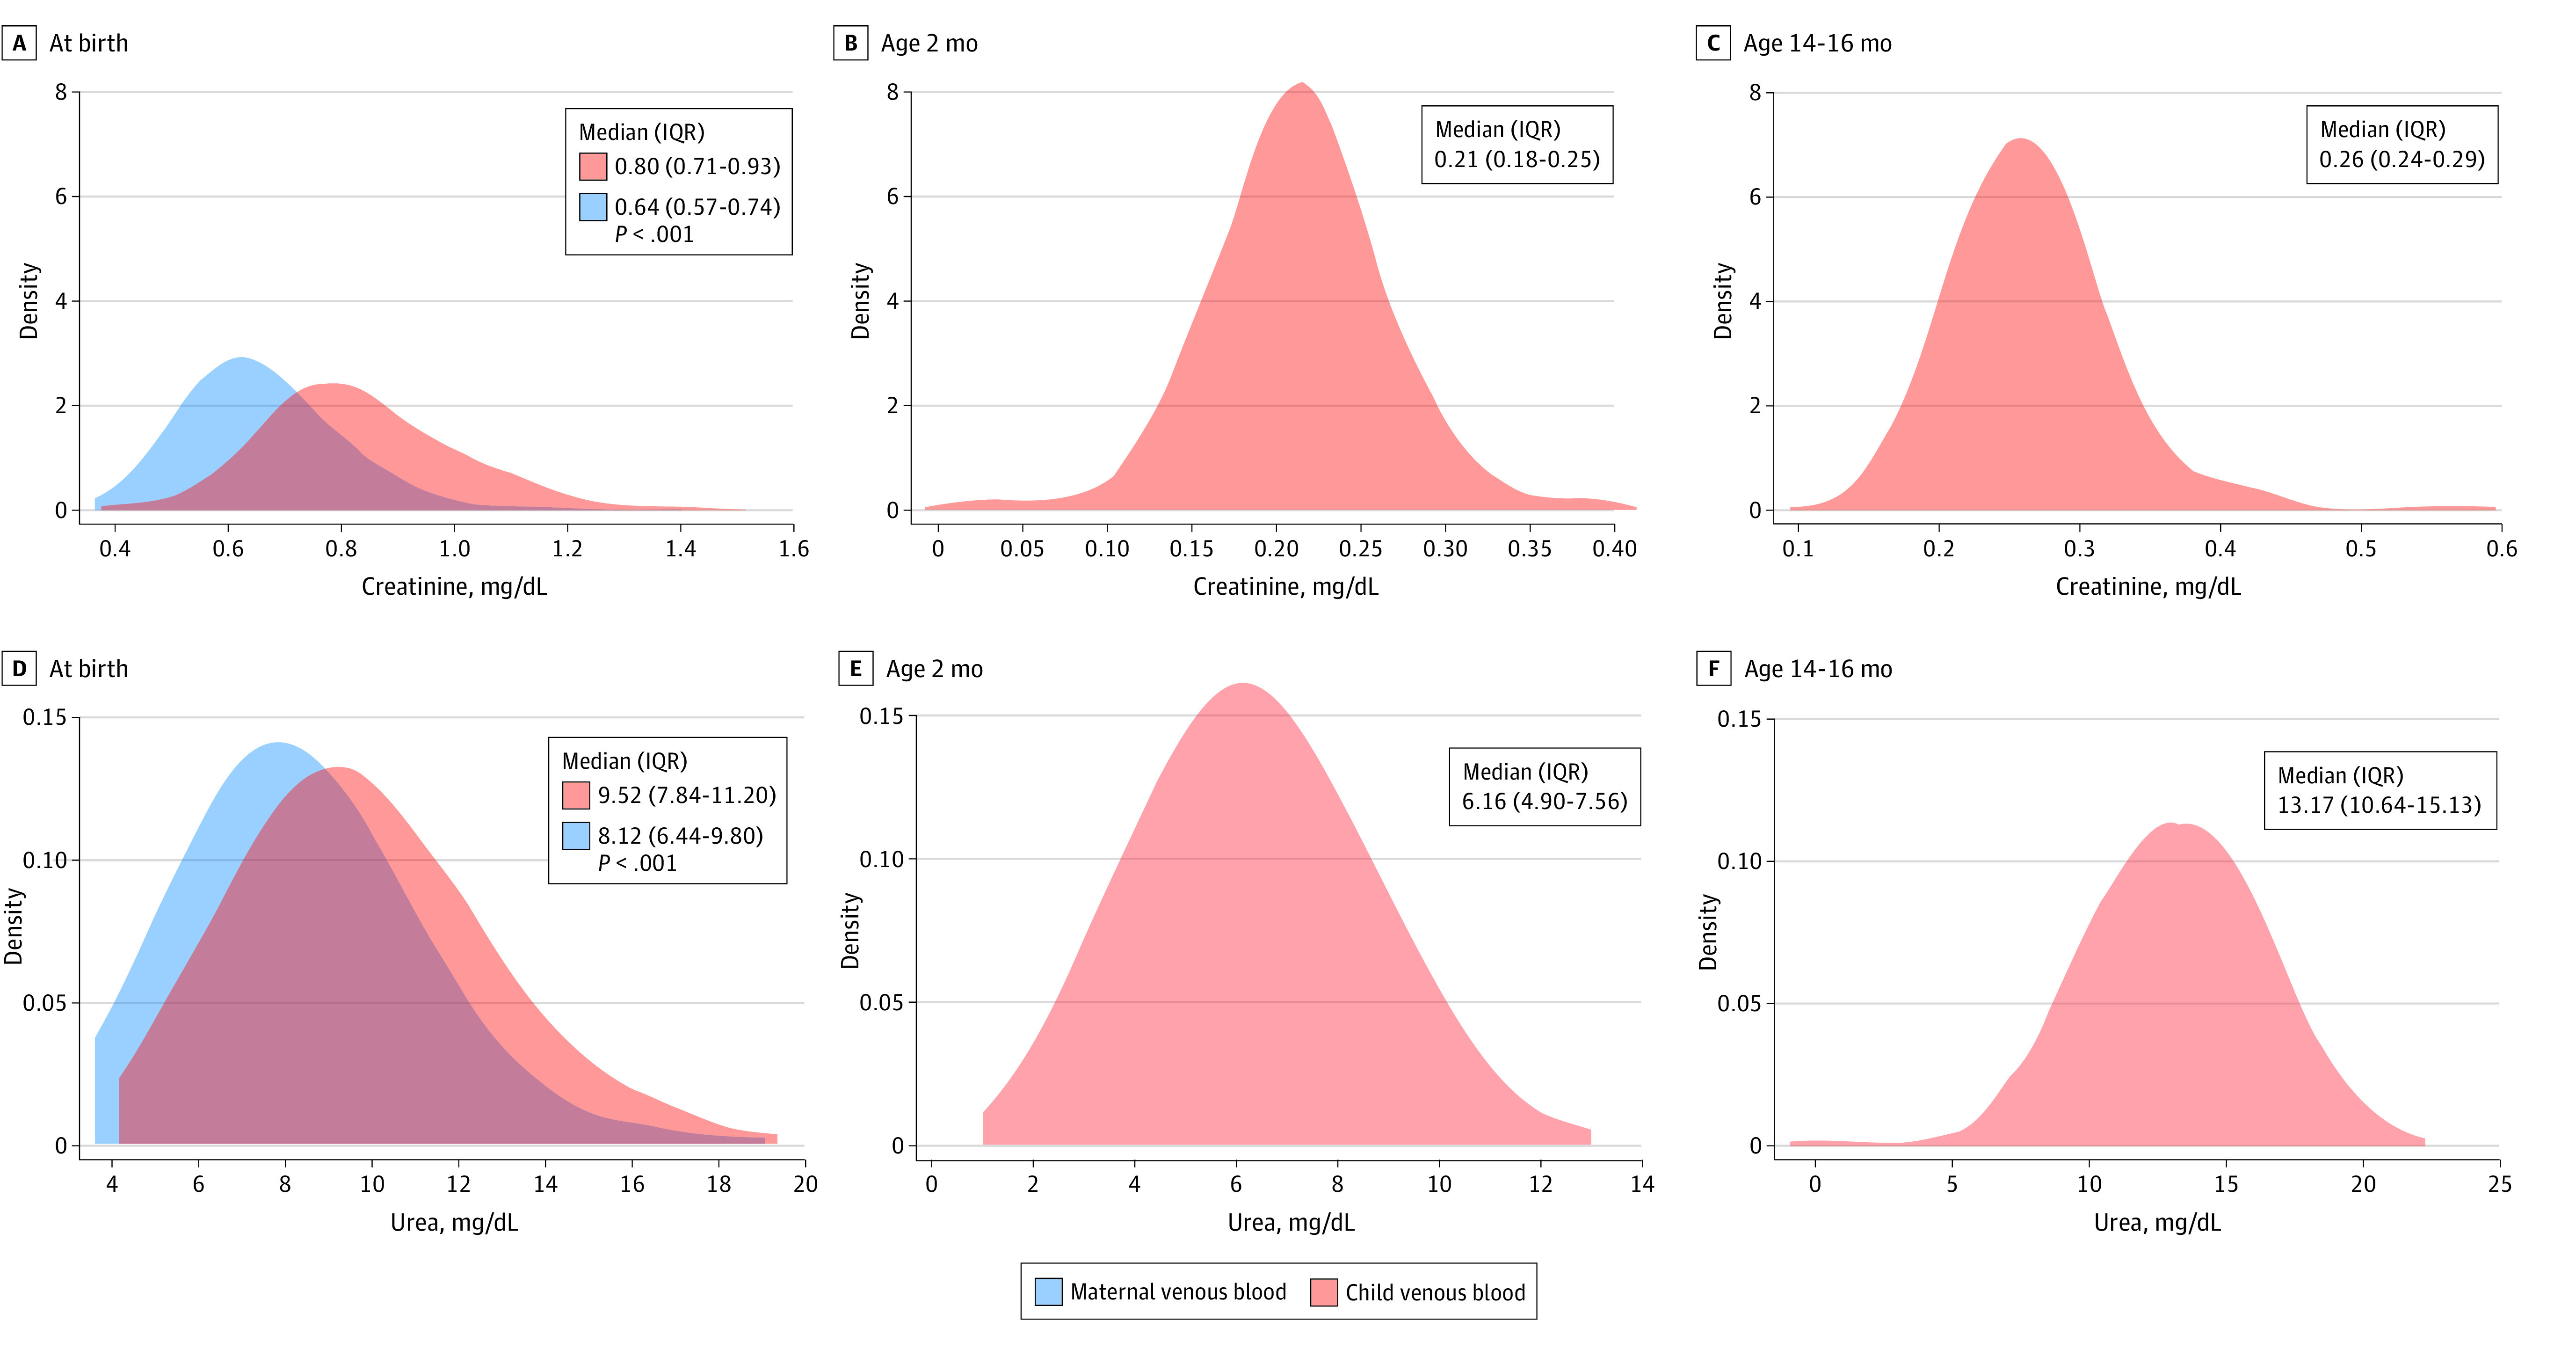
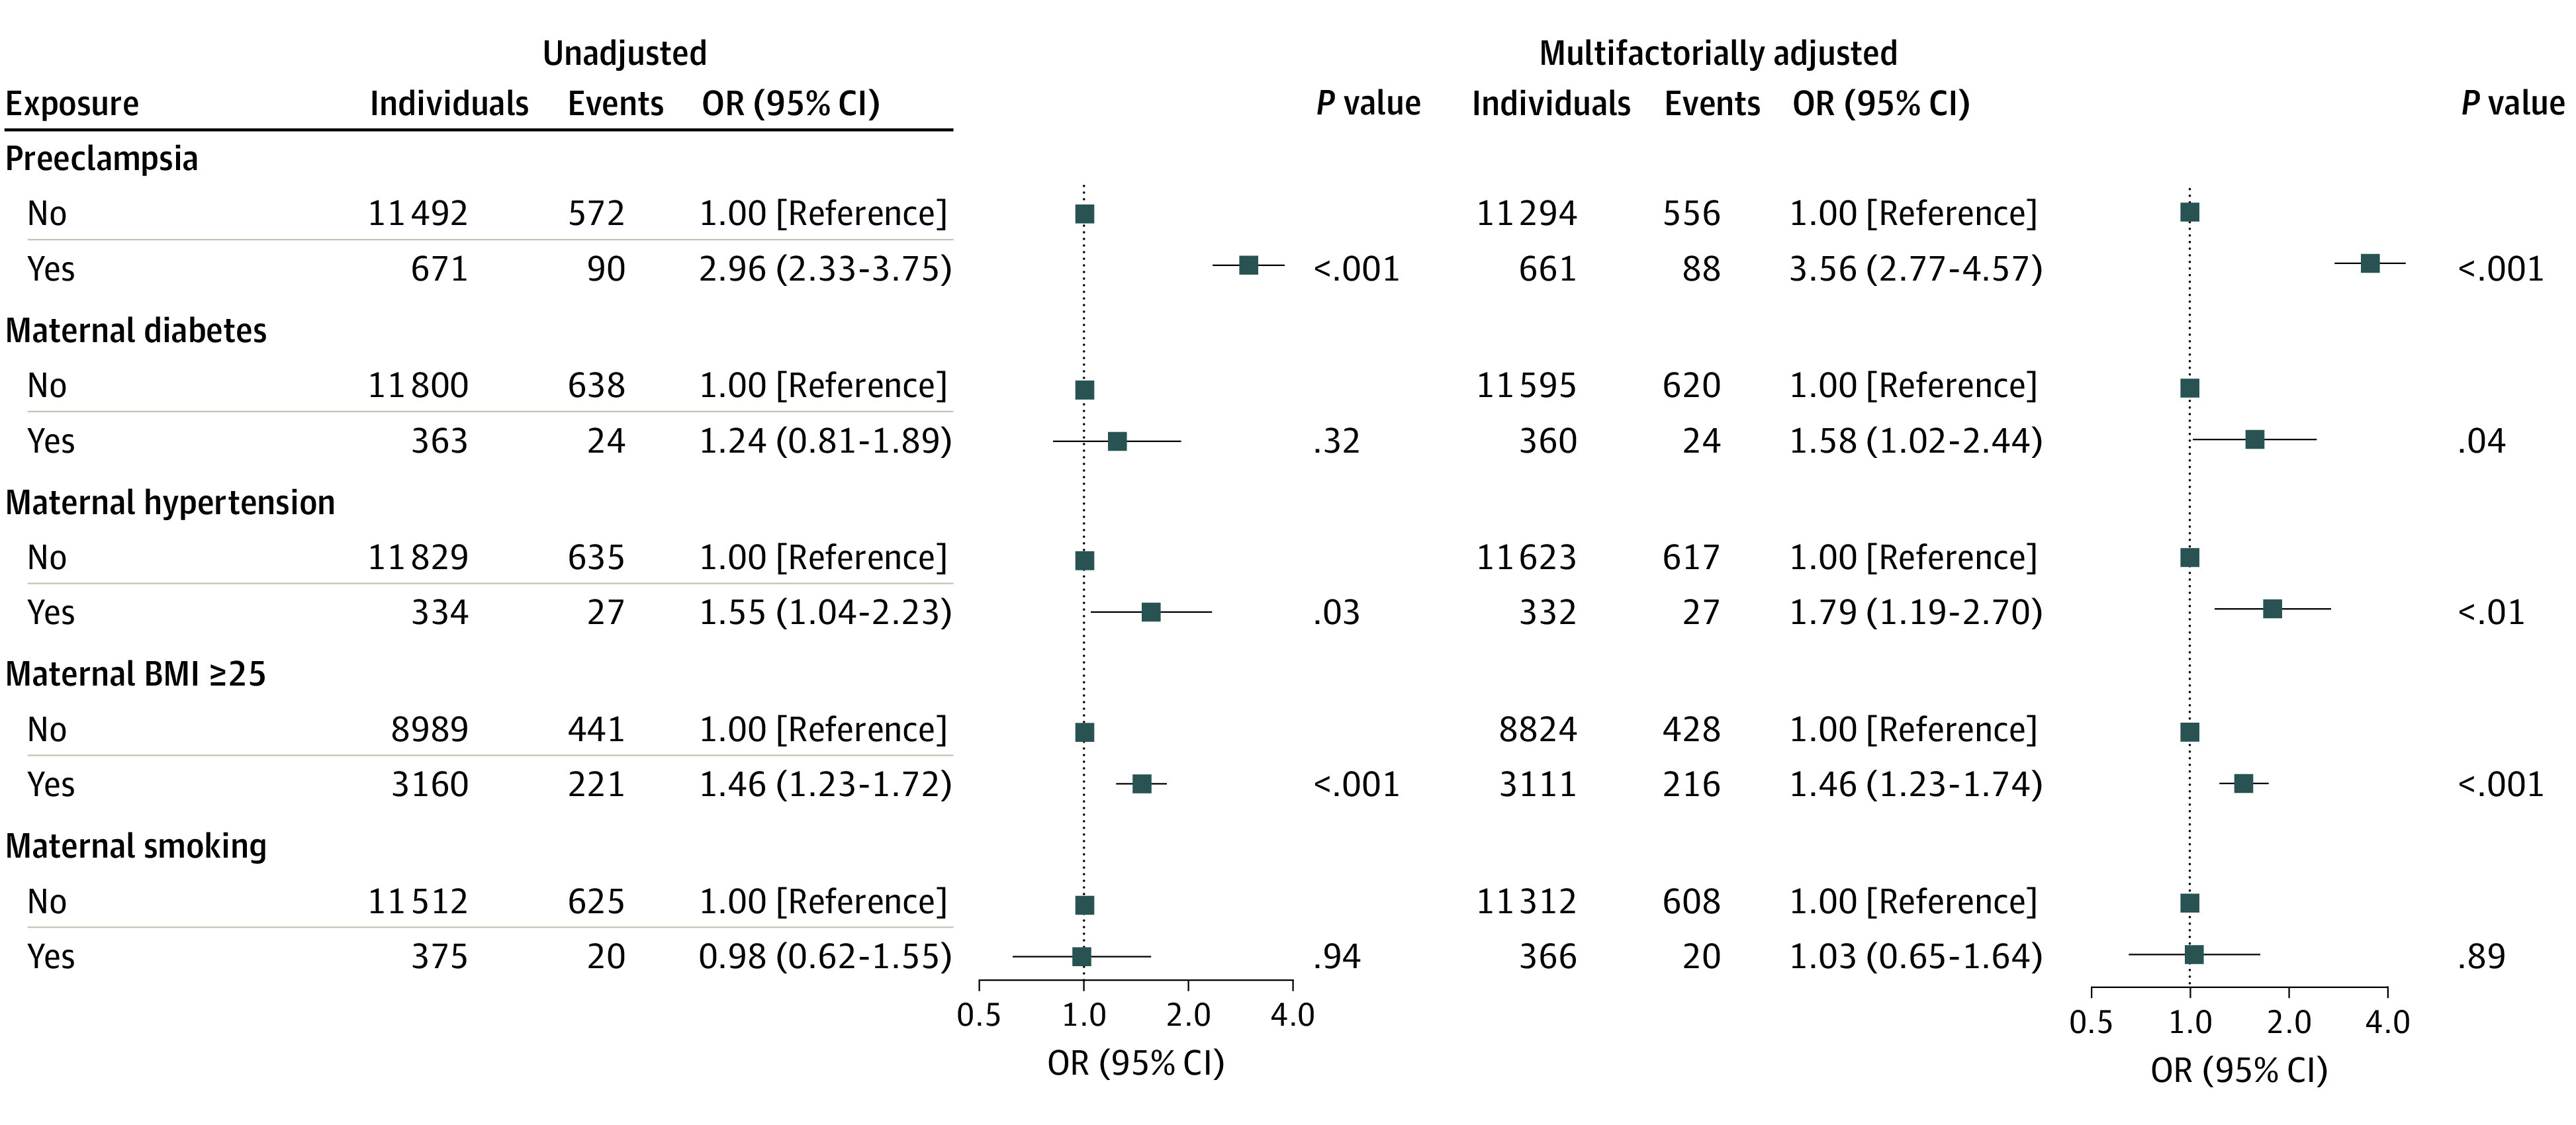
Results: Among 13 354 newborns in the CBHS cohort, characteristics of 12 938 children were stratified by sex and gestational age (GA). Of those, 6567 children (50.8%) were male; 5259 children (40.6%) were born at 37 to 39 weeks' GA, and 7679 children (59.4%) were born at 40 to 42 weeks' GA. Compared with children born at 40 to 42 weeks' GA, those born at 37 to 39 weeks' GA had lower birth weight, Apgar scores at 5 minutes, placental weight, and placental-fetal weight ratio. Children born at 37 to 39 weeks' GA vs those born at 40 to 42 weeks' GA were more frequently small for GA at birth and more likely to have placental insufficiency and exposure to maternal preeclampsia, maternal diabetes, maternal kidney disease, and maternal hypertension. Among children born at 37 to 39 weeks' GA, reference intervals were 0.54 to 1.08 mg/dL for creatinine and 5.32 to 14.67 mg/dL for urea; among children born at 40 to 42 weeks' GA, reference intervals were 0.57 to 1.19 mg/dL for creatinine and 5.60 to 14.85 mg/dL for urea. At birth, multifactorially adjusted odds ratios among children exposed to preeclampsia were 9.40 (95% CI, 1.68-52.54) for a venous creatinine concentration higher than the upper reference limit, 4.29 (95% CI, 1.32-13.93) for a venous creatinine concentration higher than the 90th percentile, and 3.10 (95% CI, 1.14-8.46) for a venous creatinine concentration higher than the 80th percentile.
Conclusions and relevance: In this study, improved reference intervals for creatinine and urea concentrations were generated. Preeclampsia was associated with an increased risk of high newborn creatinine concentrations, suggesting that newborns of mothers with preeclampsia need closer observation of their kidney function.
Conflict of interest statement
Figures
Similar articles
-
Associations of Cord Blood Vitamin D and Preeclampsia With Offspring Blood Pressure in Childhood and Adolescence.JAMA Netw Open. 2020 Oct 1;3(10):e2019046. doi: 10.1001/jamanetworkopen.2020.19046. JAMA Netw Open. 2020. PMID: 33017029 Free PMC article.
-
School Readiness Among Children Born Preterm in Manitoba, Canada.JAMA Pediatr. 2022 Oct 1;176(10):1010-1019. doi: 10.1001/jamapediatrics.2022.2758. JAMA Pediatr. 2022. PMID: 35939291 Free PMC article.
-
Association among prematurity (<30 weeks' gestational age), blood pressure, urinary albumin, calcium, and phosphate in early childhood.Pediatr Nephrol. 2017 Jul;32(7):1243-1250. doi: 10.1007/s00467-017-3581-z. Epub 2017 Apr 8. Pediatr Nephrol. 2017. PMID: 28391546
-
Calcium supplementation commencing before or early in pregnancy, for preventing hypertensive disorders of pregnancy.Cochrane Database Syst Rev. 2019 Sep 16;9(9):CD011192. doi: 10.1002/14651858.CD011192.pub3. Cochrane Database Syst Rev. 2019. PMID: 31523806 Free PMC article.
-
Clinical Features and Management of Lung Cancer During Pregnancy: A Narrative Review Based on Reported Cases.Womens Health Rep (New Rochelle). 2023 Nov 17;4(1):544-550. doi: 10.1089/whr.2023.0085. eCollection 2023. Womens Health Rep (New Rochelle). 2023. PMID: 38023372 Free PMC article. Review.
Cited by
-
The Prognostic Value of Serum Creatinine Dynamics in Neonates-A Retrospective Cohort Study.J Clin Med. 2024 Dec 9;13(23):7485. doi: 10.3390/jcm13237485. J Clin Med. 2024. PMID: 39685941 Free PMC article.
-
Chronic kidney disease in children: an update.Clin Kidney J. 2023 Apr 24;16(10):1600-1611. doi: 10.1093/ckj/sfad097. eCollection 2023 Oct. Clin Kidney J. 2023. PMID: 37779846 Free PMC article. Review.
-
Swiss Consensus on Prenatal and Early Postnatal Urinary Tract Dilation: Practical Approach and When to Refer.Children (Basel). 2024 Dec 23;11(12):1561. doi: 10.3390/children11121561. Children (Basel). 2024. PMID: 39767990 Free PMC article. Review.
-
1H NMR Urinary Metabolomics Profiling of Newborns with Congenital Human Cytomegalovirus Infection: Insights into Metabolic Alterations.J Proteome Res. 2025 Apr 4;24(4):2112-2120. doi: 10.1021/acs.jproteome.5c00017. Epub 2025 Mar 25. J Proteome Res. 2025. PMID: 40129280 Free PMC article.
-
External evaluation of neonatal vancomycin population pharmacokinetic models: Moving from first-order equations to Bayesian-guided therapeutic monitoring.Pharmacotherapy. 2024 Dec;44(12):907-919. doi: 10.1002/phar.4623. Epub 2024 Nov 15. Pharmacotherapy. 2024. PMID: 39544156 Free PMC article.
References
-
- Hoseini R, Otukesh H, Rahimzadeh N, Hoseini S. Glomerular function in neonates. Iran J Kidney Dis. 2012;6(3):166-172. - PubMed
Publication types
MeSH terms
Substances
LinkOut - more resources
Full Text Sources
Miscellaneous
