

Resting-state electroencephalography and magnetoencephalography as biomarkers of chronic pain: a systematic review
- PMID: 36409624
- PMCID: PMC10184564
- DOI: 10.1097/j.pain.0000000000002825
Resting-state electroencephalography and magnetoencephalography as biomarkers of chronic pain: a systematic review
Abstract
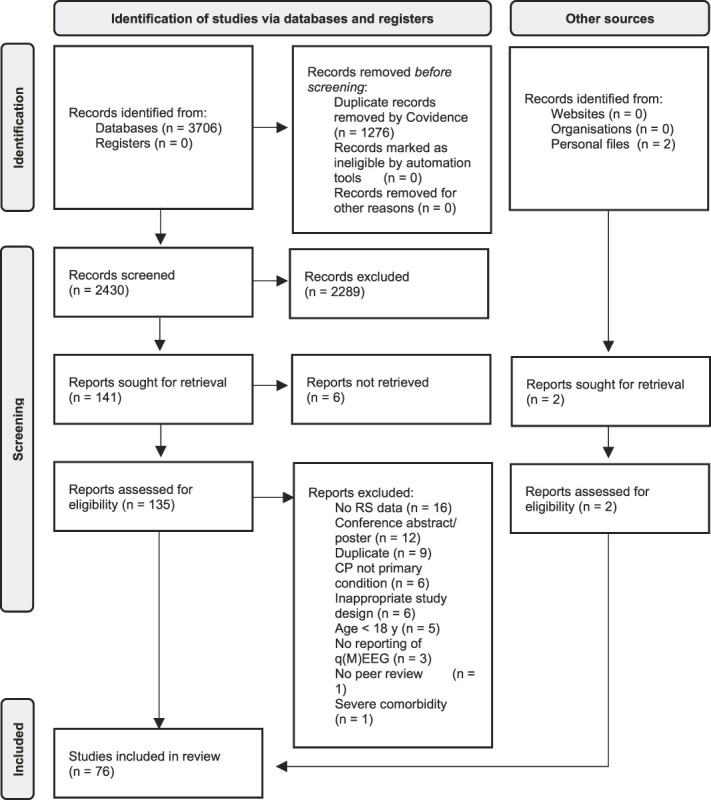
Reliable and objective biomarkers promise to improve the assessment and treatment of chronic pain. Resting-state electroencephalography (EEG) is broadly available, easy to use, and cost efficient and, therefore, appealing as a potential biomarker of chronic pain. However, results of EEG studies are heterogeneous. Therefore, we conducted a systematic review (PROSPERO CRD42021272622) of quantitative resting-state EEG and magnetoencephalography (MEG) studies in adult patients with different types of chronic pain. We excluded populations with severe psychiatric or neurologic comorbidity. Risk of bias was assessed using a modified Newcastle-Ottawa Scale. Semiquantitative data synthesis was conducted using modified albatross plots. We included 76 studies after searching MEDLINE, Web of Science Core Collection, Cochrane Central Register of Controlled Trials, and EMBASE. For cross-sectional studies that can serve to develop diagnostic biomarkers, we found higher theta and beta power in patients with chronic pain than in healthy participants. For longitudinal studies, which can yield monitoring and/or predictive biomarkers, we found no clear associations of pain relief with M/EEG measures. Similarly, descriptive studies that can yield diagnostic or monitoring biomarkers showed no clear correlations of pain intensity with M/EEG measures. Risk of bias was high in many studies and domains. Together, this systematic review synthesizes evidence on how resting-state M/EEG might serve as a diagnostic biomarker of chronic pain. Beyond, this review might help to guide future M/EEG studies on the development of pain biomarkers.
Copyright © 2023 The Author(s). Published by Wolters Kluwer Health, Inc. on behalf of the International Association for the Study of Pain.
Conflict of interest statement
The authors have no conflict of interest to declare.
Figures


Similar articles
-
Resting-state EEG and MEG biomarkers of pathological fatigue - A transdiagnostic systematic review.Neuroimage Clin. 2023;39:103500. doi: 10.1016/j.nicl.2023.103500. Epub 2023 Aug 18. Neuroimage Clin. 2023. PMID: 37632989 Free PMC article.
-
Electroencephalography, Magnetoencephalography, and Cognitive Reserve: A Systematic Review.Arch Clin Neuropsychol. 2021 Oct 13;36(7):1374-1391. doi: 10.1093/arclin/acaa132. Arch Clin Neuropsychol. 2021. PMID: 33522563 Free PMC article.
-
Reliability of Magnetoencephalography and High-Density Electroencephalography Resting-State Functional Connectivity Metrics.Brain Connect. 2019 Sep;9(7):539-553. doi: 10.1089/brain.2019.0662. Epub 2019 Jun 26. Brain Connect. 2019. PMID: 31115272
-
A Review of Effects of Spinal Cord Stimulation on Spectral Features in Resting-State Electroencephalography.Neuromodulation. 2023 Jan;26(1):35-42. doi: 10.1016/j.neurom.2022.04.036. Epub 2022 May 10. Neuromodulation. 2023. PMID: 35551867 Review.
-
Effects of centrally acting analgesics on resting-state electroencephalography biomarker candidates of chronic pain.J Pain. 2025 Mar;28:104788. doi: 10.1016/j.jpain.2025.104788. Epub 2025 Jan 17. J Pain. 2025. PMID: 39828070
Cited by
-
Current source density and functional connectivity extracted from resting-state electroencephalography as biomarkers for chronic low back pain.Pain Rep. 2025 Jan 13;10(1):e1233. doi: 10.1097/PR9.0000000000001233. eCollection 2025 Feb. Pain Rep. 2025. PMID: 39816905 Free PMC article.
-
A novel theta-controlled vibrotactile brain-computer interface to treat chronic pain: a pilot study.Sci Rep. 2024 Feb 10;14(1):3433. doi: 10.1038/s41598-024-53261-3. Sci Rep. 2024. PMID: 38341457 Free PMC article.
-
Innovations in acute and chronic pain biomarkers: enhancing diagnosis and personalized therapy.Reg Anesth Pain Med. 2025 Feb 5;50(2):110-120. doi: 10.1136/rapm-2024-106030. Reg Anesth Pain Med. 2025. PMID: 39909549 Free PMC article. Review.
-
Distinct resting state neural activity in chronic pain patients who respond to transcranial electric stimulation for pain relief.Front Hum Neurosci. 2025 Jul 15;19:1546414. doi: 10.3389/fnhum.2025.1546414. eCollection 2025. Front Hum Neurosci. 2025. PMID: 40735279 Free PMC article.
-
A Scoping Review of the Effect of EEG Neurofeedback on Pain Complaints in Adults with Chronic Pain.J Clin Med. 2024 May 10;13(10):2813. doi: 10.3390/jcm13102813. J Clin Med. 2024. PMID: 38792353 Free PMC article.
References
-
- Ahn S, Prim JH, Alexander ML, McCulloch KL, Fröhlich F. Identifying and engaging neuronal oscillations by transcranial alternating current stimulation in patients with chronic low back pain: a randomized, crossover, double-blind, sham-controlled pilot study. J Pain 2019;20:277.e1–e11. - PMC - PubMed
-
- Arns M, Gunkelman J, Breteler M, Spronk D. EEG phenotypes predict treatment outcome to stimulants in children with ADHD. J Integr Neurosci 2008;7:421–38. - PubMed
-
- Arns M, Drinkenburg WH, Fitzgerald PB, Kenemans JL. Neurophysiological predictors of non-response to rTMS in depression. Brain Stimul 2012;5:569–76. - PubMed
-
- Aurlien H, Gjerde IO, Aarseth JH, Eldoen G, Karlsen B, Skeidsvoll H, Gilhus NE. EEG background activity described by a large computerized database. Clin Neurophysiol 2004;115:665–73. - PubMed
Publication types
MeSH terms
Substances
LinkOut - more resources
Full Text Sources
Medical
