. 2024 Jun;239(6):e30916.
doi: 10.1002/jcp.30916. Epub 2022 Nov 21.

Gender differences in Alzheimer's may be associated with TLR4-LYN expression in damage associated microglia and neuronal phagocytosis

Affiliations

Gender differences in Alzheimer's may be associated with TLR4-LYN expression in damage associated microglia and neuronal phagocytosis

Rezwanul Islam et al. J Cell Physiol. 2024 Jun.

Abstract

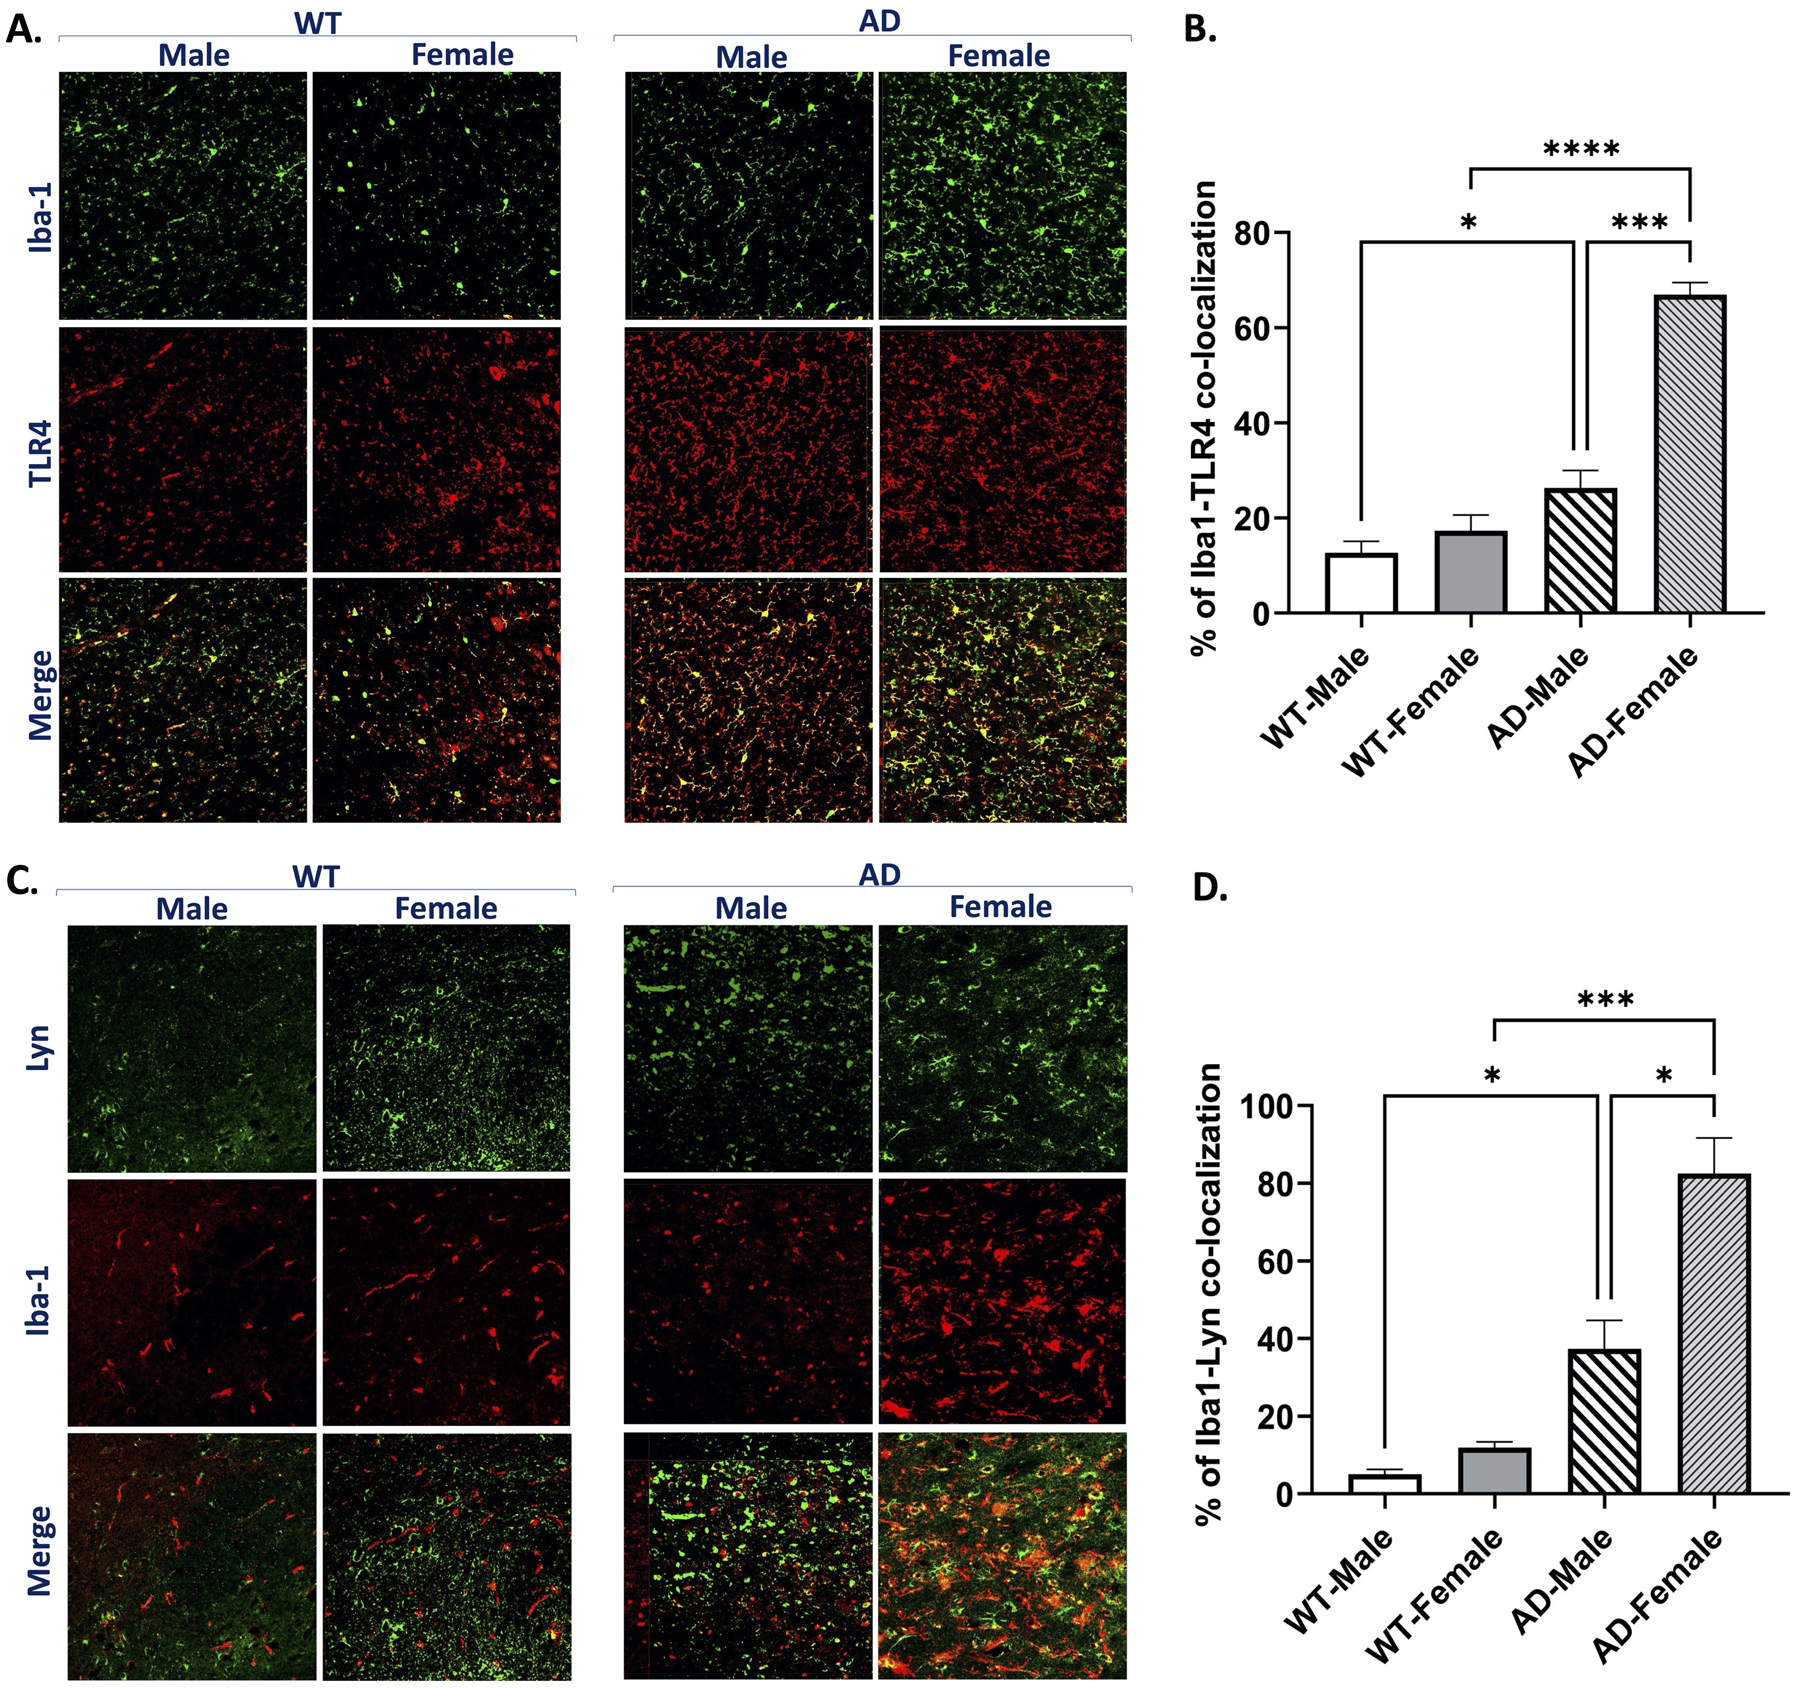
The role of Aβ plaques and neurofibrillary tangles in Alzheimer's disease (AD) pathogenesis have recently come into question due to failure of many pharmaceutical agents targeting these deposits and detection of these misfolded proteins in normal human brains. Therefore, we investigated correlations between microglial activation and toll like receptor 4 (TLR4) and Lck/Yes novel tyrosine (LYN) kinase signaling in an AD mouse model. In this study, we used 5-6-month-old 5XFAD and wild type (WT) male and female mice. Immunohistochemistry (IHC) and flow cytometry (FC) were performed on their brains. Cognitive performance was assessed with the Barnes-Maze. IHC showed more Ab aggregation in microglia of female 5XFAD mice compared to their male counterparts. Increased co-localization of microglial TLR4 and LYN was also observed in AD more than WT and females more than males. IHC also suggests microglial phagocytosis of neurons in AD mice, which is supported by FC data. Our FC data also support the involvement of disease associated microglia (DAMs) in this process based on cytokine secretion. Cognitive assessment by the Barnes maze showed 5XFAD females performed worse than males. In this study, we investigated the relationship between microglial TLR4 and LYN kinase in 5XFAD male and females. Our data reveals a correlation between microglial TLR4 and LYN co-localization and AD pathogenesis, more in females than males. Targeting microglial TLR4 and Lyn in DAMs may offer new therapeutic opportunities in the treatment of AD.

Keywords: Alzheimer's; LYN‐kinase; cognitive dysfunction; disease associated microglia; phagocytosis; toll like receptor‐4.


Conflict of interest statement

Conflict of interest

The authors declare no conflict of interests.

Figures

Figure 1.
Figure 1.
Binding of amyloid beta to microglia. (A) Representative confocal image of Iba-1/microglia- Aβ co-localization of each experimental group. All images were taken adjacent to the cortex, which can be visualized by merged image at the bottom right tile. Each color represents the following: green = Iba1/microglia; red = Aβ; yellow = overlap of green and red/co-localization of microglia and Aβ. All scale bars = 20 μm. (B) The percent co-localization was obtained by dividing the total number of yellow-positive cells. Statistical analysis was done by one-way ANOVA P < 0.05; *P < 0.05; n=4 per group.
Figure 2.
Figure 2.
Microglia-TLR4-LYN co-localization-Confocal z-stacked images were taken on WT and 5XFAD mice. (A) Representative confocal image of Iba1/microglia- TLR4 co-localization of each experimental group. All images were taken adjacent to the cortex, which can be visualized by merged image at the bottom right tile. Each color represents the following: green = Iba1/microglia; red = TLR4; yellow = overlap of green and red/co-localization of microglia and TLR4. All scale bars = 20 μm. (B) The percent of co-localization was obtained by dividing the number of yellow-positive cells by the total number of DAPI-positive cells. Statistical analysis was done by one-way ANOVA P < 0.05; *P < 0.05; n=4 per group. (C) Representative confocal image of Iba1/LYN- TLR4 co-localization of each experimental group. All images were taken adjacent to the cortex, which can be visualized by merged image at the bottom right tile. Each color represents the following: green = LYN; red = microglia Iba1/microglia; yellow = overlap of green and red/co-localization of microglia and LYN. All scale bars = 20 μm. (D) The percent of co-localization was obtained by dividing the number of yellow-positive cells by the total number of DAPI-positive cells. Statistical analysis was done by one-way ANOVA P < 0.05; *P < 0.05; n=4 per group. (E) Representative confocal image of LYN-TLR4 co-localization of each experimental group. All images were taken adjacent to the cortex, which can be visualized by merged image at the bottom right tile. Each color represents the following: green = LYN; red = TLR4; yellow = overlap of green and red/co-localization of LYN and TLR4. All scale bars = 20 μm. (F) The percent of co-localization was obtained by dividing the number of yellow-positive cells by the total number of DAPI-positive cells. Statistical analysis was done by one-way ANOVA P < 0.05; *P < 0.05; n=4 per group.
Figure 2.
Figure 2.
Microglia-TLR4-LYN co-localization-Confocal z-stacked images were taken on WT and 5XFAD mice. (A) Representative confocal image of Iba1/microglia- TLR4 co-localization of each experimental group. All images were taken adjacent to the cortex, which can be visualized by merged image at the bottom right tile. Each color represents the following: green = Iba1/microglia; red = TLR4; yellow = overlap of green and red/co-localization of microglia and TLR4. All scale bars = 20 μm. (B) The percent of co-localization was obtained by dividing the number of yellow-positive cells by the total number of DAPI-positive cells. Statistical analysis was done by one-way ANOVA P < 0.05; *P < 0.05; n=4 per group. (C) Representative confocal image of Iba1/LYN- TLR4 co-localization of each experimental group. All images were taken adjacent to the cortex, which can be visualized by merged image at the bottom right tile. Each color represents the following: green = LYN; red = microglia Iba1/microglia; yellow = overlap of green and red/co-localization of microglia and LYN. All scale bars = 20 μm. (D) The percent of co-localization was obtained by dividing the number of yellow-positive cells by the total number of DAPI-positive cells. Statistical analysis was done by one-way ANOVA P < 0.05; *P < 0.05; n=4 per group. (E) Representative confocal image of LYN-TLR4 co-localization of each experimental group. All images were taken adjacent to the cortex, which can be visualized by merged image at the bottom right tile. Each color represents the following: green = LYN; red = TLR4; yellow = overlap of green and red/co-localization of LYN and TLR4. All scale bars = 20 μm. (F) The percent of co-localization was obtained by dividing the number of yellow-positive cells by the total number of DAPI-positive cells. Statistical analysis was done by one-way ANOVA P < 0.05; *P < 0.05; n=4 per group.
Figure 3.
Figure 3.
Characterization and relative quantification of Damage associated Microglia (DAMs) in 5XFAD mice using flow cytometry. (A) Representative FACS plot displaying the gate for microglia (CD11b+CD45lo) population in 5xFAD mouse brain. (B) Comparative FACS plots of male and female 5xFAD mice of this microglia population further characterized using expression of TMEM119medCX3CR1med and TMEM119hiCX3CR1hi (C) FACS plots to assess DAMs using CD11c+ Clec7a+ and (D) compare proportion of activated DAMs in male and female mice. (E) FACS plot and (F) percent quantification comparing proportion of DAMs showing LYN-TLR4 interaction in male and female 5xFAD mice (n=4 mice per group, data from a single experiment, unpaired parametric, two-tailed t-test with Welch’s correction, *p<0.05).
Figure 4.
Figure 4.
Cytokine production by the WT and AD microglia. (A) Representative FACS plot displaying the gate for microglia (CD11b+CD45lo) and further proinflammatory cytokine release by activated microglia is characterized by gating CX3CR1+TNFα+ and CX3CR1+IL6+ population and (B) percent quantification of TNFα and IL6 production by the microglia (One-way ANOVA, *P < 0.05; n=4 per group).
Figure 5.
Figure 5.
Synaptophysin detects microglial phagocytosis of neurons in AD mice brain. (A) Representative confocal image of Iba1/microglia- synaptophysin co-localization of each experimental group. All images were taken adjacent to the cortex, which can be visualized by merged image at the bottom right tile. Each color represents the following: green = Synaptophysin; red = Iba1/microglia; yellow = overlap of green and red/co-localization of microglia and TLR4. All scale bars = 20 μm. (B) The percent of co-localization was obtained by dividing the number of yellow-positive cells by the total number of DAPI-positive cells. Statistical analysis was done by one-way ANOVA, *P < 0.05; n=4 per group. (C) Representative FACS plot displaying the gate for microglia (CD11b+CD45lo→TMEM119+CX3CR1+) and further neuronal phagocytosis by activated microglia is characterized by gating CX3CR1+Synaptophysin+ population and (D) percent quantification of neuronal phagocytosis by the microglia (One-way ANOVA, *P < 0.05; n=4 per group).
Figure 6.
Figure 6.
Cognitive function test. Total latency in seconds for spatial memory function testing by Barnes maze test for 5XFAD males and females, (N = 8 for each group and all bar graphs represent mean SEM; 2-way ANOVA; *p<0.05).

Similar articles

Cited by

References

    1. Asai H, Ikezu S, Tsunoda S, Medalla M, Luebke J, Haydar T, … Ikezu T (2015). Depletion of microglia and inhibition of exosome synthesis halt tau propagation. Nat Neurosci, 18(11), 1584–1593. doi:10.1038/nn.4132 - DOI - PMC - PubMed
    1. Bachiller S, Jimenez-Ferrer I, Paulus A, Yang Y, Swanberg M, Deierborg T, & Boza-Serrano A (2018). Microglia in Neurological Diseases: A Road Map to Brain-Disease Dependent-Inflammatory Response. Front Cell Neurosci, 12, 488. doi:10.3389/fncel.2018.00488 - DOI - PMC - PubMed
    1. Balducci C, Frasca A, Zotti M, La Vitola P, Mhillaj E, Grigoli E, … Forloni G (2017). Toll-like receptor 4-dependent glial cell activation mediates the impairment in memory establishment induced by beta-amyloid oligomers in an acute mouse model of Alzheimer’s disease. Brain Behav Immun, 60, 188–197. doi:10.1016/j.bbi.2016.10.012 - DOI - PubMed
    1. Bolos M, Perea JR, Terreros-Roncal J, Pallas-Bazarra N, Jurado-Arjona J, Avila J, & Llorens-Martin M (2018). Absence of microglial CX3CR1 impairs the synaptic integration of adult-born hippocampal granule neurons. Brain Behav Immun, 68, 76–89. doi:10.1016/j.bbi.2017.10.002 - DOI - PubMed
    1. Choi JS, Kim HY, Chung JW, Chun MH, Kim SY, Yoon SH, & Lee MY (2005). Activation of Src tyrosine kinase in microglia in the rat hippocampus following transient forebrain ischemia. Neurosci Lett, 380(1–2), 1–5. doi:10.1016/j.neulet.2005.01.015 - DOI - PubMed

MeSH terms