. 2023 Jan 23;62(4):e202214394.
doi: 10.1002/anie.202214394. Epub 2022 Dec 15.

Peptide Amphiphile Mediated Co-assembly for Nanoplasmonic Sensing

Affiliations

Peptide Amphiphile Mediated Co-assembly for Nanoplasmonic Sensing

Zhicheng Jin et al. Angew Chem Int Ed Engl. .

Abstract

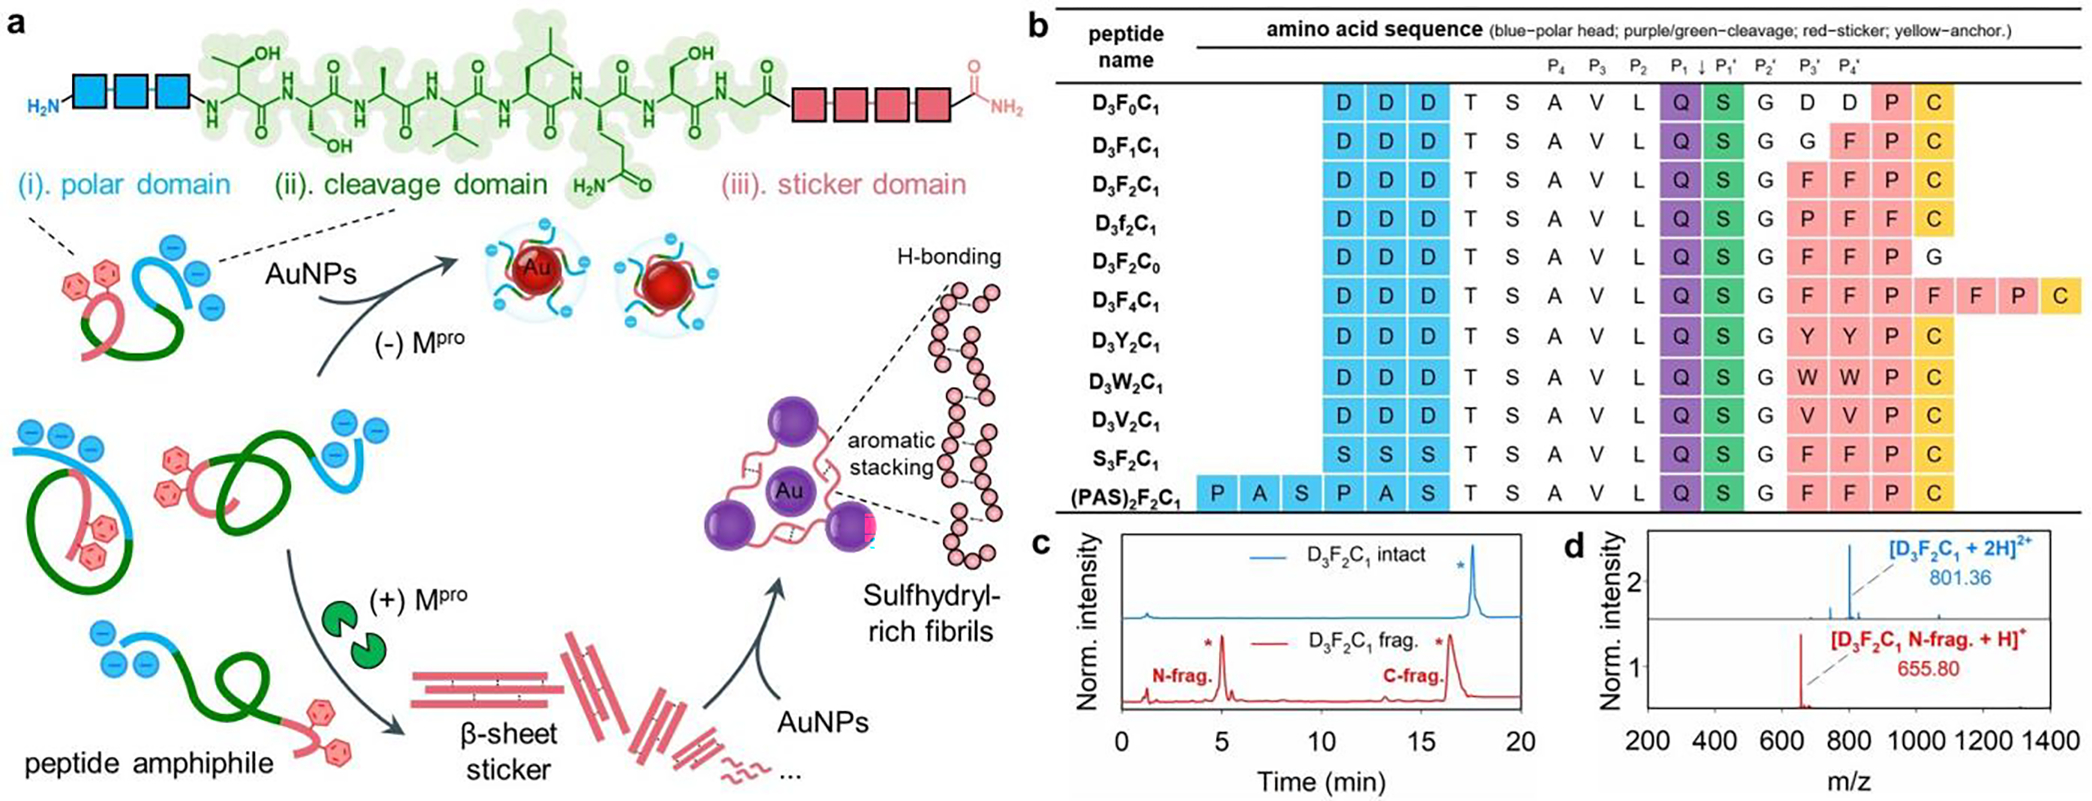
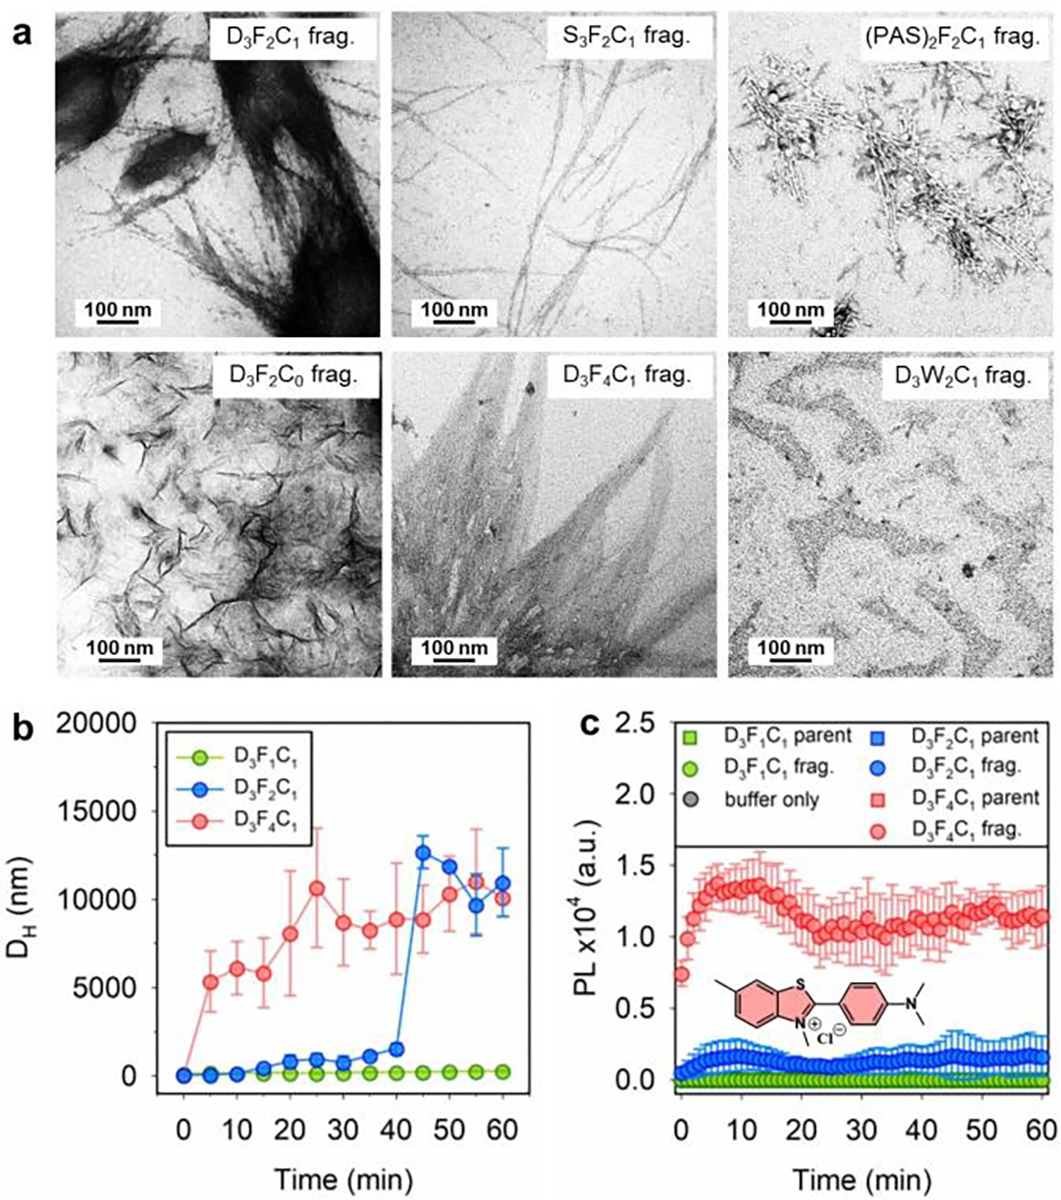
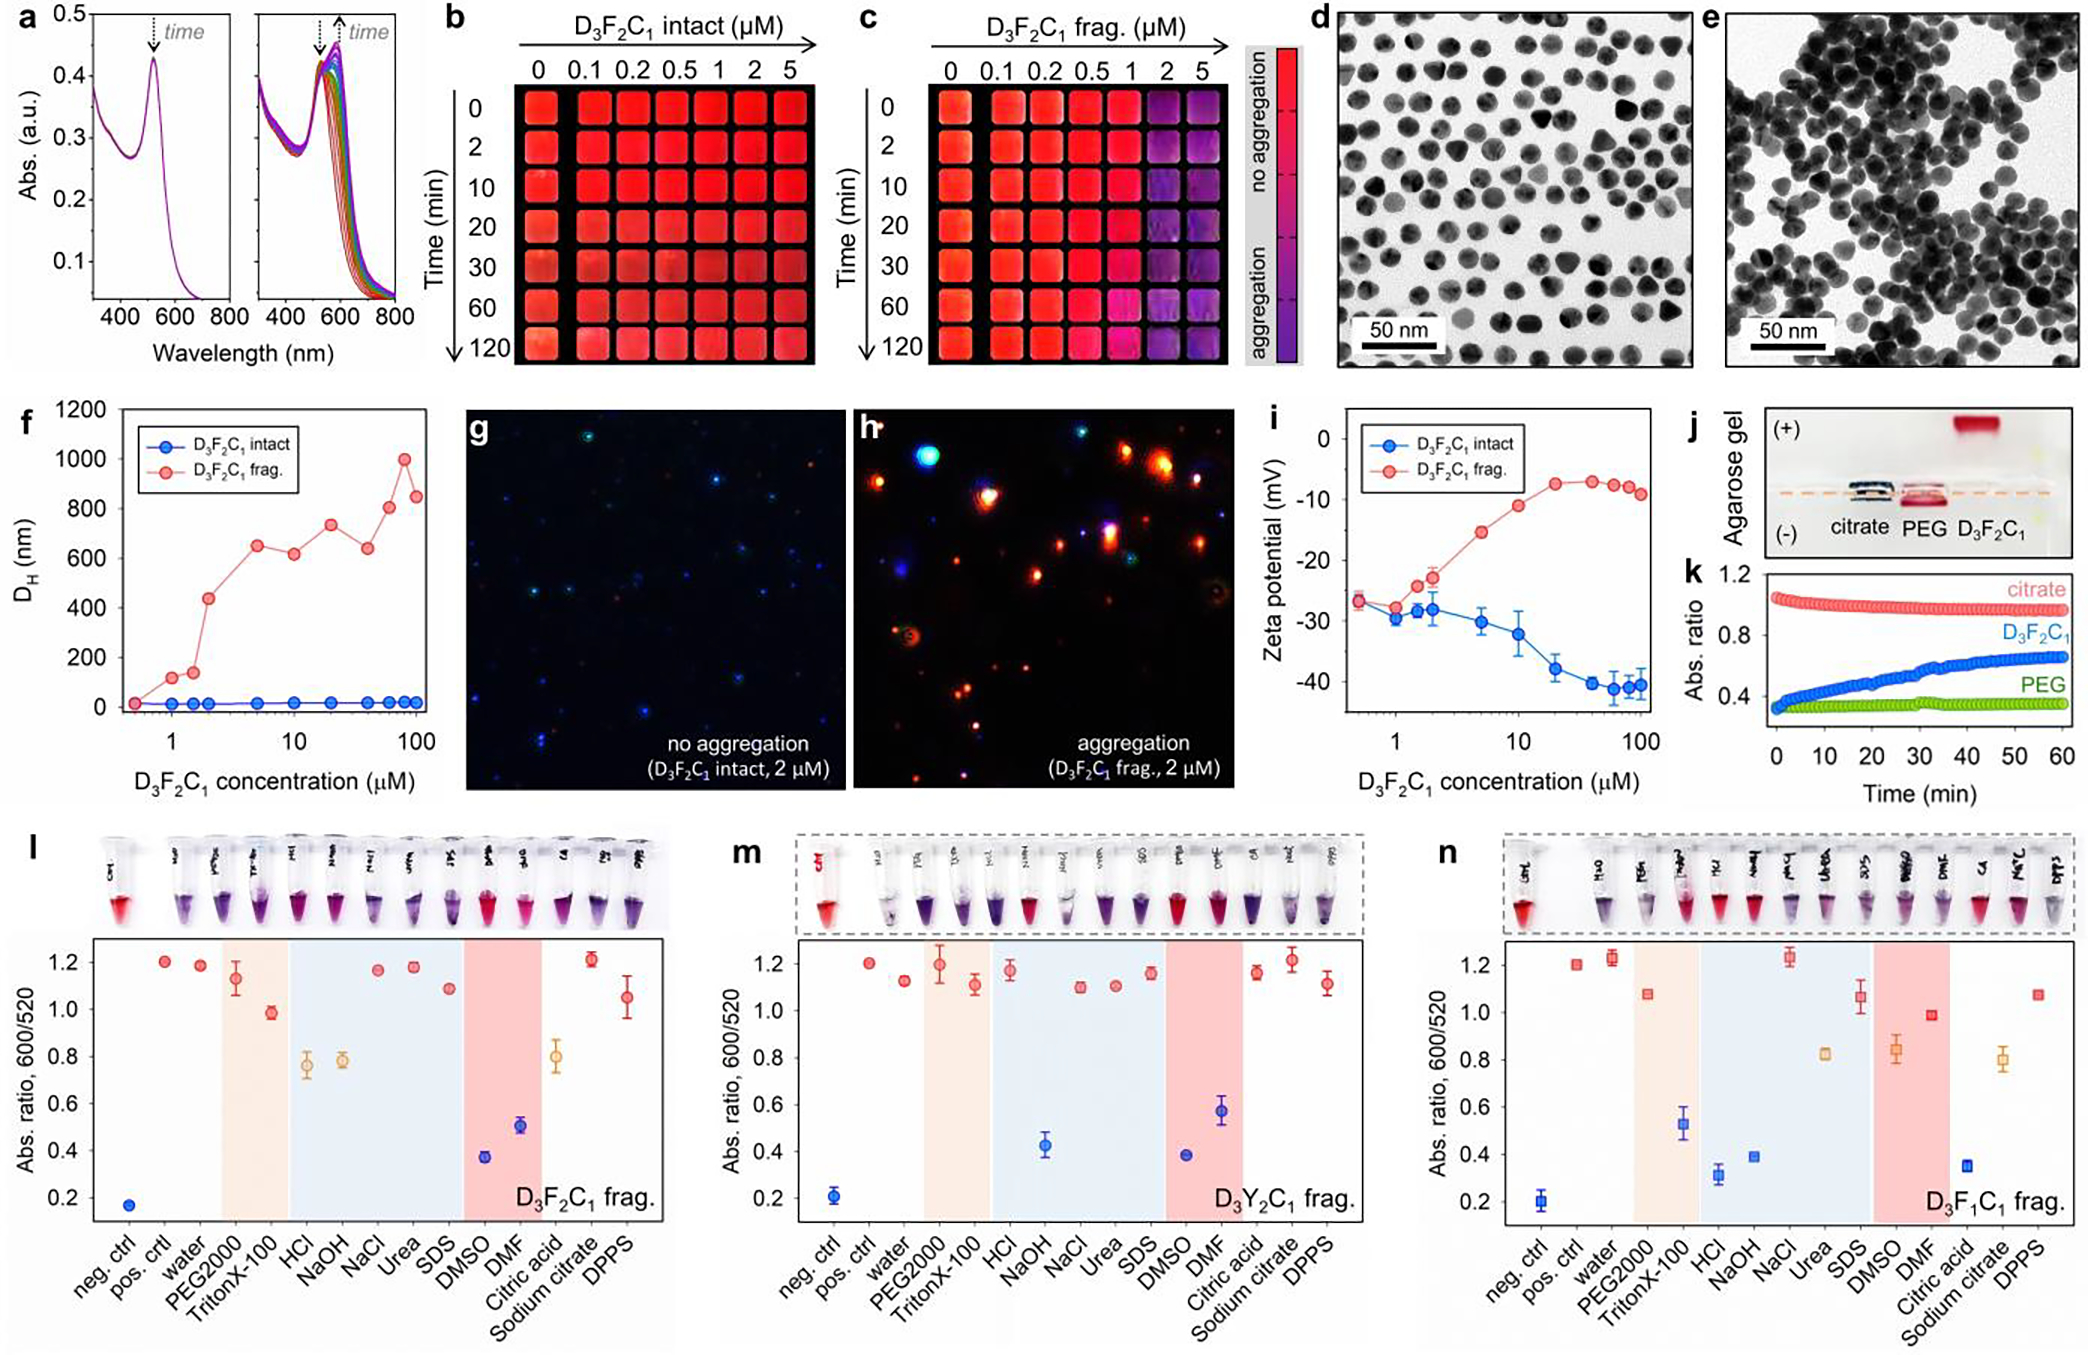
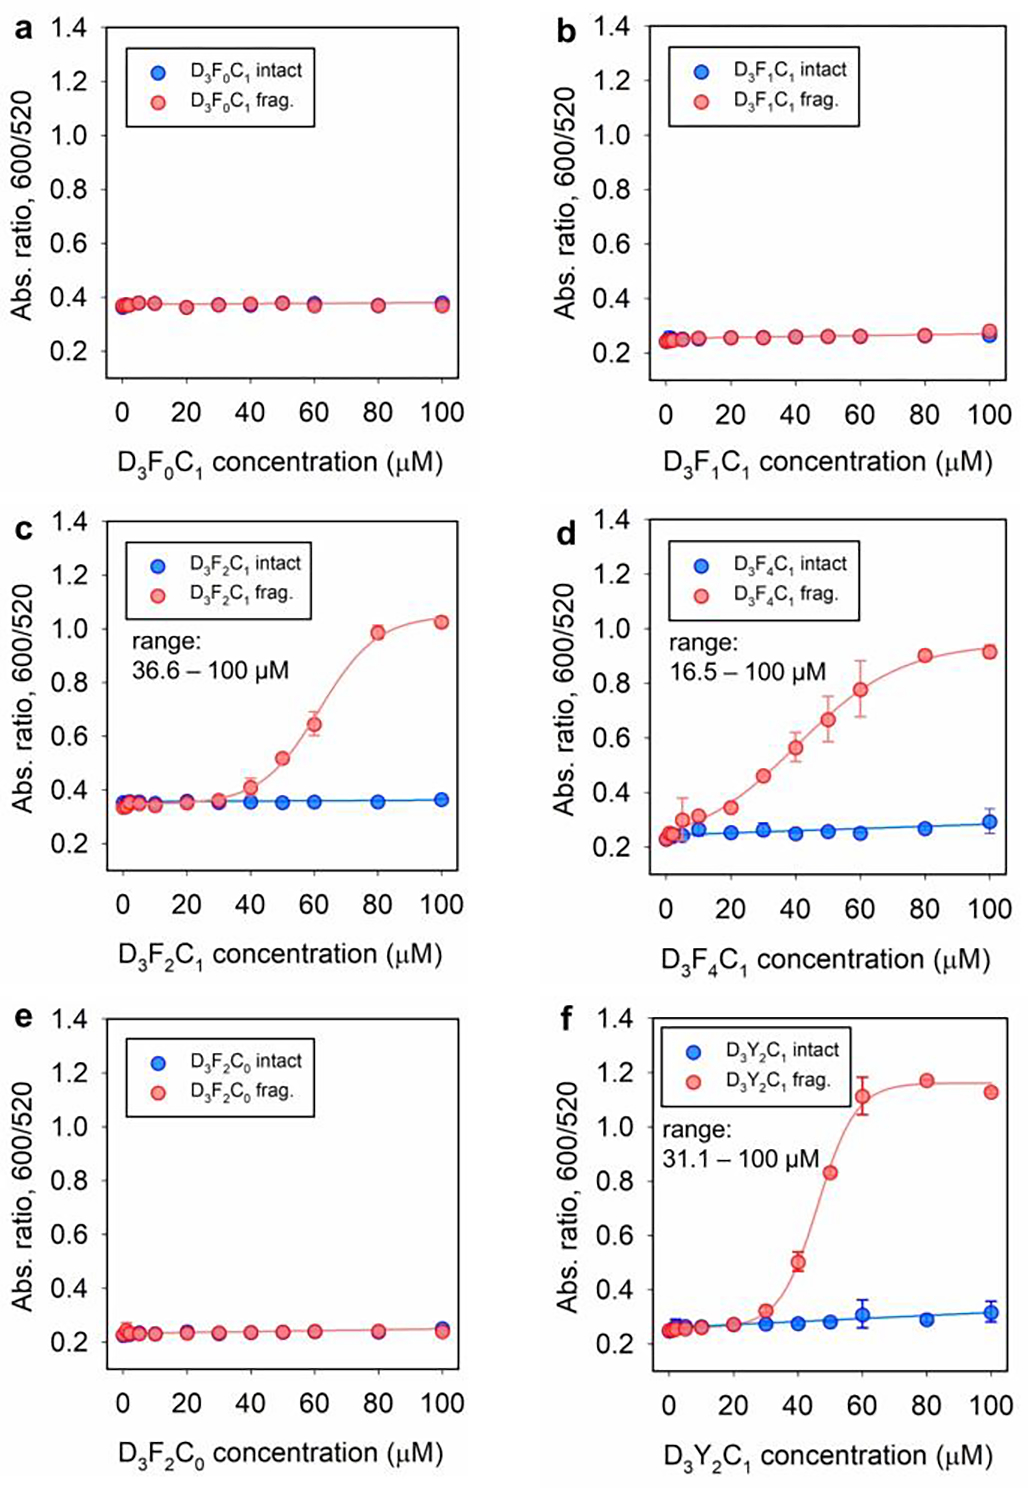
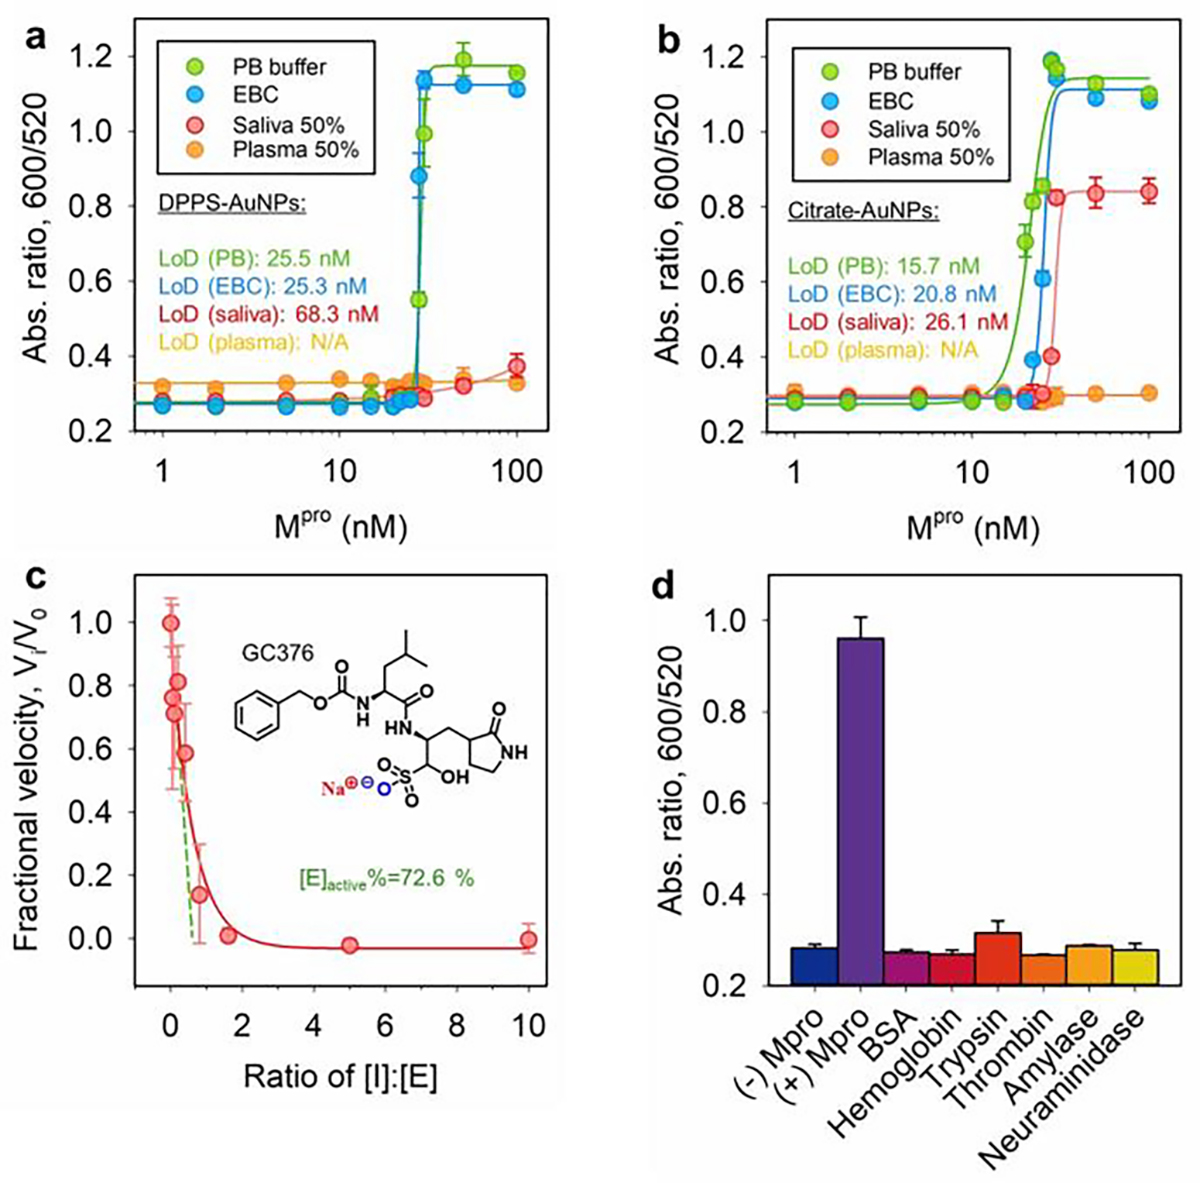
Aromatic interactions are commonly involved in the assembly of naturally occurring building blocks, and these interactions can be replicated in an artificial setting to produce functional materials. Here we describe a colorimetric biosensor using co-assembly experiments with plasmonic gold and surfactant-like peptides (SLPs) spanning a wide range of aromatic residues, polar stretches, and interfacial affinities. The SLPs programmed in DDD-(ZZ)x -FFPC self-assemble into higher-order structures in response to a protease and subsequently modulate the colloidal dispersity of gold leading to a colorimetric readout. Results show the strong aggregation propensity of the FFPC tail without polar DDD head. The SLPs were specific to the target protease, i.e., Mpro , a biomarker for SARS-CoV-2. This system is a simple and visual tool that senses Mpro in phosphate buffer, exhaled breath condensate, and saliva with detection limits of 15.7, 20.8, and 26.1 nM, respectively. These results may have value in designing other protease testing methods.

Keywords: Aromatic Interactions; Colorimetric Test; Main Protease; Peptide Amphiphile; Saliva.


Figures

Figure 1.
Figure 1.
Library of surfactant-like peptides (SLPs) studied here for colorimetric assays. (a) Chemical structures of modular peptide amphiphiles have an aromatic amino acid sticker tethered by a polar head of increasing hydrophilicity; an Mpro cleavage sequence is in the center. The schematic illustrates the peptide self-assembly and subsequent co-assembly with plasmonic nanoparticle in the presence of Mpro. The intact peptides produce β-sheet structures rich in sulfhydryl groups after proteolysis, which favors plasmonic coupling via aromatic-stacking/hydrogen-bonding. (b) Synthetic peptide sequences spanning a wide range of aromatic residues, polar stretches, and interfacial affinities. The amino acids on the polar head, cleavage site, and sticker tail are color coded. Mpro cleaves the peptide at Q↓S (i.e., P1 and P1’ site). (c,d) HPLC and ESI-MS data confirm that Mpro cleaves the representative D3F2C1 peptide between Q and S. Peaks with * are the intact peptide (blue); the fragments are in red. The specificity constant (kcat/KM) for D3F2C1 substrate by Mpro is 4,178.6 M−1.s−1.
Figure 2.
Figure 2.
(a) TEM micrographs of the stained SLP fragments prepared by incubating the corresponding intact peptide (600 μM) with Mpro (200 nM) and aging for 48 h. The SGFFPC and SGFFPFFPC form a network of ordered nanofibrils. (b) Hydrodynamic size (DH) change of the D3FnC1 peptide (n = 1, 2, 4, at 600 μM) when incubated with Mpro (200 nM) at 37 °C. The time of initializing macroscopic aggregation in D3F4C1 and D3F2C1 solutions is about 5 and 40 min, respectively. While the D3F1C1 produced no secondary structure under the tested conditions. (c) ThT kinetic experiment showing fluorescence intensity at 485 nm for 50 μM ThT incubated with 300 μM peptides (e.g., D3F1C1, D3F2C1, D3F4C1, and their aged proteolytic products), as recorded over 1 h. The negative control consisted of buffer only. Error bars = standard errors (n = 3). Inset shows the dye structure.
Figure 3.
Figure 3.
Mpro-induced color change using the modular peptide amphiphiles and colloidal gold (citrate). (a) The time progression of optical absorption of AuNPs (3.4 nM, 100 μL) when incubated with D3F2C1 intact (left) and its fragments (right, c = 1.5 μM). The curves were recorded every 1 min for 30 min. Arrows designate sizable optical changes at 520 and 600 nm. (b-c) The concentration- and time-dependent color evolution of AuNPs (3.4 nM, 100 μL) in the presence of intact D3F2C1 and its pre-cleaved fragments. These are cropped images with a color bar where purple represents particle flocculation. See also TEM images of AuNPs (3.4 nM, 8 μL) when mixed with D3F2C1 intact (d, monolayer) and its fragments (e, heterogeneous stacking). (f) DLS profiles of AuNPs (3.4 nM, 100 μL) incubated with D3F2C1 intact (blue) and its fragments (red) of 0 – 100 μM. (g-h) View of MANTA[22b] size measurement shows that AuNPs (c = 0.2 – 0.6 nM) scatter blue light with D3F2C1 intact (2.0 μM), whereas the fragment-induced colloidal aggregates scatter red light. (i) Zeta potential of AuNPs (3.4 nM, 100 μL) when incubated with increasing concentrations of D3F2C1 intact (blue, reduced from −26.0 to −40.4 mV) and its fragments (red, increased from −26.6 to −9.0 mV). Error bars represent triplicate measurements for one sample. (j) The agarose gel (0.7% w/v) electrophoresis image collected from citrate-AuNPs only, AuNPs incubated with HS-PEG2k-OCH3, and intact D3F2C1 (from left to right). Samples were prepared using the AuNPs (~15 nM, 40 μL) mixed with glycerol (10 μL). Note that TBE buffer (1×) promotes instant aggregation of citrate-AuNPs. (k) Ca2+ cation (20 mM)-modulated dispersity of citrate (red), PEGylated (green), and D3F2C1-capped AuNPs (blue). The colloidal dispersity is quantified by ratiometric signal, i.e., Abs600/Abs520. The DDD stretch negatively charges the surfaces and promotes colloidal stability via electrostatic double repulsion. (l-n) White-light image (top) and quantified reversal color change (bottom) of the gold pellet in different surfactant solutions (10 mM, 100 μL) or solvents (100 μL). Panel l indicates an aromatic stacking-driven co-assembly of D3F2C1 fragments and AuNPs. The gold pellet is prepared by aggregating AuNPs (3.4 nM, 100 μL) with D3F2C1/D3Y2C1/D3F1C1 fragments (at 600 μM, 30 μL). Error bars = standard deviations (n = 3).
Figure 4.
Figure 4.
Dynamic range of peptide. Ratiometric signal (i.e., Abs600/Abs520 at 3 h readout time) recorded from DPPS-AuNPs (2.8 nM, 120 μL) incubated with various amount of D3F0C1 intact (a), D3F1C1 intact (b), D3F2C1 intact (c), D3F4C1 intact (d), D3F2C0 intact (e), D3Y2C1 intact (f), and their corresponding proteolytic fragments (red). The charged polar head, di-homo aromatic amino acid, and cysteine are indispensable modules for peptide amphiphiles to colorimetrically measure protease. The determined lower limit of dynamic range for D3F2C1, D3F4C1, and D3Y2C1 SLP is 36.6, 16.5, and 31.1 μM, respectively. Error bars = standard deviations (n = 2).
Figure 5.
Figure 5.
Sensitivity and specificity test. Ratiometric absorbance as a function of Mpro concentration: The D3F2C1 substrate (100 μM), DPPS-AuNPs (2.4 nM), and a 6 h assay time are employed in (a), while citrate-AuNPs (2.4 nM) and a 3 h 10 min assay time are used in (b). The LoDs are shown and the linear region is provided in Figure S17.[31] Error bar = standard deviation (n = 2). (c) Inhibition curve collected by titrating Mpro (50 nM) with varying amount of GC376 in the presence of D3F2C1 substrate (100 μM): % active Mpro = [I]/[E] at the x-intercept (see dash green line, 72.6%).[32] Inset is the chemical structure of inhibitor GC376. Error bar = standard deviation (n = 2). (d) Sensor performance interfered by other mammalian proteins (50 nM), including bovine serum albumin (BSA), hemoglobin, trypsin, thrombin, α-amylase (50 U/mL), and neuraminidase (5 U/mL). Samples with and without Mpro were the controls.

References

    1. Gazit E, Chem. Soc. Rev. 2007, 36, 1263–1269; - PubMed
    2. Levin A, Hakala TA, Schnaider L, Bernardes GJL, Gazit E, Knowles TPJ, Nat. Rev. Chem. 2020, 4, 615–634;
    3. Lampel A, Chem 2020, 6, 1222–1236.
    1. Sheehan F, Sementa D, Jain A, Kumar M, Tayarani-Najjaran M, Kroiss D, Ulijn RV, Chem. Rev. 2021, 121, 13869–13914. - PubMed
    1. Bera S, Mondal S, Xue B, Shimon LJW, Cao Y, Gazit E, Nat. Mater. 2019, 18, 503–509. - PMC - PubMed
    1. Saha K, Agasti SS, Kim C, Li X, Rotello VM, Chem. Rev. 2012, 112, 2739–2779; - PMC - PubMed
    2. Nowinski AK, Sun F, White AD, Keefe AJ, Jiang S, J. Am. Chem. Soc. 2012, 134, 6000–6005; - PMC - PubMed
    3. Xie X, Xu W, Liu X, Acc. Chem. Res. 2012, 45, 1511–1520; - PubMed
    4. Huang RH, Nayeem N, He Y, Morales J, Graham D, Klajn R, Contel M, O’Brien S, Ulijn RV, Adv. Mater. 2022, 34, 2104962. - PMC - PubMed
    1. Ruan S, Xiao W, Hu C, Zhang H, Rao J, Wang S, Wang X, He Q, Gao H, ACS Appl. Mater. Interfaces 2017, 9, 20348–20360; - PubMed
    2. Jin Z, Yeung J, Zhou J, Cheng Y, Li Y, Mantri Y, He T, Yim W, Xu M, Wu Z, Fajtova P, Creyer MN, Moore C, Fu L, Penny WF, O’Donoghue AJ, Jokerst JV, Chem. Mater. 2022, 34, 1259–1268. - PMC - PubMed

Publication types