

Turning and multitask gait unmask gait disturbance in mild-to-moderate multiple sclerosis: Underlying specific cortical thinning and connecting fibers damage
- PMID: 36409700
- PMCID: PMC9875928
- DOI: 10.1002/hbm.26151
Turning and multitask gait unmask gait disturbance in mild-to-moderate multiple sclerosis: Underlying specific cortical thinning and connecting fibers damage
Abstract
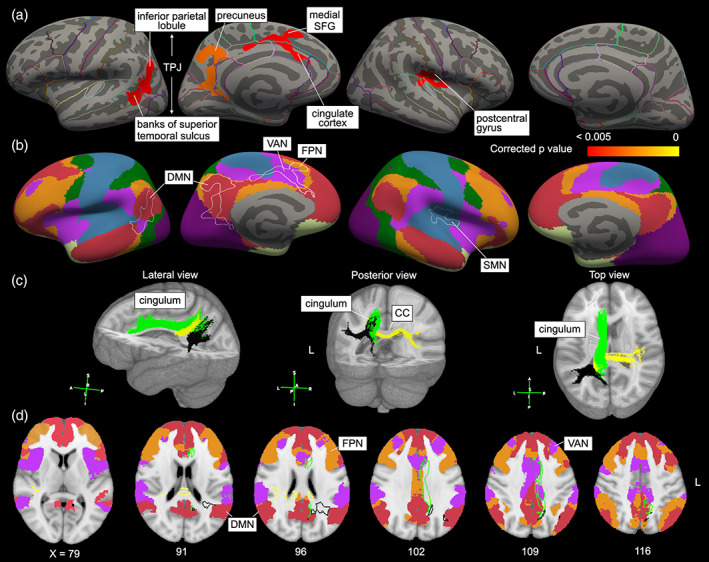
Multiple sclerosis (MS) causes gait and cognitive impairments that are partially normalized by compensatory mechanisms. We aimed to identify the gait tasks that unmask gait disturbance and the underlying neural correlates in MS. We included 25 patients with MS (Expanded Disability Status Scale score: median 2.0, interquartile range 1.0-2.5) and 19 healthy controls. Fast-paced gait examinations with inertial measurement units were conducted, including straight or circular walking with or without cognitive/motor tasks, and the timed up and go test (TUG). Receiver operating characteristic curve analysis was performed to distinguish both groups by the gait parameters. The correlation between gait parameters and cortical thickness or fractional anisotropy values was examined by using three-dimensional T1-weighted imaging and diffusion tensor imaging, respectively (corrected p < .05). Total TUG duration (>6.0 s, sensitivity 88.0%, specificity 84.2%) and stride velocity during cognitive dual-task circular walking (<1.12 m/s, 84.0%, 84.2%) had the highest discriminative power of the two groups. Deterioration of these gait parameters was correlated with thinner cortical thickness in regional areas, including the left precuneus and left temporoparietal junction, overlapped with parts of the default mode network, ventral attention network, and frontoparietal network. Total TUG duration was negatively correlated with fractional anisotropy values in the deep cerebral white matter areas. Turning and multitask gait may be optimal to unveil partially compensated gait disturbance in patients with mild-to-moderate MS through dynamic balance control and multitask processing, based on the structural damage in functional networks.
Keywords: cognitive-motor interference; dynamic balance control; gait disturbance; multiple sclerosis; the timed up and go test.
© 2022 The Authors. Human Brain Mapping published by Wiley Periodicals LLC.
Conflict of interest statement
None of the authors declare any conflicts of interest.
Figures


Similar articles
-
Turning is an important marker of balance confidence and walking limitation in persons with multiple sclerosis.PLoS One. 2018 Jun 7;13(6):e0198178. doi: 10.1371/journal.pone.0198178. eCollection 2018. PLoS One. 2018. PMID: 29879144 Free PMC article.
-
Erratum.Mult Scler. 2016 Oct;22(12):NP9-NP11. doi: 10.1177/1352458515585718. Epub 2015 Jun 3. Mult Scler. 2016. PMID: 26041800
-
Cognitive-motor interference in people with mild to moderate multiple sclerosis, in comparison with healthy controls.Mult Scler Relat Disord. 2022 Nov;67:104181. doi: 10.1016/j.msard.2022.104181. Epub 2022 Sep 13. Mult Scler Relat Disord. 2022. PMID: 36174259
-
Wearable inertial sensors provide reliable biomarkers of disease severity in multiple sclerosis: A systematic review and meta-analysis.Ann Phys Rehabil Med. 2020 Mar;63(2):138-147. doi: 10.1016/j.rehab.2019.07.004. Epub 2019 Aug 14. Ann Phys Rehabil Med. 2020. PMID: 31421274
-
Clinical Measures of Dual Task Gait Evaluation in Individuals with Type 2 Diabetes Mellitus - A Mini-review.Curr Diabetes Rev. 2023;19(8):e300123213240. doi: 10.2174/1573399819666230130093424. Curr Diabetes Rev. 2023. PMID: 36717992 Review.
Cited by
-
In Parkinson's disease, dual-tasking reduces gait smoothness during the straight-walking and turning-while-walking phases of the Timed Up and Go test.BMC Sports Sci Med Rehabil. 2025 Mar 7;17(1):42. doi: 10.1186/s13102-025-01068-8. BMC Sports Sci Med Rehabil. 2025. PMID: 40055732 Free PMC article.
-
Controlling the Impact of Helicobacter pylori-Related Hyperhomocysteinemia on Neurodegeneration.Medicina (Kaunas). 2023 Mar 4;59(3):504. doi: 10.3390/medicina59030504. Medicina (Kaunas). 2023. PMID: 36984505 Free PMC article.
-
Neuroimaging Technology in Exercise Neurorehabilitation Research in Persons with MS: A Scoping Review.Sensors (Basel). 2023 May 6;23(9):4530. doi: 10.3390/s23094530. Sensors (Basel). 2023. PMID: 37177732 Free PMC article.
References
-
- [Dataset] the Alzheimer's Disease Neuroimaging Initiative . (2003). the Alzheimer's Disease Neuroimaging Initiative (ADNI) database; DOD ADNI (Department of Defense award number W81XWH‐12‐2‐0012).
-
- Awata, S. , Sugiyama, M. , Ito, K. , Ura, C. , Miyamae, F. , Sakuma, N. , Niikawa, H. , Okamura, T. , Inagaki, H. , & Ijuin, M. (2016). Development of the dementia assessment sheet for community‐based integrated care system. Geriatrics & Gerontology International, 16(Suppl 1), 123–131. 10.1111/ggi.12727 - DOI - PubMed
Publication types
MeSH terms
Grants and funding
LinkOut - more resources
Full Text Sources
Medical
