. 2022 Nov 21;18(11):e1010670.
doi: 10.1371/journal.pcbi.1010670. eCollection 2022 Nov.

Social dilemmas of sociality due to beneficial and costly contagion

Affiliations

Social dilemmas of sociality due to beneficial and costly contagion

Daniel B Cooney et al. PLoS Comput Biol. .

Abstract

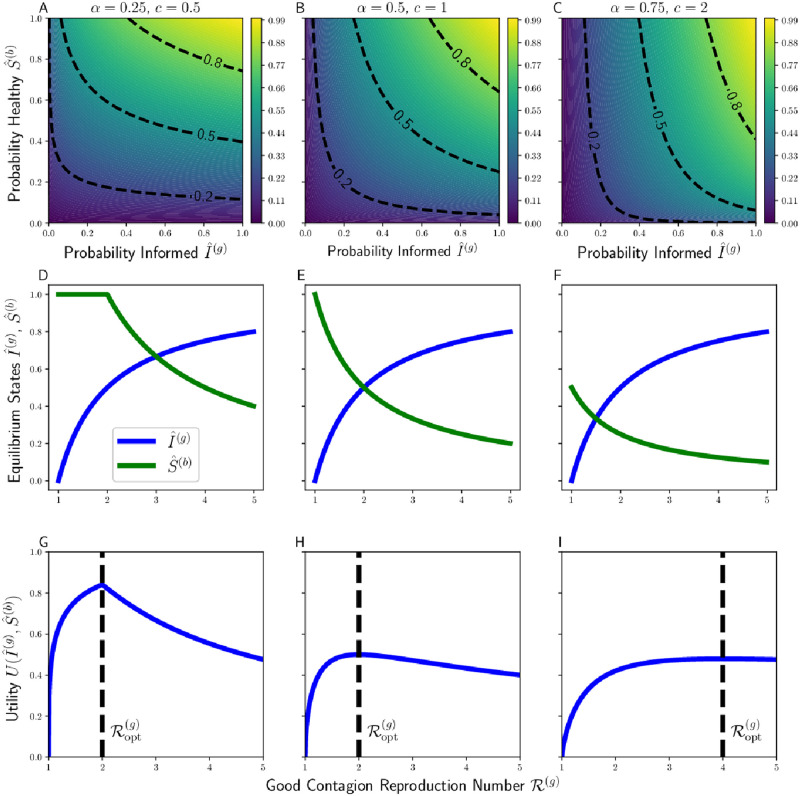
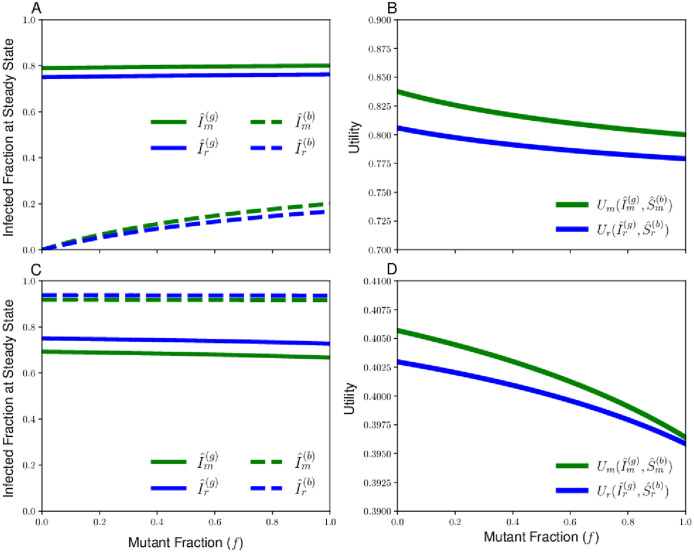
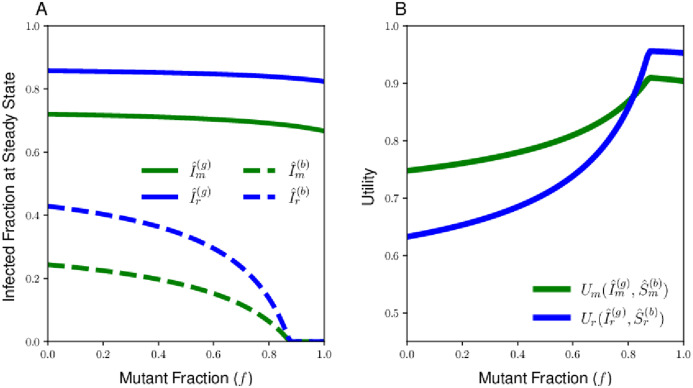
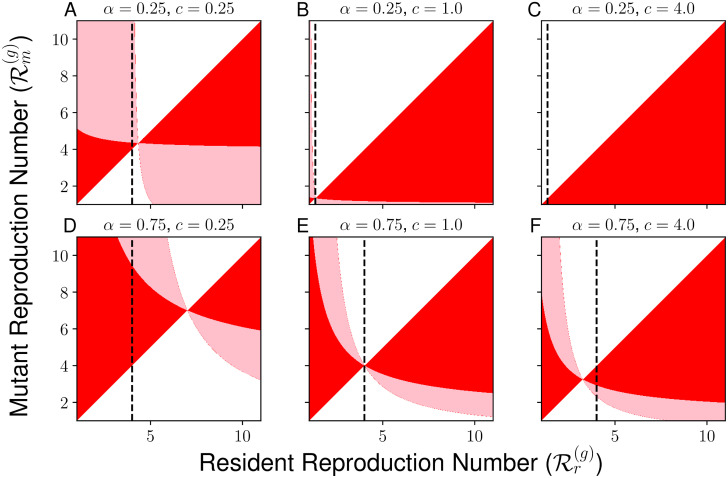
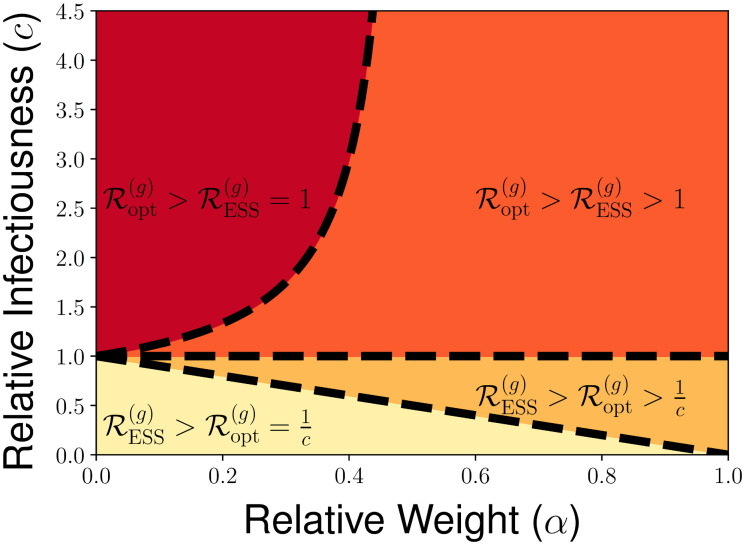
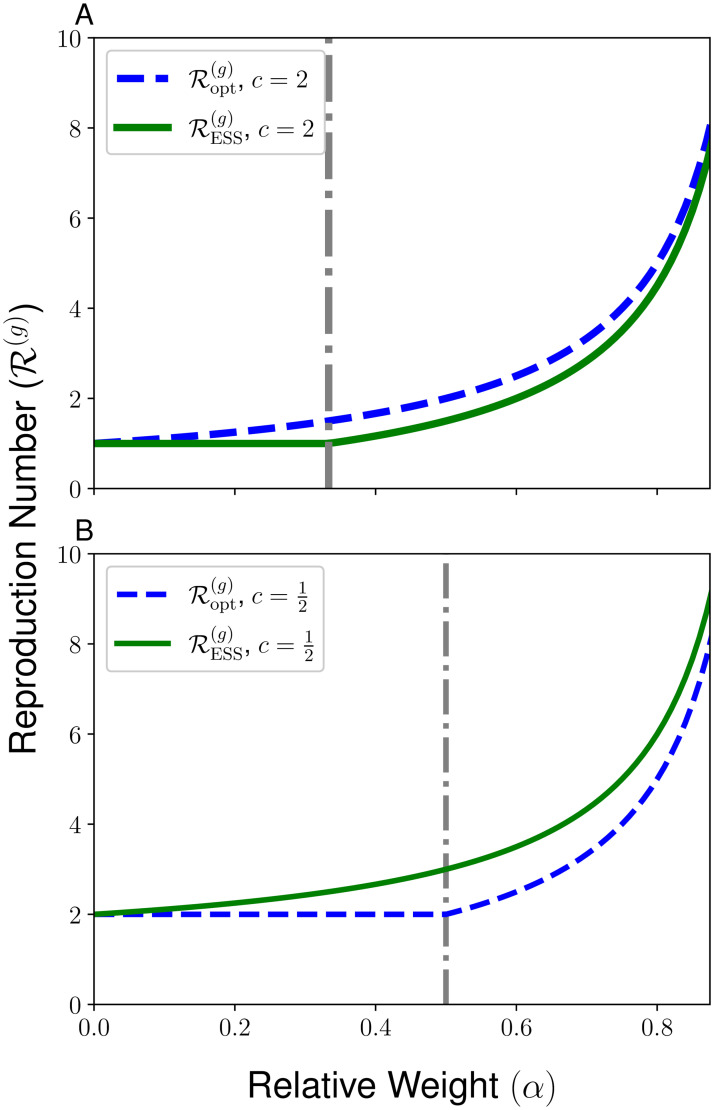
Levels of sociality in nature vary widely. Some species are solitary; others live in family groups; some form complex multi-family societies. Increased levels of social interaction can allow for the spread of useful innovations and beneficial information, but can also facilitate the spread of harmful contagions, such as infectious diseases. It is natural to assume that these contagion processes shape the evolution of complex social systems, but an explicit account of the dynamics of sociality under selection pressure imposed by contagion remains elusive. We consider a model for the evolution of sociality strategies in the presence of both a beneficial and costly contagion. We study the dynamics of this model at three timescales: using a susceptible-infectious-susceptible (SIS) model to describe contagion spread for given sociality strategies, a replicator equation to study the changing fractions of two different levels of sociality, and an adaptive dynamics approach to study the long-time evolution of the population level of sociality. For a wide range of assumptions about the benefits and costs of infection, we identify a social dilemma: the evolutionarily-stable sociality strategy (ESS) is distinct from the collective optimum-the level of sociality that would be best for all individuals. In particular, the ESS level of social interaction is greater (respectively less) than the social optimum when the good contagion spreads more (respectively less) readily than the bad contagion. Our results shed light on how contagion shapes the evolution of social interaction, but reveals that evolution may not necessarily lead populations to social structures that are good for any or all.


Conflict of interest statement

The authors have declared that no competing interests exist.

Figures

Fig 1
Fig 1
Example heatmaps of Cobb-Douglas utility for various weights α of emphasis on acquiring the good contagion versus avoiding the bad contagion (A–C), endemic equilibria I^(g) and S^(b) as a function of sociality strategy R(g) for different values of relative transmissibility c (D–F), and resultant overall utilities as a function of R(g) given α and c (G–I). Note that in certain cases (e.g. G) utility is maximized by setting R(g)=1c, the maximal degree of sociality at which the bad contagion fails to spread. Vertical dashed lines in G–I correspond to the socially-optimal sociality strategy Ropt(g).
Fig 2
Fig 2. Sample contagion equilibria and Cobb-Douglas utility achieved by resident and mutant strategies as a function of the fraction of individuals following the mutant strategy f.
We consider a resident with reproduction number Rr(g)=Ropt(g)=4 in all panels. (A,C): Endemic equilibria of the good and bad contagion for the cases of relative infectiousness and mutant reproduction number c = 0.25, Rm(g)=5 (A) and c = 4, Rm(g)=3 (C). (B,D): Plots of Cobb-Douglas utility Ur(f) and Um(f) achieved at contagion equilibrium for individuals following resident and mutant strategy, will parameters c = 0.25, Rm(g)=5 (B) or c = 4, Rm(g)=3 (D). For both cases, we use a Cobb-Douglas utility function with weight parameter α = 0.75. In both cases, the utility of the mutant type (green curve) always exceeds the utility of the resident type (blue curve), and the replicator equation will favor fixation to an all-mutant composition.
Fig 3
Fig 3. Endemic equilibria of the two contagions for the resident and mutant populations (A) and the Cobb-Douglas utility (B) for a case in which the resident and mutant sociality stategies lie on opposite sides of the social optimum.
The utility for the resident strategy (blue curve) and the mutant strategy (green curve) intersect at a single fraction of mutants f, which is the equilibrium of the replicator equation at which the two types will coexist. The Cobb-Douglas utility has weight parameter α = 0.25, the relative infectiousness of the bad contagion is c = 0.25, and the resident and mutant reproduction numbers are given by Rr(g)=7 and Rm(g)=3, respectively.
Fig 4
Fig 4. Pairwise invasibility plot with mutual invasbility or lack thereof shown.
In each panel, horizontal axis describes the reproduction number Rr of the resident strategy, while the vertical axis describes the reproduction number Rm corresponding to the mutant strategy. The color of a given point describes the outcome of pairwise competition between the resident and mutant strategy. Points displayed in white describe pairs of strategies in which the resident strategy dominates the mutant strategy: a small cohort of the mutant will fail to invade a population primarily consisting of resident strategy, while a small cohort of the resident strategy will successfully invade a population primarily consisting of the mutant strategy. Points in red describe pairs of strategies in which the mutant strategy dominates the resident strategy: the mutant strategy will successfully invade the resident when rare, and a population of the mutant strategy will resist the invasion of a small cohort of the resident strategy. Points displayed in pink describe a case in which neither the resident nor mutant strategy dominates the other: the mutant invades the resident when rare and the resident invades the mutant when rare. The dashed line describes the socially-optimal strategy Ropt(g), while the point of intersection of two components of the red region corresponds to the evolutionarily-stable strategy RESS(g). All areas of mutual invasibility are off the diagonal except when arbitrarily close to the evolutionarily-stable strategy ESS, which implies that dimorphism will not evolve if mutations are small.
Fig 5
Fig 5. Illustration of the four possible qualitative behaviors for Ropt(g) and RESS(g) across the range of relative levels of infectiousness for the bad contagion c and relative weight placed on the good contagion α under Cobb-Douglas utility.
The various regions are defined by the relative size of RESS(g) and Ropt(g), as well as whether RESS(g)=1 or RESS(g)>1 and whether Ropt(g)=1c or Ropt(g)>1c, with the boundaries between regions as characterized by Table 1.
Fig 6
Fig 6. Reproduction numbers RESS(g) (solid green line) and Ropt(g) (dashed blue line) for the good contagion.
We plot these reproduction numbers as a function of the relative importance of the good contagion α and for the relative infectiousness values c = 2 (A) and c=12 (B).

Similar articles

Cited by

References

    1. Rubenstein DR, Abbot P. The evolution of social evolution. In: Rubenstein DR, Abbot P, editors. Comparative social evolution. Cambridge: Cambridge University Press; 2017. p. 1–18.
    1. Alexander RD. The evolution of social behavior. Annual Review of Ecology and Systematics. 1974; 5(1):325–83. doi: 10.1146/annurev.es.05.110174.001545 - DOI
    1. Kermack WO, McKendrick AG. A contribution to the mathematical theory of epidemics. Proceedings of the royal society of london. Series A, Containing papers of a mathematical and physical character. 1927 Aug 1;115(772):700–21.
    1. Bass FM. A new product growth for model consumer durables. Management Science. 1969. Jan;15(5):215–27. doi: 10.1287/mnsc.15.5.215 - DOI
    1. Rogers EM. Diffusion of Innovations. 4th ed. New York: Simon and Schuster; 2010. Jul 6.

Publication types