. 2023 Jan 18;83(2):264-284.
doi: 10.1158/0008-5472.CAN-22-0423.

JAK-STAT Signaling in Inflammatory Breast Cancer Enables Chemotherapy-Resistant Cell States

Affiliations

JAK-STAT Signaling in Inflammatory Breast Cancer Enables Chemotherapy-Resistant Cell States

Laura E Stevens et al. Cancer Res. .

Abstract

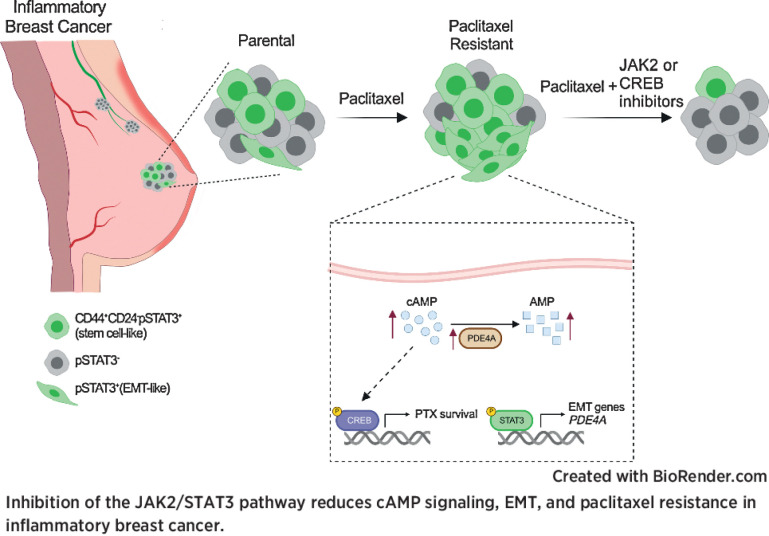
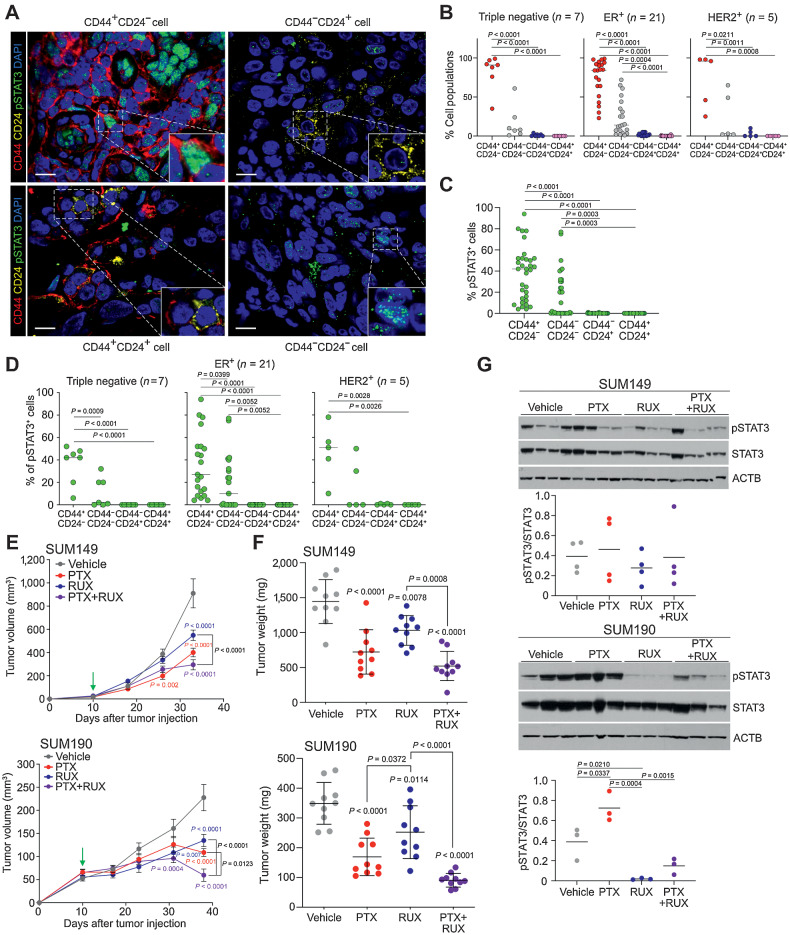
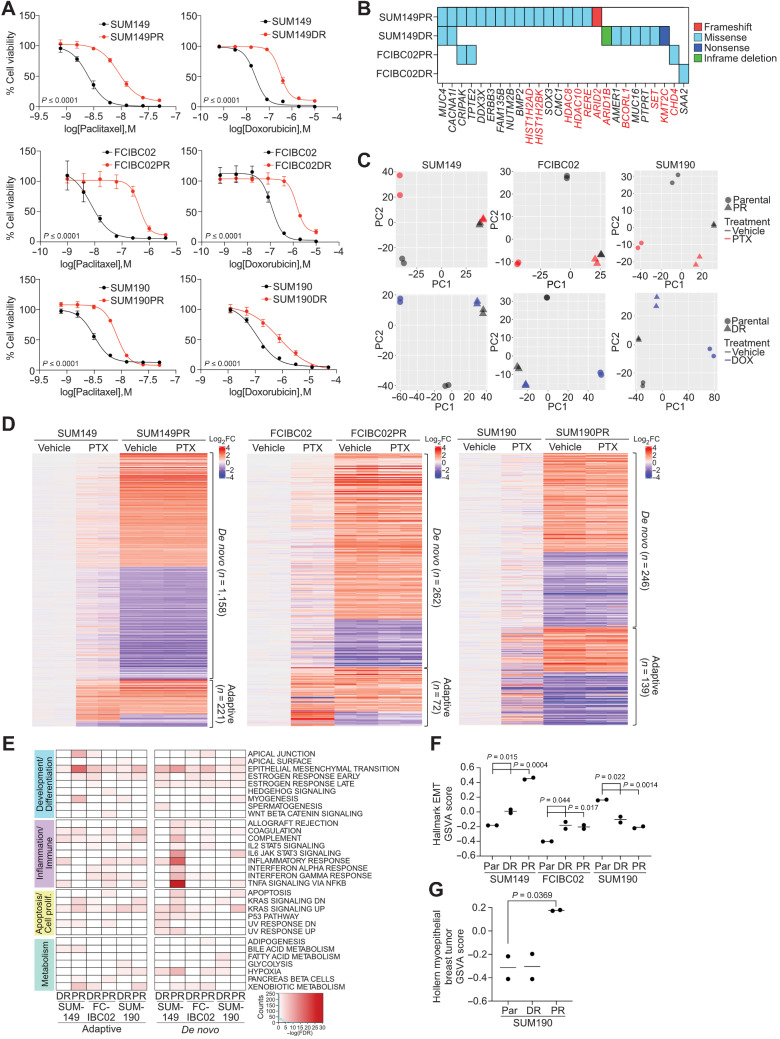
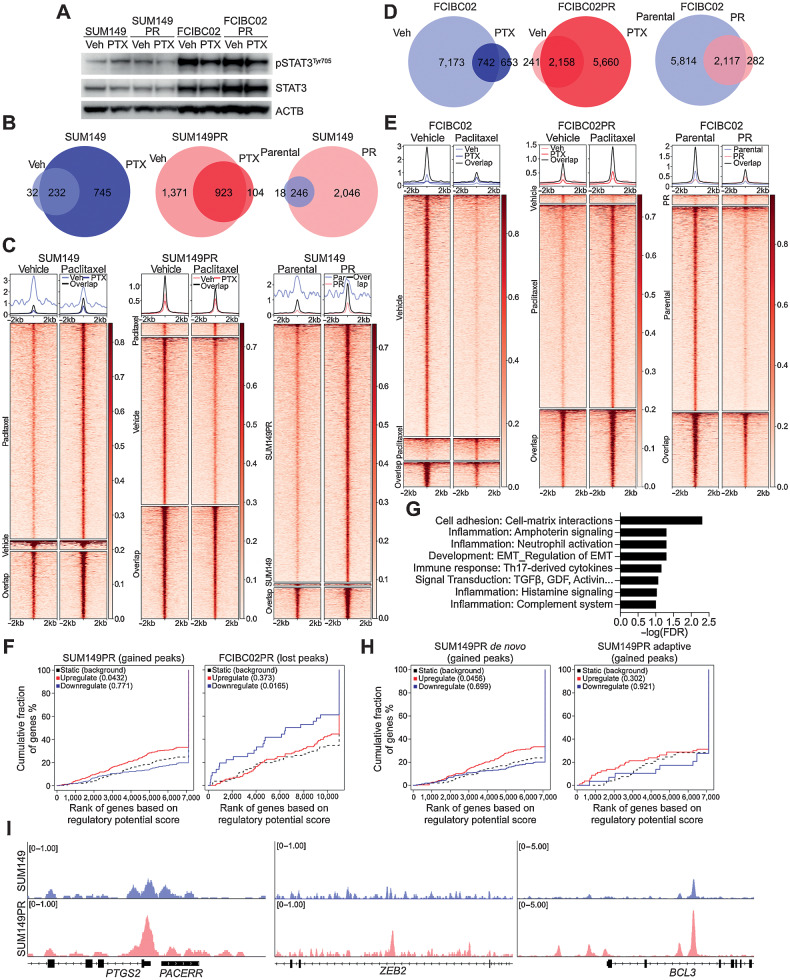
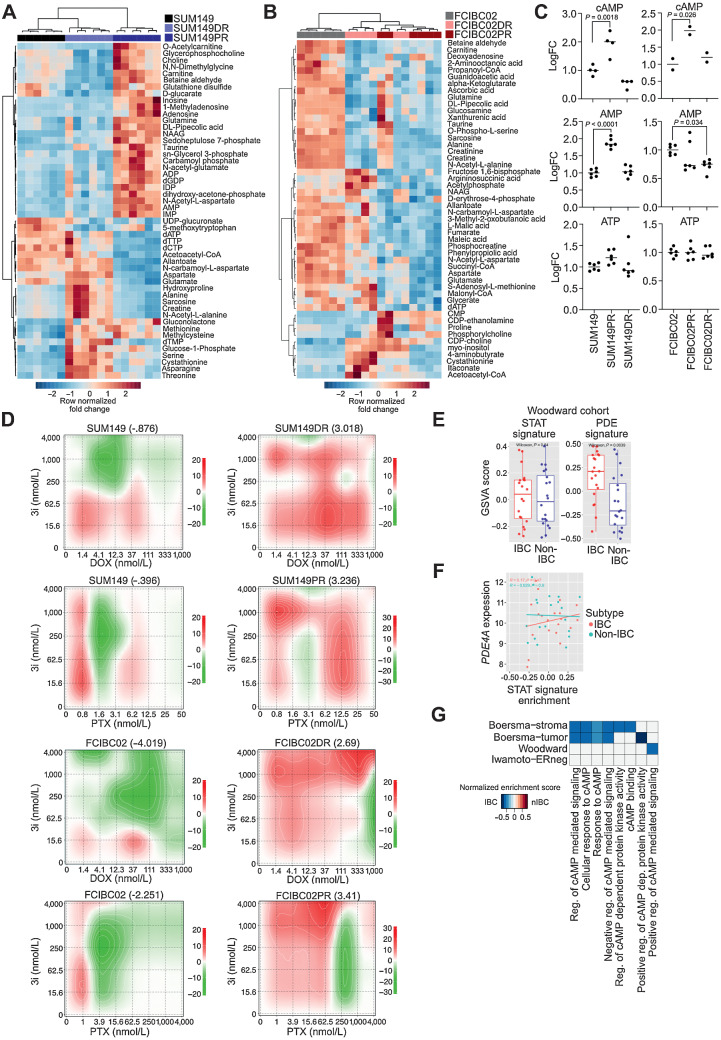
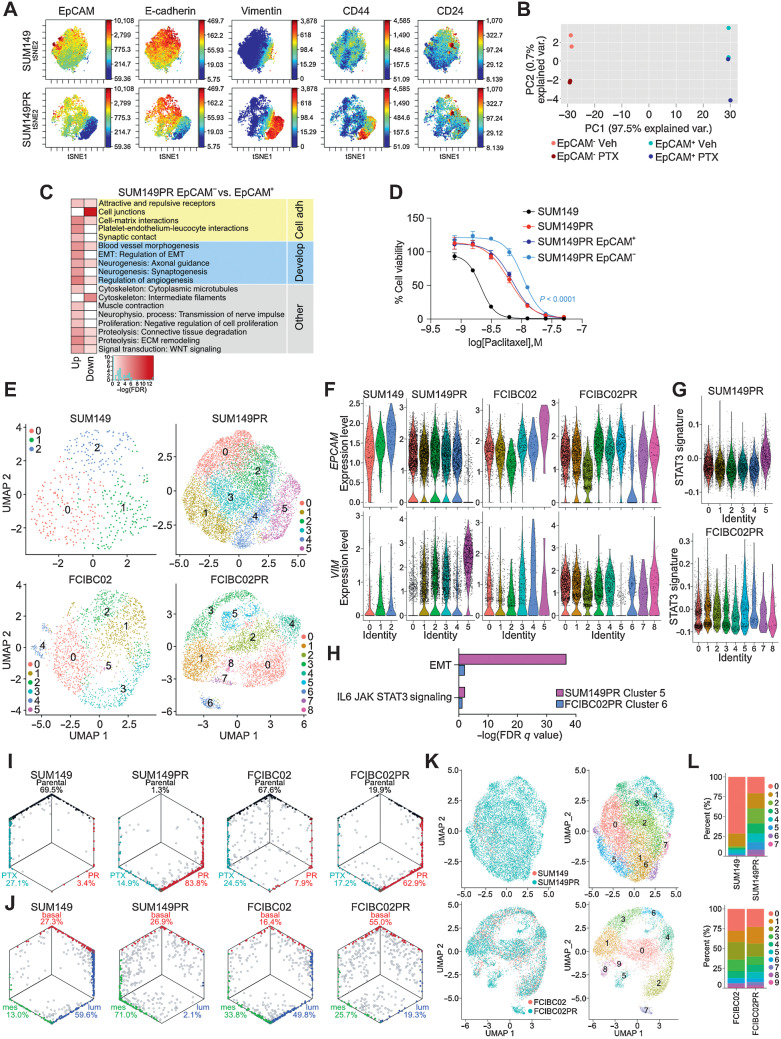
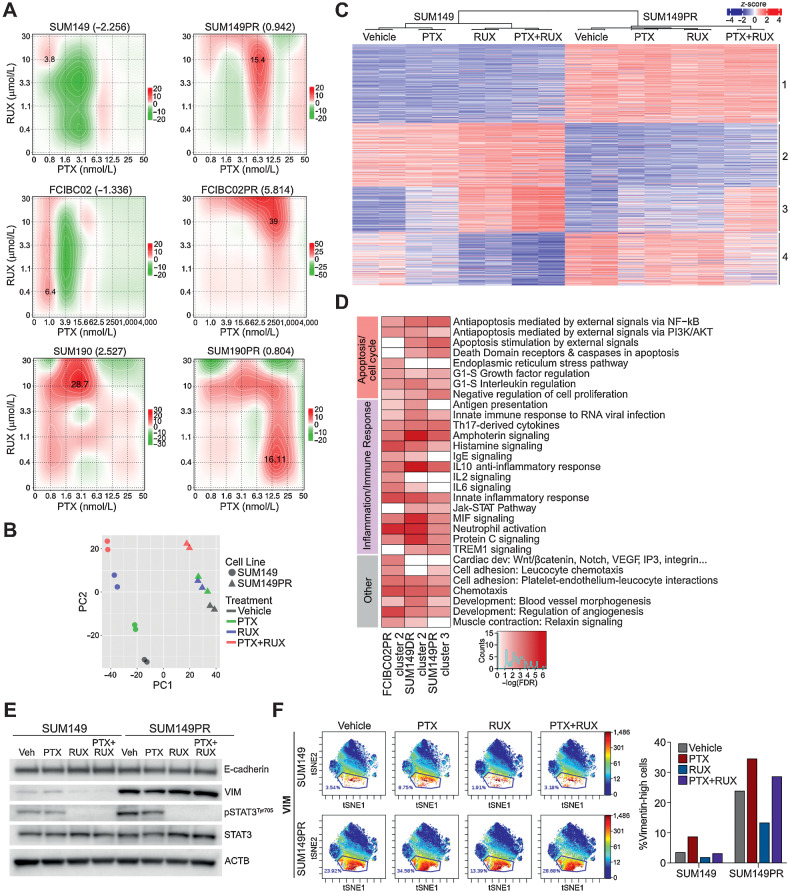
Inflammatory breast cancer (IBC) is a difficult-to-treat disease with poor clinical outcomes due to high risk of metastasis and resistance to treatment. In breast cancer, CD44+CD24- cells possess stem cell-like features and contribute to disease progression, and we previously described a CD44+CD24-pSTAT3+ breast cancer cell subpopulation that is dependent on JAK2/STAT3 signaling. Here we report that CD44+CD24- cells are the most frequent cell type in IBC and are commonly pSTAT3+. Combination of JAK2/STAT3 inhibition with paclitaxel decreased IBC xenograft growth more than either agent alone. IBC cell lines resistant to paclitaxel and doxorubicin were developed and characterized to mimic therapeutic resistance in patients. Multi-omic profiling of parental and resistant cells revealed enrichment of genes associated with lineage identity and inflammation in chemotherapy-resistant derivatives. Integrated pSTAT3 chromatin immunoprecipitation sequencing and RNA sequencing (RNA-seq) analyses showed pSTAT3 regulates genes related to inflammation and epithelial-to-mesenchymal transition (EMT) in resistant cells, as well as PDE4A, a cAMP-specific phosphodiesterase. Metabolomic characterization identified elevated cAMP signaling and CREB as a candidate therapeutic target in IBC. Investigation of cellular dynamics and heterogeneity at the single cell level during chemotherapy and acquired resistance by CyTOF and single cell RNA-seq identified mechanisms of resistance including a shift from luminal to basal/mesenchymal cell states through selection for rare preexisting subpopulations or an acquired change. Finally, combination treatment with paclitaxel and JAK2/STAT3 inhibition prevented the emergence of the mesenchymal chemo-resistant subpopulation. These results provide mechanistic rational for combination of chemotherapy with inhibition of JAK2/STAT3 signaling as a more effective therapeutic strategy in IBC.

Significance: Chemotherapy resistance in inflammatory breast cancer is driven by the JAK2/STAT3 pathway, in part via cAMP/PKA signaling and a cell state switch, which can be overcome using paclitaxel combined with JAK2 inhibitors.


Figures

None
Graphical abstract
Figure 1. Frequency of CD44+CD24−pSTAT3+ cells and dependency on JAK/STAT3 signaling in IBC. A, Representative immunofluorescence analysis of CD44, CD24, and pSTAT3 in IBC samples. Scale bars represent 10 μm. Nuclei are stained with DAPI. B, Percent of the four cell types in each IBC tumor of the indicated subtype. C, Percent pSTAT3+ cells in the four cell types (n = 33 patients). D, Percent pSTAT3+ cells within the four cell types in each tumor classified by subtype. E, Graphs depicting SUM149 (top) and SUM190 (bottom) xenograft tumor volume in mice treated with vehicle, paclitaxel (PTX), ruxolitinib (RUX), or the combination with green arrow depicting treatment start when tumors were first palpable (∼20 mm3 for SUM149 and ∼60 mm3 for SUM190). Error bars represent SEM, n = 5 mice with 2 tumors/mouse. P values were calculated by two-way ANOVA. F, Graph of tumor weights at endpoint from experiment shown in E. Error bars represent SD. G, Immunoblot analysis of pSTAT3 and STAT3 in xenografts. ACTB was used as a loading control. Dot plot depicts quantification of pSTAT3/STAT3 ratios. P values for B–D, F–G calculated by one-way ANOVA with Tukey multiple comparisons.
Figure 1.
Frequency of CD44+CD24pSTAT3+ cells and dependency on JAK/STAT3 signaling in IBC. A, Representative immunofluorescence analysis of CD44, CD24, and pSTAT3 in IBC samples. Scale bars, 10 μm. Nuclei were stained with DAPI. B, Percent of the four cell types in each IBC tumor of the indicated subtype. C, Percent pSTAT3+ cells in the four cell types (n = 33 patients). D, Percent pSTAT3+ cells within the four cell types in each tumor classified by subtype. E, Graphs depicting SUM149 (top) and SUM190 (bottom) xenograft tumor volume in mice treated with vehicle, paclitaxel (PTX), ruxolitinib (RUX), or the combination, with green arrow depicting treatment start when tumors were first palpable (∼20 mm3 for SUM149 and ∼60 mm3 for SUM190). Error bars, SEM; n = 5 mice with 2 tumors/mouse. P values were calculated by two-way ANOVA. F, Graph of tumor weights at endpoint from experiment shown in E. Error bars, SD. G, Immunoblot analysis of pSTAT3 and STAT3 in xenografts. ACTB was used as a loading control. Dot plot depicts quantification of pSTAT3/STAT3 ratios. P values for B–D and F–G calculated by one-way ANOVA with Tukey multiple comparisons.
Figure 2. Characterization of chemotherapy-resistant IBC cell lines. A, Cellular viability after paclitaxel or doxorubicin treatment of parental and resistant cells. Error bars represent SD (n = 3). P values determined by comparison of curves using F test. B, Selected genes from Supplementary Fig. S2A, which were mutated in resistant derivatives and either overlap with the COSMIC cancer database, were differentially expressed in pathway analysis, or were mutated in both paclitaxel-resistant cell lines. Highlighted genes in red correspond to chromatin modifiers. C, Principal component analysis of gene expression of parental and resistant cell lines treated with vehicle, paclitaxel (PTX), or doxorubicin (DOX). D, Heat map of significant differentially expressed genes between parental and resistant derivatives clustered by either their presence (adaptive) or absence (de novo) in parental paclitaxel treated cells compared with vehicle. E, Gene set enrichment analysis for Hallmark gene sets in the indicated resistant versus parental differential gene lists that were significantly enriched (FDR < 0.05). Color scale corresponds to −log(FDR q-value). F, Gene set variation analysis (GSVA) score showing relative enrichment of the Hallmark epithelial to EMT gene set in the indicated cell lines. G, GSVA analysis as in F for enrichment of the Hollern Myoepithelial Breast Tumor gene signature in SUM190 cell lines. P values for F and G calculated by Student t test.
Figure 2.
Characterization of chemotherapy-resistant IBC cell lines. A, Cellular viability after paclitaxel or doxorubicin treatment of parental and resistant cells. Error bars, SD (n = 3). P values determined by comparison of curves using F test. B, Selected genes from Supplementary Fig. S2A, which were mutated in resistant derivatives and either overlapped with the COSMIC cancer database, were differentially expressed in pathway analysis, or were mutated in both paclitaxel-resistant cell lines. Highlighted genes in red correspond to chromatin modifiers. C, Principal component analysis of gene expression of parental and resistant cell lines treated with vehicle, paclitaxel (PTX), or doxorubicin (DOX). D, Heat map of significant differentially expressed genes between parental and resistant derivatives clustered by either their presence (adaptive) or absence (de novo) in parental paclitaxel treated cells compared with vehicle. E, Gene set enrichment analysis for Hallmark gene sets in the indicated resistant versus parental differential gene lists that were significantly enriched (FDR < 0.05). Color scale corresponds to −log(FDR q-value). F, Gene set variation analysis (GSVA) score showing relative enrichment of the Hallmark EMT gene set in the indicated cell lines. G, GSVA analysis as in F for enrichment of the Hollern Myoepithelial Breast Tumor gene signature in SUM190 cell lines. P values for F and G calculated by Student t test.
Figure 3. pSTAT3 chromatin binding patterns in drug-sensitive and -resistant IBC cells. A, Western blot analysis of pSTAT3Tyr705, and STAT3 in the indicated cell lines following 24 hours of paclitaxel (PTX) treatment. ACTB used as loading control B, Venn diagram depicting overlap of pSTAT3Tyr705 ChIP-seq peaks between vehicle (Veh) and paclitaxel (PTX) treatment of SUM149 and SUM149PR cell lines. C, Heat map depicting pSTAT3Tyr705 peaks which are unique in vehicle (Veh) and paclitaxel (PTX) treated SUM149 and SUM149PR cells and the overlap between groups. The color key is the score of ChIP-seq signal over the selected genomic region, the signals across different genomic regions have been scaled to the same length. D, Venn diagram depicting overlap of pSTAT3Tyr705 peaks between Veh and PTX treatment of FCIBC02 and FCIBC02PR. E, Heat map of pSTAT3Tyr705 peaks in FCIBC02 and FCIBC02PR as shown in C. F, Integration of differential gene expression and pSTAT3Tyr705 targets by BETA analysis. The P value listed in the top left represents the significance of the up or down group relative to the unchanged (NON) group as determined by the Kolmogorov–Smirnov test. G, Process networks significantly enriched (FDR < 0.1) in genes that are upregulated in SUM149PR compared with SUM149 and are pSTAT3 targets only in SUM149PR cells. FDR calculated by MetaCore Enrichment Analysis test. H, BETA analysis as shown in F of integration of pSTAT3 targets and differentially expressed genes in either adaptive or de novo clusters as defined in Fig. 2D. I, Gene tracks depicting pSTAT3Tyr705 signal at selected genomic loci. X-axis shows position along the chromosome with gene structures drawn below. Y-axis shows genomic occupancy in units of rpm/bp.
Figure 3.
pSTAT3 chromatin binding patterns in drug-sensitive and -resistant IBC cells. A, Western blot analysis of pSTAT3Tyr705, and STAT3 in the indicated cell lines following 24 hours of paclitaxel (PTX) treatment. ACTB was used as loading control B, Venn diagram depicting overlap of pSTAT3Tyr705 ChIP-seq peaks between vehicle (Veh) and paclitaxel (PTX) treatment of SUM149 and SUM149PR cell lines. C, Heat map depicting pSTAT3Tyr705 peaks, which are unique in vehicle (Veh)- and paclitaxel (PTX)-treated SUM149 and SUM149PR cells and the overlap between groups. The color key is the score of ChIP-seq signal over the selected genomic region; the signals across different genomic regions have been scaled to the same length. D, Venn diagram depicting overlap of pSTAT3Tyr705 peaks between Veh and PTX treatment of FCIBC02 and FCIBC02PR. E, Heat map of pSTAT3Tyr705 peaks in FCIBC02 and FCIBC02PR as shown in C. F, Integration of differential gene expression and pSTAT3Tyr705 targets by BETA analysis. The P value listed in the top left represents the significance of the up or down group relative to the unchanged (NON) group as determined by the Kolmogorov–Smirnov test. G, Process networks significantly enriched (FDR < 0.1) in genes that are upregulated in SUM149PR compared with SUM149 and are pSTAT3 targets only in SUM149PR cells. FDR calculated by MetaCore Enrichment Analysis test. H, BETA analysis as shown in F of integration of pSTAT3 targets and differentially expressed genes in either adaptive or de novo clusters as defined in Fig. 2D. I, Gene tracks depicting pSTAT3Tyr705 signal at selected genomic loci. X-axis shows position along the chromosome with gene structures drawn below. Y-axis shows genomic occupancy in units of rpm/bp.
Figure 4. Metabolic reprogramming and upregulation of cAMP signaling in IBC resistance. A and B, Fold change metabolite abundance over SUM149 Parental (A) or FCIBC02 Parental (B) for top 50 differential metabolites in doxorubicin-resistant and paclitaxel-resistant cells as measured by LC/MS-MS. C, Relative abundance of cAMP, AMP, and ATP by LC/MS-MS (n = 6). P values calculated by one-way ANOVA. D, Synergy scores for cell lines treated with paclitaxel (PTX) or doxorubicin (DOX) in combination with the CREB inhibitor 3i (n = 3). Synergy was calculated using ZIP model where a score of 0 indicates an additive response and areas of red and green indicate synergistic and antagonistic dose regions, respectively. E, PDE gene-family and STAT (generated from KEGG) gene signature scores in a patient cohort (Woodward) featuring IBC and non-IBC patient samples. F, Correlation between STAT signature generated from KEGG and PDE4A expression in the Woodward cohort. G, Gene set enrichment scores of gene ontology cAMP-related pathways in IBC versus non-IBC (nIBC) patient samples (FDR < 0.1).
Figure 4.
Metabolic reprogramming and upregulation of cAMP signaling in IBC resistance. A and B, Fold change metabolite abundance over SUM149 Parental (A) or FCIBC02 Parental (B) for top 50 differential metabolites in doxorubicin-resistant and paclitaxel-resistant cells as measured by LC/MS-MS. C, Relative abundance of cAMP, AMP, and ATP by LC/MS-MS (n = 6). P values calculated by one-way ANOVA. D, Synergy scores for cell lines treated with paclitaxel (PTX) or doxorubicin (DOX) in combination with the CREB inhibitor 3i (n = 3). Synergy was calculated using ZIP model where a score of 0 indicates an additive response and areas of red and green indicate synergistic and antagonistic dose regions, respectively. E, PDE gene-family and STAT (generated from KEGG) gene signature scores in a patient cohort (Woodward) featuring IBC and non-IBC patient samples. F, Correlation between STAT signature generated from KEGG and PDE4A expression in the Woodward cohort. G, Gene set enrichment scores of gene ontology cAMP-related pathways in IBC versus non-IBC (nIBC) patient samples (FDR < 0.1).
Figure 5. Cellular heterogeneity and dynamics in the development of resistance. A, Selected viSNE maps of CyTOF analysis from Supplementary Fig. S6B of SUM149 and SUM149PR cells colored for expression of EpCAM, E-cadherin, vimentin, CD44, and CD24. Color scale indicates minimum and maximum values of expression. B, PCA plot depicting gene expression of SUM149PR EpCAM− and EpCAM+ cells treated with Vehicle (Veh) or paclitaxel (PTX). C, Process networks significantly enriched (FDR < 0.005) in genes up- or downregulated between SUM149PR EpCAM− and EpCAM+ cells. Color scale corresponds to –log(FDR) of significance of enrichment, calculated by MetaCore Enrichment Analysis test. D, Cellular viability after paclitaxel treatment of indicated cell lines. Error bars represent SD (n = 3). E, UMAP plots of cells from indicated cell lines by scRNA-seq, colored by cluster. Each point represents a single cell. F, Violin plots of EpCAM (top) and vimentin (bottom) expression levels in single cells clustered as shown in E. G, Violin plot of single cell expression of a STAT3 signature, generated by combination of differential gene expression between resistant and parental cells and pSTAT3 ChIP-seq resistant-only targets. Single cells clustered as in E. H, Subset of gene set enrichment analysis from Supplementary Fig. S7E of differentially expressed genes in EMT-like clusters (SUM149PR cluster 5, FCIBC02PR cluster 6) that were significantly enriched in the hallmark gene set for EMT and IL6/JAK/STAT3 signaling. I, Hexagonal plots showing classification of single cells as either Parental (black), Parental + Paclitaxel treatment (PTX, teal), or Paclitaxel resistant (PR, red) populations. J, Hexagonal plots depicting classification of single cells as either basal (red), mesenchymal (green), or luminal (blue), as defined by differential expression of bulk RNA-seq data from 34 TNBC cell lines. For I–J, gray cells are unclassified and mixed colors represent cells classified in both categories. Classifications were based on gene-centered expression data. K, Integrated scRNA-seq data colored by cell line (left) or by cluster (right). L, Bar plot depicting the percent of cells that belong to each cluster shown in K in parental and resistant cell lines.
Figure 5.
Cellular heterogeneity and dynamics in the development of resistance. A, Selected viSNE maps of CyTOF analysis from Supplementary Fig. S6B of SUM149 and SUM149PR cells colored for expression of EpCAM, E-cadherin, vimentin, CD44, and CD24. Color scale indicates minimum and maximum values of expression. B, Principal component analysis plot depicting gene expression of SUM149PR EpCAM and EpCAM+ cells treated with vehicle (Veh) or paclitaxel (PTX). C, Process networks significantly enriched (FDR < 0.005) in genes up- or downregulated between SUM149PR EpCAM and EpCAM+ cells. Color scale corresponds to –log(FDR) of significance of enrichment, calculated by MetaCore Enrichment Analysis test. D, Cellular viability after paclitaxel treatment of indicated cell lines. Error bars, SD (n = 3). E, Uniform Manifold Approximation and Projection plots of cells from indicated cell lines by scRNA-seq, colored by cluster. Each point represents a single cell. F, Violin plots of EpCAM (top) and vimentin (bottom) expression levels in single cells clustered as shown in E. G, Violin plot of single cell expression of a STAT3 signature, generated by combination of differential gene expression between resistant and parental cells and pSTAT3 ChIP-seq resistant-only targets. Single cells clustered as in E. H, Subset of gene set enrichment analysis from Supplementary Fig. S7E of differentially expressed genes in EMT-like clusters (SUM149PR cluster 5, FCIBC02PR cluster 6) that were significantly enriched in the hallmark gene set for EMT and IL6/JAK/STAT3 signaling. I, Hexagonal plots showing classification of single cells as either Parental (black), Parental + paclitaxel treatment (PTX; teal), or paclitaxel resistant (PR; red) populations. J, Hexagonal plots depicting classification of single cells as either basal (red), mesenchymal (green), or luminal (blue), as defined by differential expression of bulk RNA-seq data from 34 TNBC cell lines. For I and J, gray cells are unclassified and mixed colors represent cells classified in both categories. Classifications were based on gene-centered expression data. K, Integrated scRNA-seq data colored by cell line (left) or by cluster (right). L, Bar plot depicting the percent of cells that belong to each cluster shown in K in parental and resistant cell lines.
Figure 6. Mechanism of synergy of JAK inhibition with chemotherapeutic agents in drug-sensitive and resistant IBC cells. A, Synergy scores for combination of paclitaxel (PTX) and ruxolitinib (RUX) in the indicated cell lines. Calculated using ZIP model where a score of 0 indicates an additive response and areas of red and green indicate synergistic and antagonistic dose regions, respectively. B, PCA plot of gene expression of SUM149 and SUM149PR cells treated with vehicle, PTX, RUX, or the combination. C, Heat map depicting gene expression changes in SUM149 and SUM149PR cells after PTX, RUX, or PTX+RUX treatment. D, Process network enrichment analysis (FDR < 0.01) of up- and downregulated genes in the indicated clusters as defined by C and Supplementary Figs. S8D–S8E. Color scale corresponds to −log(FDR) of significance of enrichment, calculated by MetaCore Enrichment Analysis test. E, Western blot analysis of the indicated proteins in cell lines treated with PTX, RUX, or the combination for 72 hours. F, Selected viSNE maps from Supplementary Fig. S9 of CyTOF analysis of SUM149 and SUM149PR cells treated with indicated drugs for 14 days. Plots are colored for expression of vimentin (VIM) and gated for VIMhigh cells. Bar-plot is quantification of VIMhigh cells from gates shown in viSNE plots.
Figure 6.
Mechanism of synergy of JAK inhibition with chemotherapeutic agents in drug-sensitive and -resistant IBC cells. A, Synergy scores for combination of paclitaxel (PTX) and ruxolitinib (RUX) in the indicated cell lines. Calculated using ZIP model where a score of 0 indicates an additive response and areas of red and green indicate synergistic and antagonistic dose regions, respectively. B, PCA plot of gene expression of SUM149 and SUM149PR cells treated with vehicle, PTX, RUX, or the combination. C, Heat map depicting gene expression changes in SUM149 and SUM149PR cells after PTX, RUX, or PTX+RUX treatment. D, Process network enrichment analysis (FDR < 0.01) of up- and downregulated genes in the indicated clusters as defined by C and Supplementary Figs. S8D–S8E. Color scale corresponds to −log(FDR) of significance of enrichment, calculated by MetaCore Enrichment Analysis test. E, Western blot analysis of the indicated proteins in cell lines treated with PTX, RUX, or the combination for 72 hours. F, Selected viSNE maps from Supplementary Fig. S9 of CyTOF analysis of SUM149 and SUM149PR cells treated with indicated drugs for 14 days. Plots are colored for expression of vimentin (VIM) and gated for VIMhigh cells. Bar-plot is quantification of VIMhigh cells from gates shown in viSNE plots.

Similar articles

Cited by

References

    1. Abraham HG, Xia Y, Mukherjee B, Merajver SD. Incidence and survival of inflammatory breast cancer between 1973 and 2015 in the SEER database. Breast Cancer Res Treat 2021;185:229–38. - PubMed
    1. Garrido-Castro AC, Lin NU, Polyak K. Insights into molecular classifications of triple-negative breast cancer: improving patient selection for treatment. Cancer Discov 2019;9:176–98. - PMC - PubMed
    1. Bertucci F, Finetti P, Rougemont J, Charafe-Jauffret E, Nasser V, Loriod B, et al. Gene expression profiling for molecular characterization of inflammatory breast cancer and prediction of response to chemotherapy. Cancer Res 2004;64:8558–65. - PubMed
    1. Vermeulen PB, van Golen KL, Dirix LY. Angiogenesis, lymphangiogenesis, growth pattern, and tumor emboli in inflammatory breast cancer: a review of the current knowledge. Cancer 2010;116:2748–54. - PubMed
    1. Kleer CG, Griffith KA, Sabel MS, Gallagher G, van Golen KL, Wu ZF, et al. RhoC-GTPase is a novel tissue biomarker associated with biologically aggressive carcinomas of the breast. Breast Cancer Res Treat 2005;93:101–10. - PubMed

Publication types