. 2023 Jan 18;83(2):316-331.
doi: 10.1158/0008-5472.CAN-22-0883.

Loss of NF1 in Melanoma Confers Sensitivity to SYK Kinase Inhibition

Affiliations

Loss of NF1 in Melanoma Confers Sensitivity to SYK Kinase Inhibition

Cara Abecunas et al. Cancer Res. .

Abstract

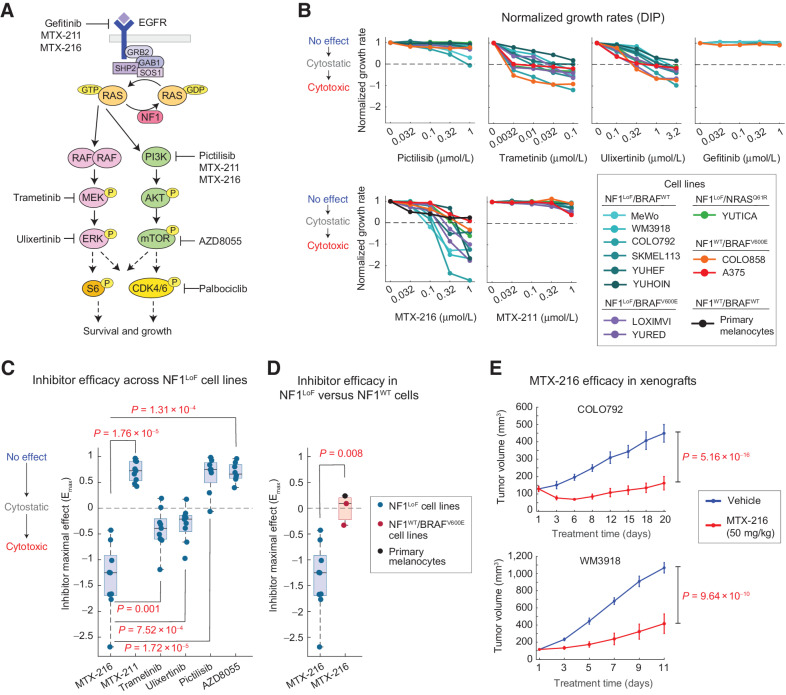
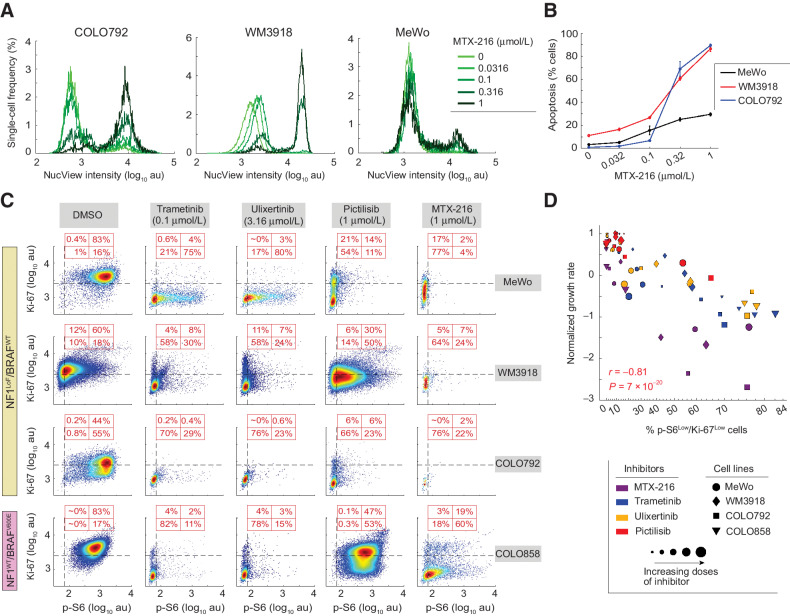
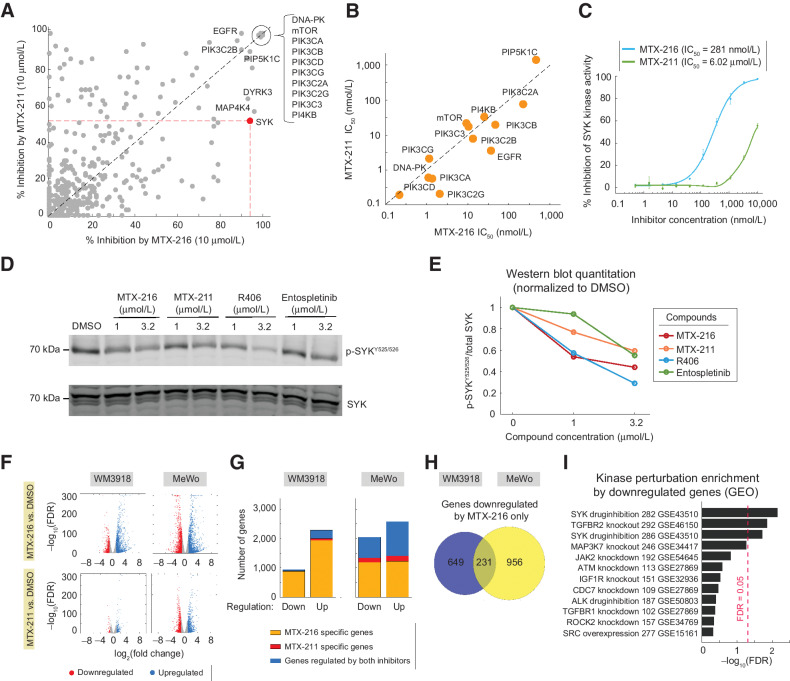
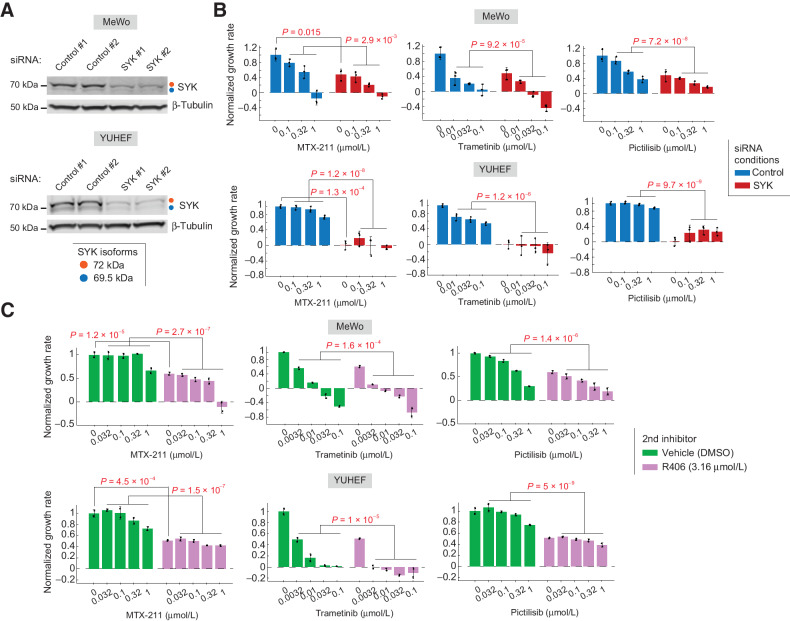
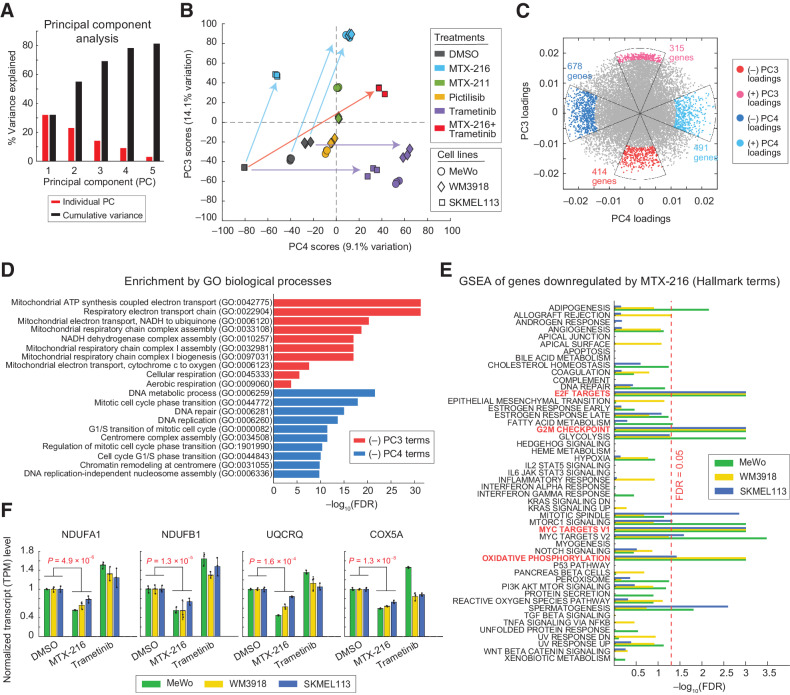
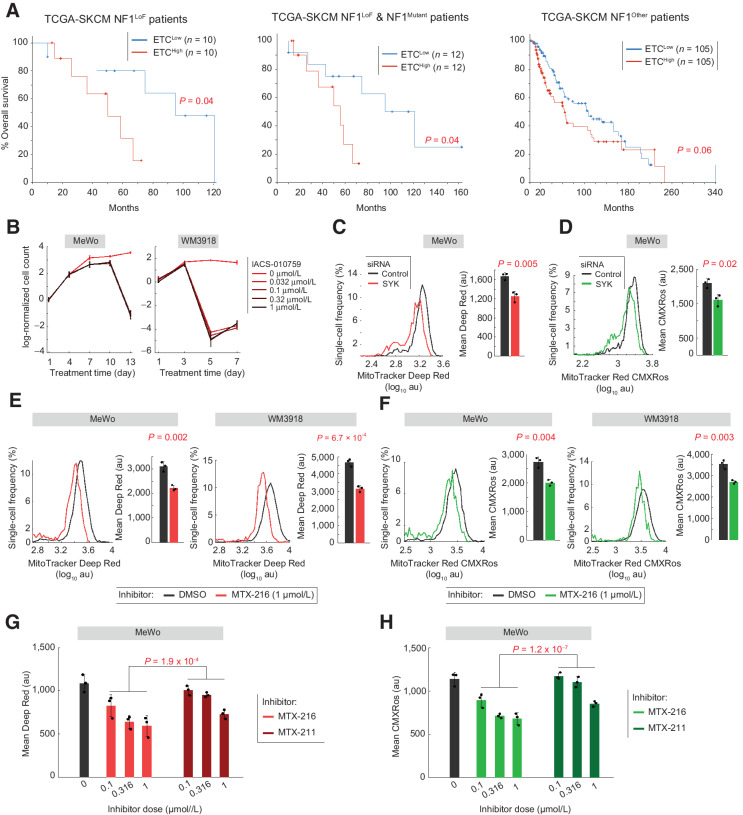
Neurofibromin 1 (NF1) loss of function (LoF) mutations are frequent in melanoma and drive hyperactivated RAS and tumor growth. NF1LoF melanoma cells, however, do not show consistent sensitivity to individual MEK, ERK, or PI3K/mTOR inhibitors. To identify more effective therapeutic strategies for treating NF1LoF melanoma, we performed a targeted kinase inhibitor screen. A tool compound named MTX-216 was highly effective in blocking NF1LoF melanoma growth in vitro and in vivo. Single-cell analysis indicated that drug-induced cytotoxicity was linked to effective cosuppression of proliferation marker Ki-67 and ribosomal protein S6 phosphorylation. The antitumor efficacy of MTX-216 was dependent on its ability to inhibit not only PI3K, its nominal target, but also SYK. MTX-216 suppressed expression of a group of genes that regulate mitochondrial electron transport chain and are associated with poor survival in patients with NF1LoF melanoma. Furthermore, combinations of inhibitors targeting either MEK or PI3K/mTOR with an independent SYK kinase inhibitor or SYK knockdown reduced the growth of NF1LoF melanoma cells. These studies provide a path to exploit SYK dependency to selectively target NF1LoF melanoma cells.

Significance: A kinase inhibitor screen identifies SYK as a targetable vulnerability in melanoma cells with NF1 loss of function.


Figures

Figure 1. MTX-216 blocks tumor growth in NF1LoF melanomas in vitro and in vivo. A, A simplified schematic illustration of the function of NF1 in the context of RAS-mediated activation of ERK and PI3K/mTOR signaling. The nominal targets for kinase inhibitors tested in this study are highlighted. B, Dose-dependent changes in normalized growth rates (a.k.a DIP rates) across cell lines with different NF1/BRAF/NRAS mutation status or primary epidermal melanocytes. The average net growth rates for each condition were calculated from measurements of live cell count (across two replicates) at four timepoints (including 1, 3, 5, and 7 days). Inhibitor maximal effect (Emax), defined as the normalized growth rate evaluated at the highest tested concentration, of different inhibitors across NF1LoF melanoma cell lines (C) and between NF1LoF cell lines and NF1WT cells, including two BRAFV600E melanoma cell lines and primary melanocytes (D). Statistical significance was determined by two-sided, paired-sample t test (C) or two-sided, two-sample t test (D). E, Mice bearing xenografts of COLO792 cells (top) and WM3918 cells (bottom) were treated with MTX-216 or vehicle for a period of 20 and 11 days, respectively, to determine the effect on tumor growth. Tumor volume data represent mean values ± SEM across 4 mice per group (in case of COLO792) or 5 mice per group (in case of WM3918). Statistical significance was determined by two-way ANOVA.
Figure 1.
MTX-216 blocks tumor growth in NF1LoF melanomas in vitro and in vivo. A, A simplified schematic illustration of the function of NF1 in the context of RAS-mediated activation of ERK and PI3K/mTOR signaling. The nominal targets for kinase inhibitors tested in this study are highlighted. B, Dose-dependent changes in normalized growth rates (aka DIP rates) across cell lines with different NF1/BRAF/NRAS mutation status or primary epidermal melanocytes. The average net growth rates for each condition were calculated from measurements of live cell count (across two replicates) at four time points (including 1, 3, 5, and 7 days). C and D, Inhibitor maximal effect (Emax), defined as the normalized growth rate evaluated at the highest tested concentration, of different inhibitors across NF1LoF melanoma cell lines (C) and between NF1LoF cell lines and NF1WT cells, including two BRAFV600E melanoma cell lines and primary melanocytes (D). Statistical significance was determined by two-sided, paired-sample t test (C) or two-sided, two-sample t test (D). E, Mice bearing xenografts of COLO792 cells (top) and WM3918 cells (bottom) were treated with MTX-216 or vehicle for a period of 20 and 11 days, respectively, to determine the effect on tumor growth. Tumor volume data represent mean values ± SEM across 4 mice per group (in case of COLO792) or 5 mice per group (in case of WM3918). Statistical significance was determined by two-way ANOVA.
Figure 2. MTX-216 cosuppresses Ki-67 and p-S6 and induces apoptosis in NF1LoF cells. A and B, MTX-216 dose-dependent changes in apoptotic response of COLO792 cells (after 48 hours) and WM3918 and MeWo cells (after 72 hours), measured using a NucView Caspase-3/7 reporter assay. Single-cell NucView intensities across different inhibitor doses (A) and the estimation of the percentage of apoptotic cells based on NucView intensity gating (B) are shown for each cell line. Data are presented as mean values ± SD calculated across n = 2 replicates. C, Covariate single-cell analysis of p-S6 versus Ki-67 across three NF1LoF/BRAFWT melanoma cell lines (MeWo, WM3918, and COLO792) and one NF1WT/BRAFV600E cell line (COLO858) treated for 72 hours with indicated concentrations of MTX-216, trametinib, ulixertinib, and pictilisib. The horizontal and vertical dash lines were used to gate Ki-67High versus Ki-67Low cells and p-S6High versus p-S6Low cells, respectively. Percentages of cells in each quadrant are shown in red. D, Two-sided Pearson correlation analysis between the percentage of p-S6Low/Ki-67Low cells (measured after 72 hours of treatment) and the inhibitor-induced normalized growth rate across three NF1LoF/BRAFWT melanoma cell lines (MeWo, WM3918, and COLO792) and one NF1WT/BRAFV600E cell line (COLO858) treated with MTX-216, trametinib, ulixertinib, and pictilisib (at the same concentrations as shown in Fig. 1B).
Figure 2.
MTX-216 cosuppresses Ki-67 and p-S6 and induces apoptosis in NF1LoF cells. A and B, MTX-216 dose-dependent changes in apoptotic response of COLO792 cells (after 48 hours) and WM3918 and MeWo cells (after 72 hours), measured using a NucView Caspase-3/7 reporter assay. Single-cell NucView intensities across different inhibitor doses (A) and the estimation of the percentage of apoptotic cells based on NucView intensity gating (B) are shown for each cell line. Data are presented as mean values ± SD calculated across n = 2 replicates. C, Covariate single-cell analysis of p-S6 versus Ki-67 across three NF1LoF/BRAFWT melanoma cell lines (MeWo, WM3918, and COLO792) and one NF1WT/BRAFV600E cell line (COLO858) treated for 72 hours with indicated concentrations of MTX-216, trametinib, ulixertinib, and pictilisib. The horizontal and vertical dash lines were used to gate Ki-67High versus Ki-67Low cells and p-S6High versus p-S6Low cells, respectively. Percentages of cells in each quadrant are shown in red. D, Two-sided Pearson correlation analysis between the percentage of p-S6Low/Ki-67Low cells (measured after 72 hours of treatment) and the inhibitor-induced normalized growth rate across three NF1LoF/BRAFWT melanoma cell lines (MeWo, WM3918, and COLO792) and one NF1WT/BRAFV600E cell line (COLO858) treated with MTX-216, trametinib, ulixertinib, and pictilisib (at the same concentrations as shown in Fig. 1B).
Figure 3. SYK kinase activity is more effectively inhibited by MTX-216 than by MTX-211. A, High-throughput kinase inhibition assays (using Z’-LYTE and Adapta platforms) reporting percent inhibition of 403 kinases by MTX-216 and MTX-211 (both at 10 μmol/L) in the presence of ATP at a concentration of Km,app for each target. Dashed line represents y = x. B, IC50 values for the nominal targets of MTX-216 and MTX-211 (PI3K and EGFR) as well as other kinases that were inhibited significantly (>90%) by both compounds (at 10 μmol/L). IC50 values were derived from kinase activity assays performed across 10 concentrations of each compound. Dashed line represents y = x. C, Dose-dependent inhibition of SYK kinase activity by MTX-216 and MTX-211. SYK kinase inhibition was profiled using Z’-LYTE assay in the presence of indicated concentrations of each compound. Data are presented as mean values ± SD calculated across n = 2 replicates. WB measurements (D) and their quantification (E) for p-SYKY525/526 relative to total SYK in MeWo cells treated for 24 hours with indicated concentrations of MTX-216, MTX-211, R406, and entospletinib. Antibodies were costained on the same blot. Data across different treatments conditions are normalized to DMSO-treated cells. F, Differentially upregulated or downregulated genes by MTX-216 and MTX-211 (relative to DMSO) following 24 hours treatment in WM3918 and MeWo cells. Significant genes were identified as |log2(fold change)| ≥ 1 and adjusted P value (FDR) ≤ 0.05. G, Number of significant genes upregulated or downregulated by only one of the compounds or by both compounds in each of the WM3918 and MeWo cell lines. H, Number of genes downregulated specifically by MTX-216 in either or both of WM3918 and MeWo cell lines. I, Top enriched kinase perturbation terms associated with 231 genes downregulated specifically by MTX-216 (but not by MTX-211) in both WM3918 and MeWo cell lines.
Figure 3.
SYK kinase activity is more effectively inhibited by MTX-216 than by MTX-211. A, High-throughput kinase inhibition assays (using Z’-LYTE and Adapta platforms) reporting percent inhibition of 403 kinases by MTX-216 and MTX-211 (both at 10 μmol/L) in the presence of ATP at a concentration of Km,app for each target. Dashed line represents y = x. B, IC50 values for the nominal targets of MTX-216 and MTX-211 (PI3K and EGFR) as well as other kinases that were inhibited significantly (>90%) by both compounds (at 10 μmol/L). IC50 values were derived from kinase activity assays performed across 10 concentrations of each compound. Dashed line represents y = x. C, Dose-dependent inhibition of SYK kinase activity by MTX-216 and MTX-211. SYK kinase inhibition was profiled using Z’-LYTE assay in the presence of indicated concentrations of each compound. Data are presented as mean values ± SD calculated across n = 2 replicates. D and E, WB measurements (D) and their quantification (E) for p-SYKY525/526 relative to total SYK in MeWo cells treated for 24 hours with indicated concentrations of MTX-216, MTX-211, R406, and entospletinib. Antibodies were costained on the same blot. Data across different treatments conditions are normalized to DMSO-treated cells. F, Differentially upregulated or downregulated genes by MTX-216 and MTX-211 (relative to DMSO) following 24 hours treatment in WM3918 and MeWo cells. Significant genes were identified as |log2(fold change)| ≥ 1 and adjusted P value (FDR) ≤ 0.05. G, Number of significant genes upregulated or downregulated by only one of the compounds or by both compounds in each of the WM3918 and MeWo cell lines. H, Number of genes downregulated specifically by MTX-216 in either or both of WM3918 and MeWo cell lines. I, Top enriched kinase perturbation terms associated with 231 genes downregulated specifically by MTX-216 (but not by MTX-211) in both WM3918 and MeWo cell lines.
Figure 4. SYK inhibition or depletion reduces the growth of NF1LoF melanoma cells and increases their sensitivity to both PI3K and MEK inhibitors. A, SYK protein levels assessed by WBs in MeWo (top) and YUHEF cells (bottom) following treatment with siRNAs targeting SYK isoforms or with nontargeting (control) siRNA for 72 hours. Antibodies were costained on the same blot. Each siRNA experiment was performed in two independent replicates. B, Normalized growth rates measured in MeWo (top) and YUHEF cells (bottom) following 72 hours treatment with indicated concentrations of MTX-211, trametinib, or pictilisib (all dissolved in DMSO as vehicle) in the presence of siRNAs targeting SYK or nontargeting (control) siRNA (for 72 hours). Data are presented as mean values ± SD calculated across n = 3 replicates. Statistical significance of the effect of SYK siRNA (vs. control siRNA) in the absence of all inhibitors was determined by two-sided, two-sample t test. Statistical significance of the effect of SYK siRNA (vs. control siRNA) in the presence of inhibitors at three indicated concentrations was determined by two-way ANOVA. C, Normalized growth rates measured in MeWo (top) and YUHEF cells (bottom) following 7-day treatments with indicated concentrations of MTX-211, trametinib, or pictilisib in combination with either R406 (at 3.16 μmol/L) or vehicle (DMSO). Data are presented as mean values ± SD calculated across n = 2 replicates. Statistical significance of the effect of R406 (vs. DMSO) in the absence of other inhibitors was determined by two-sided, two-sample t test. Statistical significance of the effect of R406 (vs. DMSO) in the presence of other inhibitors at four indicated concentrations was determined by two-way ANOVA.
Figure 4.
SYK inhibition or depletion reduces the growth of NF1LoF melanoma cells and increases their sensitivity to both PI3K and MEK inhibitors. A, SYK protein levels assessed by WBs in MeWo (top) and YUHEF cells (bottom) following treatment with siRNAs targeting SYK isoforms or with nontargeting (control) siRNA for 72 hours. Antibodies were costained on the same blot. Each siRNA experiment was performed in two independent replicates. B, Normalized growth rates measured in MeWo (top) and YUHEF (bottom) cells following 72 hours treatment with indicated concentrations of MTX-211, trametinib, or pictilisib (all dissolved in DMSO as vehicle) in the presence of siRNAs targeting SYK or nontargeting (control) siRNA (for 72 hours). Data are presented as mean values ± SD calculated across n = 3 replicates. Statistical significance of the effect of SYK siRNA (vs. control siRNA) in the absence of all inhibitors was determined by two-sided, two-sample t test. Statistical significance of the effect of SYK siRNA (vs. control siRNA) in the presence of inhibitors at three indicated concentrations was determined by two-way ANOVA. C, Normalized growth rates measured in MeWo (top) and YUHEF (bottom) cells following 7-day treatments with indicated concentrations of MTX-211, trametinib, or pictilisib in combination with either R406 (at 3.16 μmol/L) or vehicle (DMSO). Data are presented as mean values ± SD calculated across n = 2 replicates. Statistical significance of the effect of R406 (vs. DMSO) in the absence of other inhibitors was determined by two-sided, two-sample t test. Statistical significance of the effect of R406 (vs. DMSO) in the presence of other inhibitors at four indicated concentrations was determined by two-way ANOVA.
Figure 5. MTX-216 suppresses mitochondrial ETC genes in NF1LoF cells. A–C, PCA of gene expression variations across 42 samples, representing three cell lines (MeWo, WM3918, and SKMEL113) and 24 hours treatment conditions with MTX-216 (at 1 μmol/L), MTX-211 (at 1 μmol/L), pictilisib (at 1 μmol/L), trametinib (at 0.1 μmol/L), the combination of MTX-216 (at 1 μmol/L), and trametinib (at 0.1 μmol/L), or DMSO, each tested in three independent replicates. A, Percentage of variance captured by the first five PCs (PCs). B, PC3 and PC4 scores, capturing treatment-specific variations in gene expression across the samples. Arrows show changes of scores (in PC3-PC4 space) by specific treatments relative to DMSO-treated cells. C, PC3 and PC4 loadings, highlighting genes associated with distinct inhibitory effects on NF1LoF cells. Gene loadings differentially enriched along either PC3 or PC4 are highlighted in color. D, The top GO terms with FDR ≤ 0.05 associated with significantly negative PC3 and significantly negative PC4 loadings. E, GSEA of genes downregulated by MTX-216 in three cell lines (MeWo, WM3918, and SKMEL113) using consolidated Hallmark gene sets. Hallmark terms with FDR ≤ 0.05 in all three cell lines are highlighted in red. F, DMSO-normalized gene expression (TPM) levels of ETC genes NDUFA1, NDUFB1, UQCRQ, and COX5A in three cell lines following 24 hours treatment with MTX-216 and trametinib. Data are presented as mean values ± SD calculated across n = 3 replicates. Statistical significance was determined by two-way ANOVA.
Figure 5.
MTX-216 suppresses mitochondrial ETC genes in NF1LoF cells. A–C, PCA of gene expression variations across 42 samples, representing three cell lines (MeWo, WM3918, and SKMEL113) and 24 hours treatment conditions with MTX-216 (at 1 μmol/L), MTX-211 (at 1 μmol/L), pictilisib (at 1 μmol/L), trametinib (at 0.1 μmol/L), the combination of MTX-216 (at 1 μmol/L), and trametinib (at 0.1 μmol/L), or DMSO, each tested in three independent replicates. A, Percentage of variance captured by the first five PCs. B, PC3 and PC4 scores capturing treatment-specific variations in gene expression across the samples. Arrows show changes of scores (in PC3-PC4 space) by specific treatments relative to DMSO-treated cells. C, PC3 and PC4 loadings highlighting genes associated with distinct inhibitory effects on NF1LoF cells. Gene loadings differentially enriched along either PC3 or PC4 are highlighted in color. D, The top GO terms with FDR ≤ 0.05 associated with significantly negative PC3 and significantly negative PC4 loadings. E, GSEA of genes downregulated by MTX-216 in three cell lines (MeWo, WM3918, and SKMEL113) using consolidated Hallmark gene sets. Hallmark terms with FDR ≤ 0.05 in all three cell lines are highlighted in red. F, DMSO-normalized gene expression (TPM) levels of ETC genes NDUFA1, NDUFB1, UQCRQ, and COX5A in three cell lines following 24 hours treatment with MTX-216 and trametinib. Data are presented as mean values ± SD calculated across n = 3 replicates. Statistical significance was determined by two-way ANOVA.
Figure 6. Mitochondrial respiratory chain is associated with poor survival in patients with NF1LoF melanoma and inhibitable by MTX-216 or SYK inhibition. A, Overall survival analysis of patients with ETCHigh or ETCLow tumors. The analysis was performed in three groups of patients: patients with NF1LoF tumors (left), patients with either NF1LoF or NF1Mutant tumors (middle), and patients with no significant NF1 mutations; NF1Other (right). Statistical significance was determined by two-sided log-rank (Mantel–Cox) test. B, Log-normalized changes in live cell count following the exposure of two cell lines MeWo and WM3918 to indicated doses of IACS-010759 for a period of 13 and 7 days, respectively. Data are presented as mean values ± SD calculated across n = 2 replicates. C and D, Changes in mitochondrial mass measured by MitoTracker Deep Red (C), and mitochondrial membrane potential measured by MitoTracker Red CMXRos (D), in MeWo cells in the presence of SYK siRNAs or nontargeting (control) siRNA for 72 hours. Single-cell intensities (left) and the population-averaged data (right) are shown for each measurement. Population-averaged data are presented as mean values ± SD calculated across n = 3 replicates. Statistical significance was determined by two-sided, two-sample t test. Changes in mitochondrial mass measured by MitoTracker Deep Red (E), and mitochondrial membrane potential measured by MitoTracker Red CMXRos (F), in MeWo and WM3918 cells following 48 hours treatment with MTX-216 (at 1 μmol/L) or DMSO. Single-cell intensities (left) and the population-averaged data (right) are shown for each measurement. Population-averaged data are presented as mean values ± SD calculated across n = 3 replicates. Statistical significance was determined by two-sided, two-sample t test. Changes in mitochondrial mass measured by MitoTracker Deep Red (G), and mitochondrial membrane potential measured by MitoTracker Red CMXRos (H), in MeWo cells following 48 hours treatment with different concentrations of MTX-216, MTX-211, or DMSO. Population-averaged data are presented as mean values ± SD calculated across n = 3 replicates. Statistical significance was determined by two-way ANOVA.
Figure 6.
Mitochondrial respiratory chain is associated with poor survival in patients with NF1LoF melanoma and inhibitable by MTX-216 or SYK inhibition. A, Overall survival analysis of patients with ETCHigh or ETCLow tumors. The analysis was performed in three groups of patients: patients with NF1LoF tumors (left), patients with either NF1LoF or NF1Mutant tumors (middle), and patients with no significant NF1 mutations; NF1Other (right). Statistical significance was determined by two-sided log-rank (Mantel–Cox) test. B, Log-normalized changes in live cell count following the exposure of two cell lines MeWo and WM3918 to indicated doses of IACS-010759 for a period of 13 and 7 days, respectively. Data are presented as mean values ± SD calculated across n = 2 replicates. C and D, Changes in mitochondrial mass measured by MitoTracker Deep Red (C) and mitochondrial membrane potential measured by MitoTracker Red CMXRos (D) in MeWo cells in the presence of SYK siRNAs or nontargeting (control) siRNA for 72 hours. Single-cell intensities (left) and the population-averaged data (right) are shown for each measurement. Population-averaged data are presented as mean values ± SD calculated across n = 3 replicates. Statistical significance was determined by two-sided, two-sample t test. E and F, Changes in mitochondrial mass measured by MitoTracker Deep Red (E) and mitochondrial membrane potential measured by MitoTracker Red CMXRos (F) in MeWo and WM3918 cells following 48 hours treatment with MTX-216 (at 1 μmol/L) or DMSO. Single-cell intensities (left) and the population-averaged data (right) are shown for each measurement. Population-averaged data are presented as mean values ± SD calculated across n = 3 replicates. Statistical significance was determined by two-sided, two-sample t test. G and H, Changes in mitochondrial mass measured by MitoTracker Deep Red (G) and mitochondrial membrane potential measured by MitoTracker Red CMXRos (H) in MeWo cells following 48 hours treatment with different concentrations of MTX-216, MTX-211, or DMSO. Population-averaged data are presented as mean values ± SD calculated across n = 3 replicates. Statistical significance was determined by two-way ANOVA.

Similar articles

Cited by

References

    1. Cancer Genome Atlas Network. Genomic classification of cutaneous melanoma. Cell 2015;161:1681–96. - PMC - PubMed
    1. Krauthammer M, Kong Y, Bacchiocchi A, Evans P, Pornputtapong N, Wu C, et al. . Exome sequencing identifies recurrent mutations in NF1 and RASopathy genes in sun-exposed melanomas. Nat Genet 2015;47:996–1002. - PMC - PubMed
    1. Sullivan RJ. The role of mitogen-activated protein targeting in melanoma beyond BRAFV600. Curr Opin Oncol 2016;28:185–91. - PubMed
    1. Hayward NK, Wilmott JS, Waddell N, Johansson PA, Field MA, Nones K, et al. . Whole-genome landscapes of major melanoma subtypes. Nature 2017;545:175–80. - PubMed
    1. Maertens O, Johnson B, Hollstein P, Frederick DT, Cooper ZA, Messiaen L, et al. . Elucidating distinct roles for NF1 in melanomagenesis. Cancer Discov 2013;3:338–49. - PMC - PubMed

Publication types

MeSH terms