. 2022 Nov 29;119(48):e2212659119.
doi: 10.1073/pnas.2212659119. Epub 2022 Nov 21.

Inflammatory platelet production stimulated by tyrosyl-tRNA synthetase mimicking viral infection

Affiliations

Inflammatory platelet production stimulated by tyrosyl-tRNA synthetase mimicking viral infection

Yosuke Morodomi et al. Proc Natl Acad Sci U S A. .

Abstract

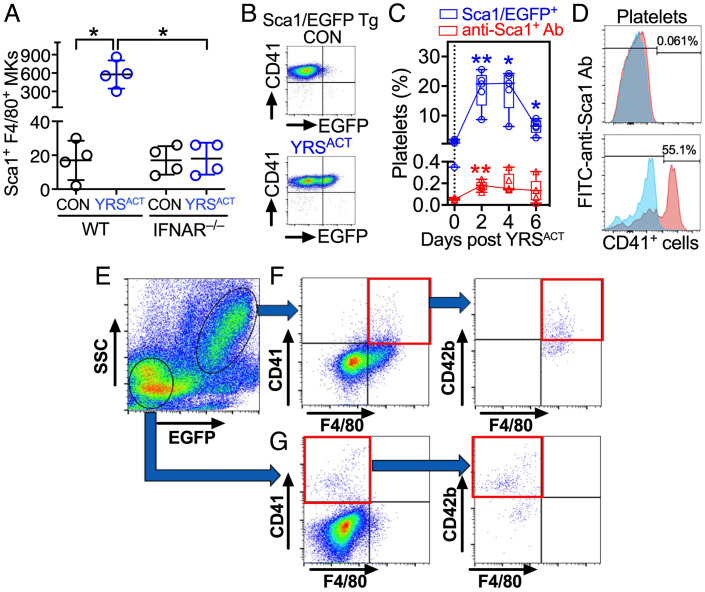
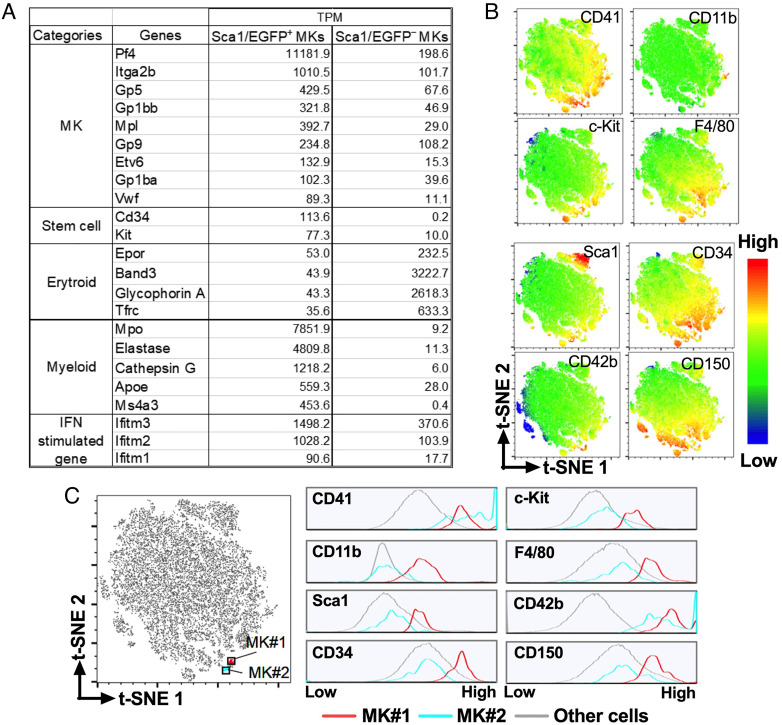
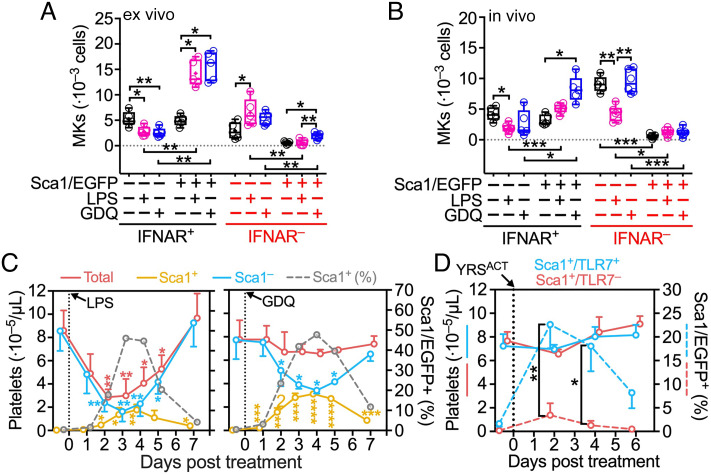
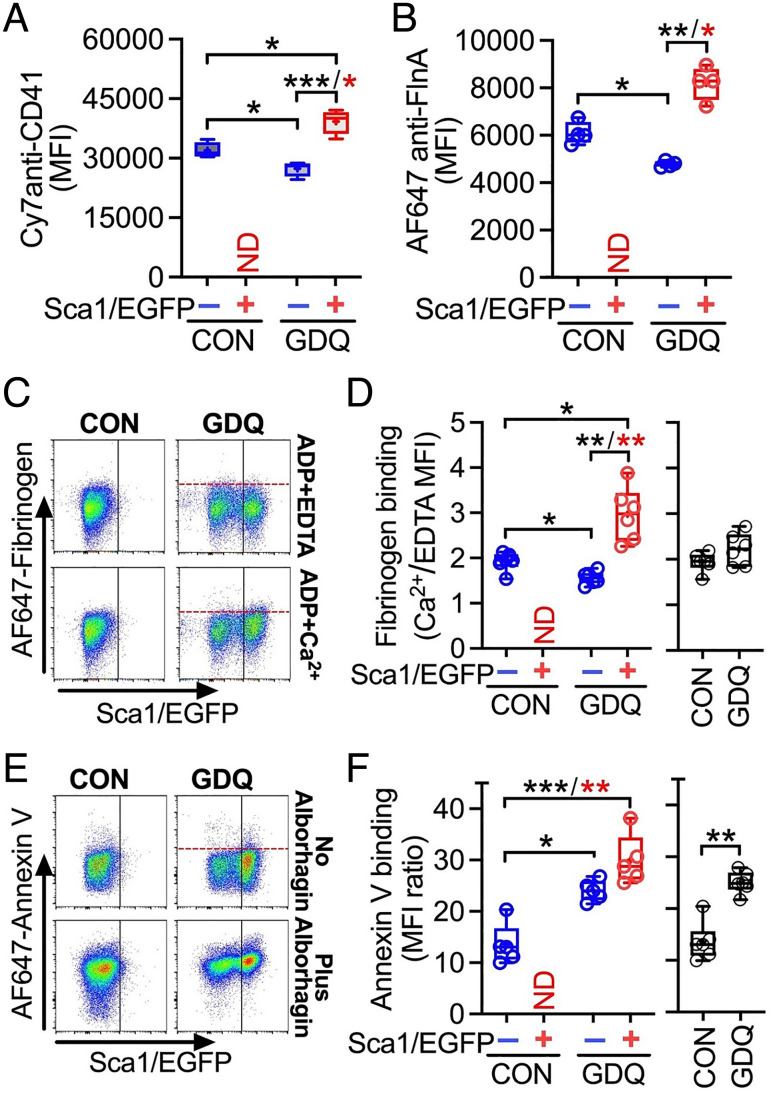
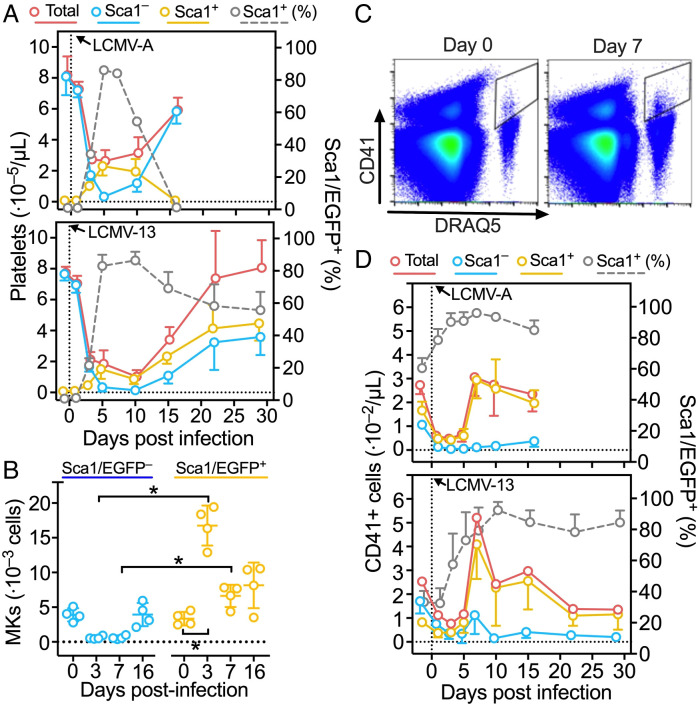
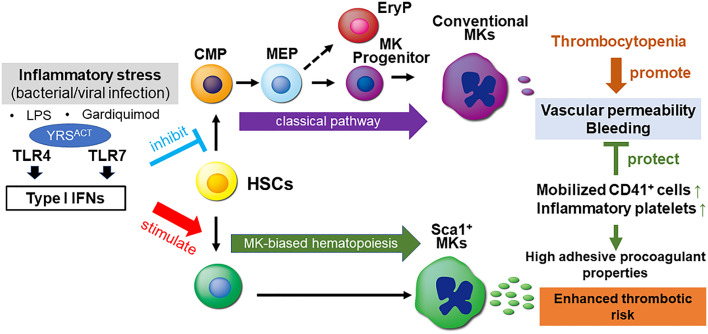
Platelets play a role not only in hemostasis and thrombosis, but also in inflammation and innate immunity. We previously reported that an activated form of tyrosyl-tRNA synthetase (YRSACT) has an extratranslational activity that enhances megakaryopoiesis and platelet production in mice. Here, we report that YRSACT mimics inflammatory stress inducing a unique megakaryocyte (MK) population with stem cell (Sca1) and myeloid (F4/80) markers through a mechanism dependent on Toll-like receptor (TLR) activation and type I interferon (IFN-I) signaling. This mimicry of inflammatory stress by YRSACT was studied in mice infected by lymphocytic choriomeningitis virus (LCMV). Using Sca1/EGFP transgenic mice, we demonstrated that IFN-I induced by YRSACT or LCMV infection suppressed normal hematopoiesis while activating an alternative pathway of thrombopoiesis. Platelets of inflammatory origin (Sca1/EGFP+) were a relevant proportion of those circulating during recovery from thrombocytopenia. Analysis of these "inflammatory" MKs and platelets suggested their origin in myeloid/MK-biased hematopoietic stem cells (HSCs) that bypassed the classical MK-erythroid progenitor (MEP) pathway to replenish platelets and promote recovery from thrombocytopenia. Notably, inflammatory platelets displayed enhanced agonist-induced activation and procoagulant activities. Moreover, myeloid/MK-biased progenitors and MKs were mobilized from the bone marrow, as evidenced by their presence in the lung microvasculature within fibrin-containing microthrombi. Our results define the function of YRSACT in platelet generation and contribute to elucidate platelet alterations in number and function during viral infection.

Keywords: inflammatory stress; megakaryocyte; platelet; tyrosyl-tRNA synthetase; viral infection.


Conflict of interest statement

Z.M.R. is Founder, President, and CEO, W.R. is Member of the Board, A.Z. is Chief Innovation Officer of MERU-VasImmune, Inc.; all have equity interest in the Company. S.K. and T.K. have equity interest in MERU-VasImmune, Inc., and J.N.O. is an employee of the company. X.-L.Y. and P.S. have financial interest in aTyr Pharma. aTyr works on therapeutic applications of tRNA synthetases and MERU VasImmune works on hematological tests. Neither aTyr Pharma nor MERU have any financial interest or intellectual property rights associated with the current work. The remaining authors declare no competing financial interests. Ellie Tzima, one of the reviewers, has financial interest in aTyr Pharma, but no interest specifically in this work.

Figures

Fig. 1.
Fig. 1.
Characterization of Sca1/EGFP+ MKs and platelets. (A) BM cells from WT or IFNAR−/− mice were cultured with 200 nM YRSACT or vehicle control (CON). After 3 d, CD41+ cells costained by anti-Sca1 and anti-F4/80 antibodies were enumerated by flow cytometry (Sca1+F4/80+ MKs). Data are shown as scatter plots with mean ± SD (n = 4). (B) Flow cytometry of blood platelets from Sca1/EGFP Tg mice treated with 30-mg/kg intravenous YRSACT or CON. (C) Percentage of blood platelets from the above mice showing green fluorescence (Sca1/EGFP+; blue) or anti-Sca1 binding (red) measured at indicated times after treatment. Data (n = 5), shown as 25th–75th percentile boxes with min-to-max whiskers, were analyzed by (A) Brown-Forsythe/Welch one-way ANOVA with Dunnett’s T3 posttest for paired comparisons; or (C) repeated measures (RM) two-way ANOVA without assuming sphericity (Geisser–Greenhouse correction) with Dunnett’s posttest for before–after comparisons. *P <0.05, **P <0.01. (D) Anti-Sca1 antibody binding is negligible in blood platelets (Top), but present in >50% CD41+ BM cells (Bottom). (E) BM cells from Sca1/EGFP Tg mice gated as Sca1/EGFP − or + by flow cytometry (circled, Bottom Left or Upper Right, respectively). (F) Sca1/EGFP+ cells included CD41+, F4/80+ and CD41+F4/80+ (double-positive) cells (Left); ~half of the latter was also CD42b+ (Right). (G) Sca1/EGFP cells included CD41+ and F4/80+ cells, but double-positive cells were negligible (Left); over half of the CD41+ cells was also CD42b+ (Right).
Fig. 2.
Fig. 2.
MK analysis by RNA-Seq and high-dimensional mass cytometry with t-distributed stochastic neighbor embedding (t-SNE). (A) Gene expression differences in two MK populations sorted from Sca1/EGFP Tg mouse BM cells on the basis of Sca1/EGFP expression. Values are shown as Transcripts Per kilobase Million (TPM). (B) BM cells from WT mice with 2N/4N DNA content were analyzed by flow cytometry and characterized for surface expression of stem cell markers CD34, Sca1, CD117 (c-Kit), and CD150 (SLAMF1); MK markers CD41 (integrin αIIb) and CD42b (GPIbα); and granulocyte/monocyte markers CD11b (integrin αM) and F4/80. The multidimensional data were analyzed by t-SNE (28) showing expression of each marker with color-coded intensity. (C) The t-SNE plot on the left identifies two subsets of cells (MK#1 and MK#2) expressing comparable levels of the MK/platelet markers CD42b and CD41; the histograms on the right show expression levels of the indicated markers in MK#1, MK#2 and all other cells. Prevalence of stem cell and myeloid markers differentiates “inflammatory” MK#1 from “normal” MK#2.
Fig. 3.
Fig. 3.
TLR4 and TLR7 activation variably inhibits normal and induces inflammatory platelet generation through IFNAR signaling. (A) Quantification of Sca1/EGFP − or + MKs in BM cells (1.5 · 107) from IFNAR + or − Sca1/EGFP Tg mice after 3 d in culture with GDQ (0.5 μg/mL), LPS (1 μg/mL), or vehicle control (CON). (B) Analysis (as in A) of BM cells harvested from the right femur of IFNAR + or − Sca1/EGFP Tg mice 2 d after intraperitoneal (i.p.) injection of GDQ (1 mg/kg) or LPS (2 mg/kg). Data in (A and B)—shown as 25th–75th percentile boxes with min-to-max-whiskers and individual values (n = 5)—were analyzed by Brown–Forsythe and Welch one-way ANOVA with Dunnett’s T3 posttest for multiple paired comparisons. (C) Platelets in blood were monitored in Sca1/EGFP Tg mice before and for 7 d after treatment with GDQ or LPS as in (B). Platelets were enumerated with a blood cell counter (Procyte Dx) and the percentage of Sca1/EGFP+ was determined by flow cytometry, from which numbers of Sca1/EGFP+ and Sca1/EGFP platelets were calculated. Data shown as mean ± SD (n = 5 in each group) were analyzed by RM two-way ANOVA with Geisser–Greenhouse correction and Dunnett’s posttest (see Fig. 1C). (D) Total counts (solid lines) and percentage of Sca1/EGFP+ platelets (broken lines) monitored in TLR7+/+ (blue lines) or TLR7−/− (red lines) Sca1/EGFP Tg mice before and for 6 d after a single intravenous injection of YRSACT (30 mg/kg; n = 4 in each group). Data shown and analyzed as in (C), except that Šídák’s posttest was used. Only significant differences are indicated: *P <0.05, **P <0.01, ***P <0.001, ****P <0.0001.
Fig. 4.
Fig. 4.
Functional characterization of Sca1/EGFP+/− platelets. Blood cells collected from Sca1/EGFP Tg mice 3 d after GDQ or CON injection were permeabilized, fixed, and stained with antibodies against (A) PE-Cy7-labeled anti-CD41; or (B) AF647-labeled anti-filamin A. The median fluorescence intensity (MFI) of bound antibody was taken to represent levels of the cognate antigen. (C) Blood from mice treated with GDQ or CON was diluted in Tyrode’s buffer (1.5–100 µL final), to which AF647-fibrinogen (15 μg/mL) was added with 0.2 mM Ca2+ or 2 mM EDTA (negative control) and 10 µM ADP to activate platelets at room temperature. After 10 min, AF405-anti-mouse GPIbα MoAb (5A7) was added (to identify platelets) and fibrinogen binding to Sca1/EGFP + or − platelets was separately evaluated. (D, Left panel) Bound fibrinogen calculated as the ratio of AF647 MFI values on platelets with added Ca2+ or EDTA; ND indicates no Sca1/EGFP+ platelets detected in untreated mice. (D, Right panel) Fibrinogen bound to all platelets without gating for EGFP fluorescence. (E) Evaluation of AF647-Annexin V binding to blood platelets in the presence of 3 mM Ca2+ and 200 nM apixaban (FXa inhibitor to prevent coagulation) with or without the addition of the platelet GPVI agonist, Alborhagin (2.5 μg/mL). For additional details, see panel (C). (F, Left and Right) AF647-Annexin V binding to platelets measured with the same method as fibrinogen in (D, Left and Right). Data in (A, B, D, and F) are shown as 25th–75th percentile boxes with min-to-max-whiskers and individual values (n = 4 and 6, respectively). Statistical analysis was performed by RM one-way ANOVA with Geisser–Greenhouse correction and Tukey’s posttest for paired comparisons (black asterisks) or nonparametric Friedman test followed by Dunn’s posttest (red asterisks), except for data in D, F, Right panel, analyzed by two-tailed paired t test. *P <0.05, **P <0.01, ***P <0.001.
Fig. 5.
Fig. 5.
Inflammatory thrombopoiesis in mice infected by LCMV. (A) Total platelet count (red solid line) and percentage of Sca1/EGFP+ platelets (gray broken line) measured before and after injection of LCMV-A (Upper panel) or LCMV-13 (Lower panel) into Sca1/EGFP Tg mice. From these two values, the number of Sca1/EGFP and Sca1/EGFP+ platelets was calculated (blue and orange lines, respectively). Data shown as mean ± SD (Upper panel: n = 10, except n = 5 for day 16 excluded from statistical evaluation, Lower panel: n = 5). (B) BM cells were harvested from femurs of Sca1/EGFP Tg mice at the indicated days after LCMV-A infection and the number of MKs was determined by flow cytometry. Data (n = 4) shown as scatter plots with mean ± SD, were analyzed by RM one-way ANOVA with Geisser–Greenhouse correction and with Šídák’s posttest for multiple paired comparisons. (C) Flow cytometric analysis of blood cells from WT mice stained with anti-CD41 antibody and DRAQ5 in the presence of 2 mM EDTA before and 7 d after infection with LCMV-A. (D) Number of CD41+ nucleated cells and percentage of Sca1/EGFP+ measured in blood of Sca1/EGFP Tg mice before and after infection with LCMV-A (Upper panel) or LCMV-13 (Lower panel). Data, shown as mean ± SD, were analyzed as in (A). *P <0.05.
Fig. 6.
Fig. 6.
Increased plasma YRS in Sca1/EGFP Tg mice infected by LCMV-13. Plasma samples were analayzed by ELISA using anti-YRS polyclonal antibodies. Concentrations were calculated from a reference calibration curve of purified recombinant human YRS protein and the results are shown as relative to the average of preinfection value (n = 5). Data were analyzed by RM one-way ANOVA with Dunnett’s posttest for multiple comparisons (black asterisks) or nonparametric Friedman test followed by Dunn’s posttest (red asterisks). *P < 0.05, **P <0.01.
Fig. 7.
Fig. 7.
Schematic representation of inflammatory thrombopoiesis associated with viral infection mimicked by YRSACT. Inflammatory stress induced by bacterial or viral infection through TLRs, specifically TLR4 and TLR7, induces IFN-I production suppressing normal hematopoiesis and causing thrombocytopenia, but also stimulating inflammatory thrombopoiesis as defense response. Inflammatory platelets and myeloid skewed CD41+ hematopoietic progenitors and MKs released into blood have enhanced adhesive and procoagulant properties, which support endothelial barrier function and hemostasis, but may also have potential to enhance thrombotic risk. Selective stimulation of TLR4 and TLR7 by LPS and Gardiquimod, respectively, and of TLR7 by YRSACT elicited responses mechanistically similar to infection, but variable in severity. Thus, the induction of IFN-I signaling by distinct pathogen recognition receptors activated by different stimuli may variably change the balance of inhibitory and stimulatory effects on normal and inflammatory thrombopoiesis.

Similar articles

Cited by

References

    1. Ho-Tin-Noe B., Boulaftali Y., Camerer E., Platelets and vascular integrity: How platelets prevent bleeding in inflammation. Blood 131, 277–288 (2018). - PubMed
    1. Morrell C. N., Aggrey A. A., Chapman L. M., Modjeski K. L., Emerging roles for platelets as immune and inflammatory cells. Blood 123, 2759–2767 (2014). - PMC - PubMed
    1. Projahn D., Koenen R. R., Platelets: Key players in vascular inflammation. J. Leukoc. Biol. 92, 1167–1175 (2012). - PubMed
    1. Semple J. W., Freedman J., Platelets and innate immunity. Cell Mol. Life Sci. 67, 499–511 (2010). - PMC - PubMed
    1. Semple J. W., Italiano J. E. Jr., Freedman J., Platelets and the immune continuum. Nat. Rev. Immunol. 11, 264–274 (2011). - PubMed

Publication types

Substances