. 2022 Nov 29;119(48):e2208353119.
doi: 10.1073/pnas.2208353119. Epub 2022 Nov 21.

Temporal dynamics of the sensorimotor convergence underlying voluntary limb movement

Affiliations

Temporal dynamics of the sensorimotor convergence underlying voluntary limb movement

Tatsuya Umeda et al. Proc Natl Acad Sci U S A. .

Abstract

Descending motor drive and somatosensory feedback play important roles in modulating muscle activity. Numerous studies have characterized the organization of neuronal connectivity in which descending motor pathways and somatosensory afferents converge on spinal motor neurons as a final common pathway. However, how inputs from these two pathways are integrated into spinal motor neurons to generate muscle activity during actual motor behavior is unknown. Here, we simultaneously recorded activity in the motor cortices (MCx), somatosensory afferent neurons, and forelimb muscles in monkeys performing reaching and grasping movements. We constructed a linear model to explain the instantaneous muscle activity using the activity of MCx (descending input) and peripheral afferents (afferent input). Decomposition of the reconstructed muscle activity into each subcomponent indicated that muscle activity before movement onset could first be explained by descending input from mainly the primary motor cortex and muscle activity after movement onset by both descending and afferent inputs. Descending input had a facilitative effect on all muscles, whereas afferent input had a facilitative or suppressive effect on each muscle. Such antagonistic effects of afferent input can be explained by reciprocal effects of the spinal reflex. These results suggest that descending input contributes to the initiation of limb movement, and this initial movement subsequently affects muscle activity via the spinal reflex in conjunction with the continuous descending input. Thus, spinal motor neurons are subjected to temporally organized modulation by direct activation through the descending pathway and the lagged action of the spinal reflex during voluntary limb movement.

Keywords: decoding; motor cortex; muscle activity; spinal reflex; voluntary movement.


Conflict of interest statement

The authors declare no competing interest.

Figures
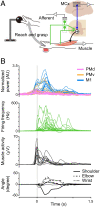
Fig. 1.
Fig. 1.
Simultaneous recording of MCx, afferent and muscle activity, and joint kinematics. (A) Schematic illustration of the experimental setup. (B) Modulation of cortical and peripheral activity in monkey T aligned to movement onset. Top: High-gamma cortical activity. Second: Instantaneous firing rate of peripheral afferents. Third: Forelimb muscles. Bottom: Joint angles. A vertical line represents the time of movement onset.
Fig. 2.
Fig. 2.
Descending and afferent inputs account for muscle activity. (A) Model accounting for muscle activity evoked by descending and afferent inputs. (B) Average modulation of the observed muscle activity, reconstruction using descending and afferent inputs, and shuffled control data aligned to movement onset. Shaded areas, SEM. (C) Mean reconstruction accuracy. Correlation coefficients and variance accounted fors (VAFs) between the observed and reconstructed traces (monkey T, n = 12 muscles; monkey C, n = 10 muscles; *P < 10−5, paired two-tailed t test). The superimposed bar graphs show the mean ± SEM. P values are described in SI Appendix, Table S1. (D) Models accounting for muscle activity evoked by descending input alone and afferent input alone. (E) Average modulation of the observed muscle activity, reconstruction using descending and afferent inputs, and each input aligned to movement onset. Shaded areas, SEM. Arrows indicate points that differ between the two models (dark blue, Desc + Aff vs. Desc; dark green, Desc + Aff vs. Aff). (F) Correlation coefficients and VAFs between the observed and reconstructed traces (monkey T, n = 12 muscles; monkey C, n = 10 muscles; P < 10−4 by one-way repeated-measures analysis of variance [ANOVA], *P < 0.01, paired two-tailed t test). The superimposed bar graphs show the mean ± SEM. P values are described in SI Appendix, Table S2.
Fig. 3.
Fig. 3.
MCx and afferents sequentially encode muscle activity. (A) Model accounting for muscle activity evoked by descending and afferent inputs. (B) Average modulation of the observed muscle activity, reconstruction using descending and afferent inputs, and each subcomponent aligned to movement onset. The Inset shows a magnification of the graph around the movement onset indicated by the dashed line. Vertical lines represent the time of movement onset. Shaded areas, SEM. (Scale bars in the Inset, 0.1 s and 10 μV.) (C) Onset times of the observed muscle activity, reconstruction using descending and afferent inputs, and each subcomponent (monkey T, n = 12 muscles; monkey C, n = 10 muscles; P < 10−4 one-way repeated-measures ANOVA, *P < 0.05, paired two-tailed t test). ns, not significant. The superimposed bar graphs show the mean ± SEM. P values are described in SI Appendix, Table S3.
Fig. 4.
Fig. 4.
MCx and afferents differentially encode muscle activity across muscles. (A) Average modulation of the reconstruction using descending and afferent inputs and each subcomponent aligned to movement onset. (B) The size of descending and afferent components for each muscle. Asterisks indicate a significant difference from 0 (monkey T, n = 17 sessions; monkey C, n = 7 sessions; *P < 0.05, unpaired two-tailed t test for positive values; **P < 0.05, for negative values). Data are the mean ± SD. P values are described in SI Appendix, Table S4.
Fig. 5.
Fig. 5.
M1 is a major predictor of muscle activity. (A) Average modulation of the reconstruction using descending and afferent inputs and subcomponents calculated from the activity in PMd (PMd component), PMv (PMv component), and M1 (M1 component) aligned to movement onset. (B) The size of subcomponents calculated from the activity in each cortical area for the prediction of muscle activity (monkey T, n = 12 muscles; monkey C, n = 10 muscles; P < 0.05, one-way repeated-measures ANOVA, *P < 0.05, paired two-tailed t test). The size of each subcomponent is normalized by the size of the reconstruction using descending and afferent inputs. The superimposed bar graphs show the mean ± SEM. P values are described in SI Appendix, Table S5. (C) Color maps in the lower row represent the size of subcomponents calculated from the activity at each electrode for the prediction of muscle activity. Electrode positions in each motor cortical area are depicted in the upper row. The size of each subcomponent is normalized by the size of the reconstruction using descending and afferent inputs. CS, central sulcus; AS, arcuate sulcus.
Fig. 6.
Fig. 6.
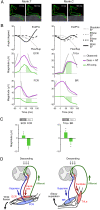
Effects of afferent input on muscle activity are accounted for by stretch reflex and reciprocal inhibition. (A) Stick figures showing the orientation of the forelimb and chest when the monkeys began to reach (t = 0 ms). When monkeys began to reach, monkey T flexed the wrist, and monkey C supinated and flexed the elbow. (B) Top: Forelimb joint angles. Second and Third: Average modulation of the observed muscle activity, reconstruction using descending and afferent inputs, and afferent component in the reconstruction. The vertical lines indicate the time of movement onset. (C) The size of afferent components for antagonistic muscle pairs (ext; extensor, flex; flexor) in a period from the beginning of the reaching movement (55–100 ms around movement onset; shown in the green area in Fig. 5B). Asterisks indicate a significant difference from 0 (monkey T, n = 17 sessions; monkey C, n = 7 sessions; *P < 0.05, unpaired two-tailed t test). Data are the mean ± SD. P values are described in SI Appendix, Table S6. (D) Schematic illustration of spinal reflex circuits and afferent effects on agonist and antagonist muscles. Agonist muscles (monkey T, ECR; monkey C, TriLa) are depicted in red, and antagonist muscles (monkey T, FCR; monkey C, BR) are depicted in blue. Afferent inputs (green arrow) induced by the stretch of agonist muscles resulted in the facilitation of agonist muscles and suppression of antagonist muscles via spinal inhibitory interneurons.
Fig. 7.
Fig. 7.
Temporal dynamics of the sensorimotor convergence in the spinal motor neurons is a common feature across different movements. (A) Trajectories of the right hand during the reaching and grasping movements to the right (black dots) and left targets (red dots) (−500 to 350 ms around movement onset). (B) Average modulation of the observed muscle activity, reconstruction using descending and afferent inputs, and each subcomponent aligned to movement onset. The Inset shows a magnification of the graph around the movement onset indicated by the dashed box. Vertical lines represent the time of movement onset. Shaded areas, SEM. (Scale bars in the Inset, 0.1 s and 2 μV.) (C) Onset times of the observed muscle activity, reconstruction using descending and afferent inputs, and each subcomponent (n = 12 muscles; P < 10−4 one-way repeated-measures ANOVA, *P< 0.05, paired two-tailed t test). ns, not significant. The superimposed bar graphs show the mean ± SEM. P values are described in SI Appendix, Table S7.
Fig. 8.
Fig. 8.
Proposed spatiotemporal dynamics of spinal motor neurons integrating descending and afferent inputs during voluntary movement. (Left Panel) Descending motor commands from the MCx contribute to the initiation of limb movement. (Right Panel) During movement, spinal motor neurons continuously receive descending motor commands from the MCx and concurrently receive sensory feedback signals from peripheral afferents via the spinal reflex.

Similar articles

Cited by

References

    1. Nielsen J. B., Sensorimotor integration at spinal level as a basis for muscle coordination during voluntary movement in humans. J. Appl. Physiol. 96, 1961–1967 (2004). - PubMed
    1. McCrea D. A., Supraspinal and segmental interactions. Can. J. Physiol. Pharmacol. 74, 513–517 (1996). - PubMed
    1. Jankowska E., Interneuronal relay in spinal pathways from proprioceptors. Prog. Neurobiol. 38, 335–378 (1992). - PubMed
    1. Baldissera F., Hultborn H., Illert M., “Integration in Spinal Neuronal Systems” in Handbook of Physiology, The Nervous System, Motor Control, (American Physiological Society, 1977), pp. 509–595.
    1. Hultborn H., Spinal reflexes, mechanisms and concepts: From Eccles to Lundberg and beyond. Prog. Neurobiol. 78, 215–232 (2006). - PubMed

Publication types