. 2022 Nov 29;119(48):e2208022119.
doi: 10.1073/pnas.2208022119. Epub 2022 Nov 21.

Target recognition by RNase E RNA-binding domain AR2 drives sRNA decay in the absence of PNPase

Affiliations

Target recognition by RNase E RNA-binding domain AR2 drives sRNA decay in the absence of PNPase

Dhriti Sinha et al. Proc Natl Acad Sci U S A. .

Abstract

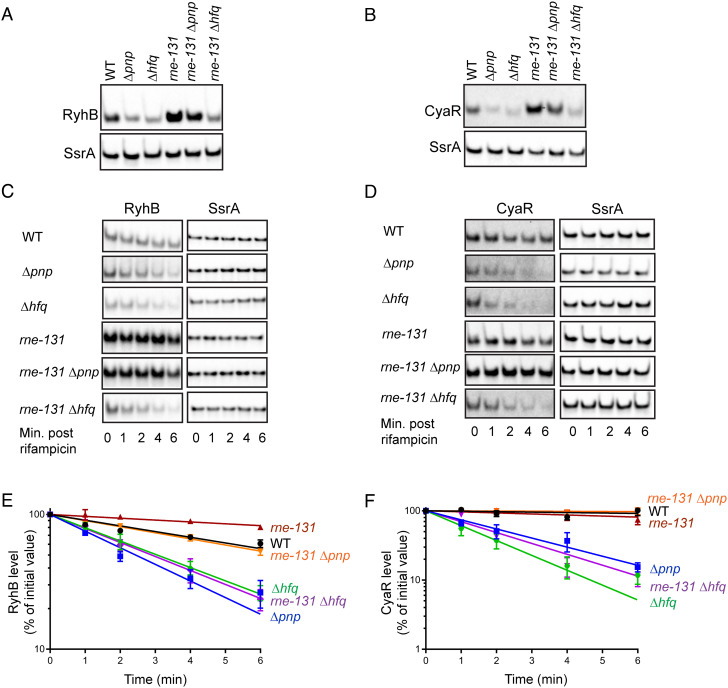
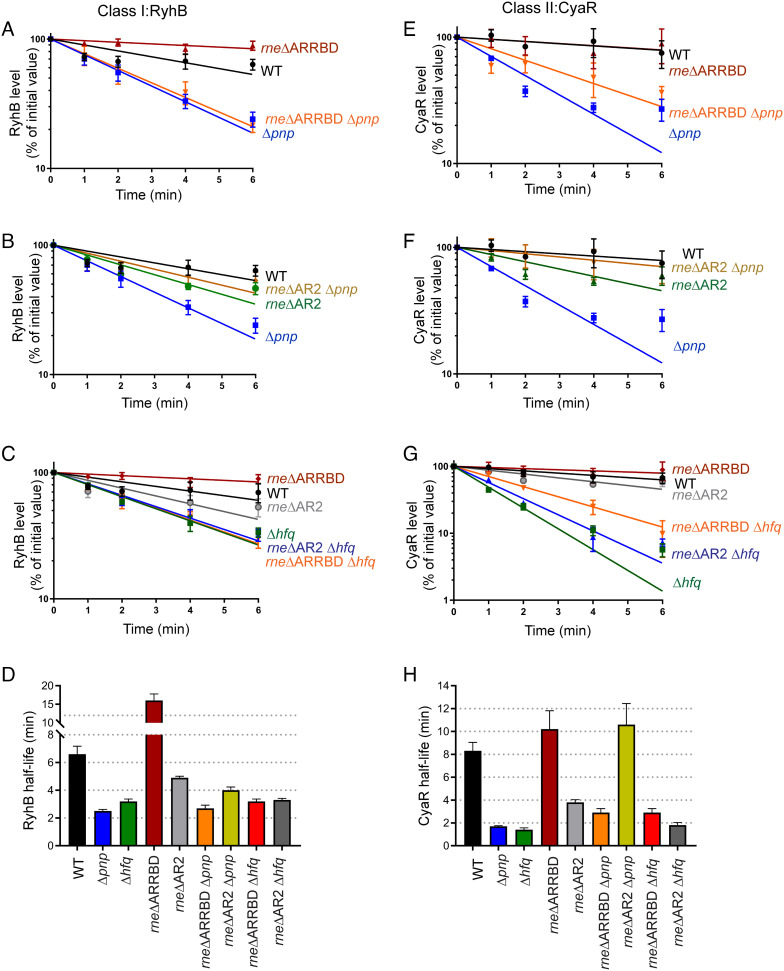
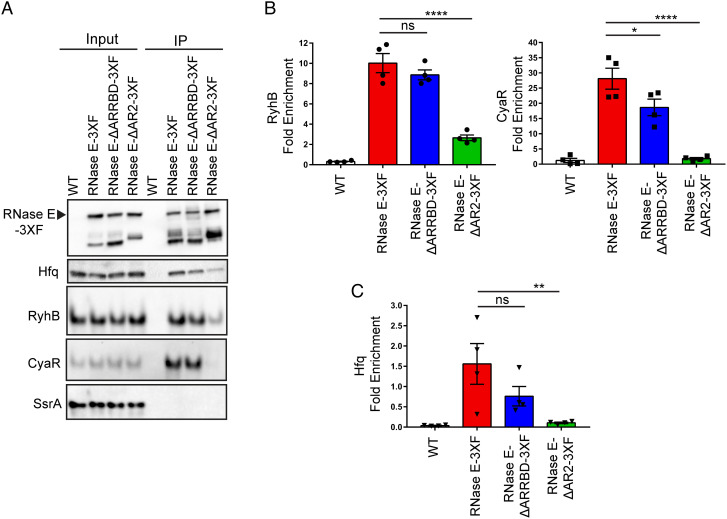
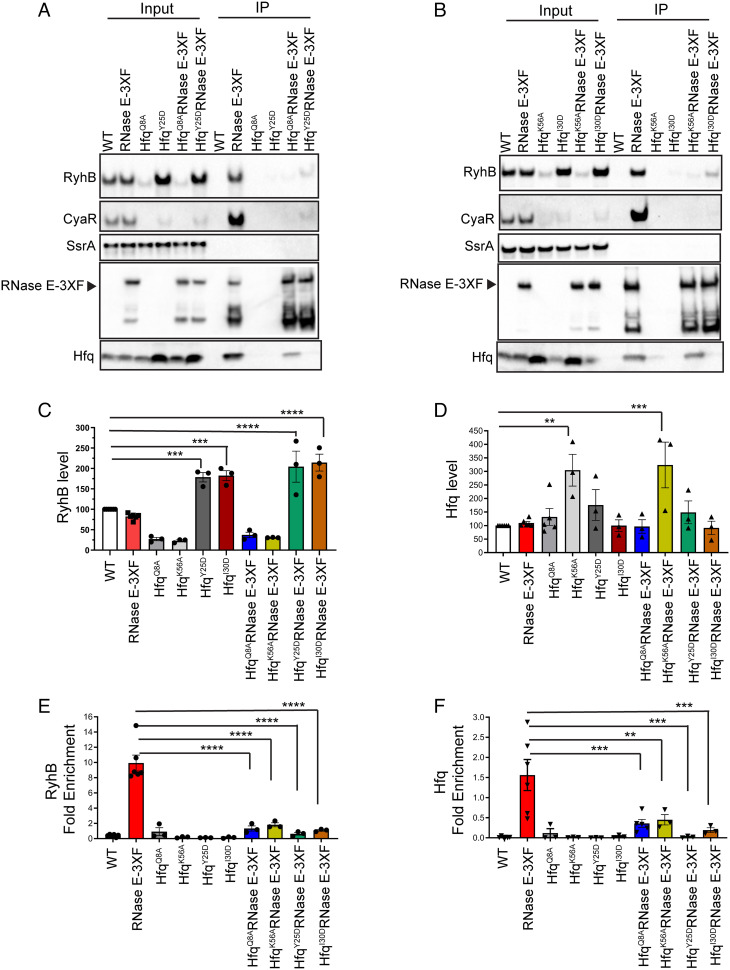
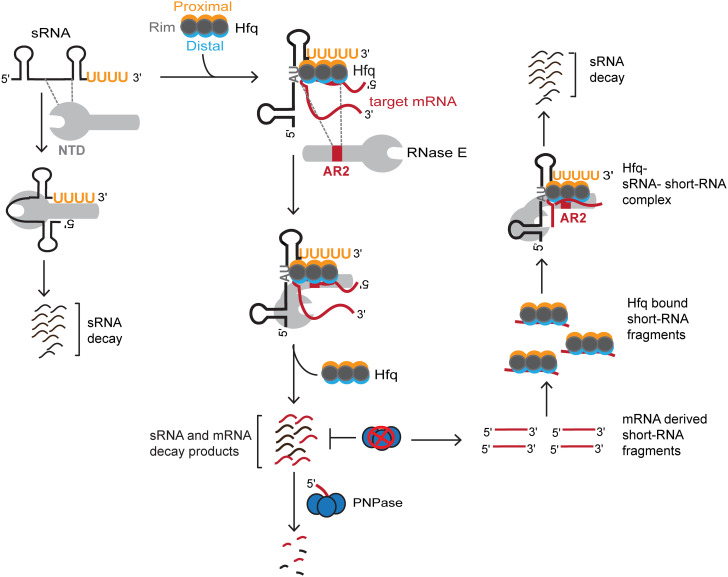
The C-terminal domain (CTD) of the major endoribonuclease RNase E not only serves as a scaffold for the central RNA decay machinery in gram-negative bacteria but also mediates coupled degradation of small regulatory RNAs (sRNAs) and their cognate target transcripts following RNA chaperone Hfq-facilitated sRNA-mRNA base pairing. Despite the crucial role of RNase E CTD in sRNA-dependent gene regulation, the contribution of particular residues within this domain in recruiting sRNAs and mRNAs upon base pairing remains unknown. We have previously shown that in Escherichia coli, the highly conserved 3'-5'-exoribonuclease polynucleotide phosphorylase (PNPase) paradoxically stabilizes sRNAs by limiting access of RNase E to Hfq-bound sRNAs and by degrading target mRNA fragments that would otherwise promote sRNA decay. Here, we report that in the absence of PNPase, the RNA-binding region AR2 in the CTD is required for RNase E to initiate degradation of the Hfq-dependent sRNAs CyaR and RyhB. Additionally, we show that introducing mutations in either hfq that disrupts target mRNA binding to Hfq or the AR2 coding region of rne impairs RNase E binding to sRNAs. Altogether, our data support a model where sRNAs are recruited via bound mRNA targets to RNase E by its AR2 domain after Hfq catalyzes sRNA-mRNA pairing. These results also support our conclusion that in a PNPase-deficient strain, more rapid decay of sRNAs occurs due to accelerated pairing with mRNA targets as a consequence of their accumulation. Our findings provide insights into the mechanisms by which sRNAs and mRNAs are regulated by RNase E.

Keywords: Hfq; RNase E; polynucleotide phosphorylase; sRNA; small RNA.


Conflict of interest statement

The authors declare no competing interest.

Figures

Fig. 1.
Fig. 1.
The CTD of RNase E facilitates decay of Hfq-dependent sRNAs in the absence of PNPase. (A and B) Representative northern blots corresponding to RyhB and CyaR steady-state levels in WT E. coli parent (WT: NRD1138) and derived isogenic mutants (Δpnp: NRD1139, Δhfq: DS021, rne-131: DS102, rne-131 Δpnp: NRD1143, and rne-131 Δhfq: DS130). RyhB and CyaR expression was induced for 15 min by the addition of 2, 2′-dipyridyl or cAMP, respectively, and total RNA was extracted from early-exponential phase cultures for northern blot analysis to determine corresponding levels of sRNAs and SsrA (loading control). (C and D) Representative northern blots corresponding to RNA stability time course experiment to determine half-lives of RyhB and CyaR sRNAs in the abovementioned set of strains. Total RNA was extracted from early-exponential phase cultures 15 min after RyhB (C) or CyaR (D) induction at indicated time points after rifampicin addition. Blots were intensity adjusted to improve visibility of faint bands. (E and F) RyhB and CyaR signal intensities were quantified and normalized to their corresponding loading controls (SsrA). The sRNA decay curves were generated by fitting the normalized signal intensities for each time point. Points and error bars in the curves represent the means and the SEMs of at least three independent experiments. RyhB and CyaR half-life measurements corresponding to RNA stability curves are shown in Table 1.
Fig. 2.
Fig. 2.
Impact of RNase E CTD deletions on sRNA-mediated target regulation. (A) Schematic representation of RNase E comprising the N-terminal catalytic domain and the C-terminal degradosome scaffold domain (top diagram) followed by illustrations depicting specific deletions within the CTD that were further analyzed in this study. ARRBD and AR2 refer to two distinct arginine-rich RNA-binding regions, while Eno and PNP are abbreviations for glycolytic enzyme enolase and exoribonuclease PNPase, respectively. (B and C) β-gal assay to determine the impact of removal of the ARRBD or AR2 RNA-binding regions from RNase E on sRNA-mediated regulation of target mRNA translation. (B) To assess CyaR-mediated regulation of ompX, β-gal assays were performed on early-exponential phase cultures of a WT strain (WT: NRD377) or derived isogenic mutants (Δpnp: NRD677, rneΔ603-627: NRD1015, rneΔ771-820: NRD1035, Δpnp rneΔ603-627: NRD1025, and Δpnp rneΔ771-820: NRD1037) containing a PBAD::ompX′–′lacZ fusion. Strains either harbored an empty vector (vector) or expressed CyaR from a plasmid (pCyaR). (C) To assess RyhB-mediated regulation of sodB, β-gal assays were performed on early-exponential phase cultures of a WT strain (WT: NRD1041) or derived isogenic mutants (Δpnp: NRD1064, rneΔ603-627: NRD1053, rneΔ771-820: NRD1055, Δpnp rneΔ603-627: NRD1061, and Δpnp rneΔ771-820: NRD1063) containing a PBAD::sodB′–′lacZ fusion. Strains either harbored an empty vector (vector) or expressed RyhB from a plasmid (pRyhB). The amount of β-gal activity produced was normalized to the empty plasmid vector in each background. Points, bars, and error bars represent the value for each replicate, mean, and SEM of at least three independent experiments. (D and E) Northern blots were used to determine CyaR and RyhB steady-state levels in abovementioned sets of strains at the same time points samples were taken for assaying β-gal activity in panels B and C, respectively. The sRNA levels were first normalized to those of SsrA loading controls. CyaR and RyhB levels in WT strains expressing either CyaR or RyhB from a plasmid (WT + pCyaR or WT + pRyhB) were set to 100%, and the sRNA amount for the rest of the samples was scaled to that level. Results represent the mean of at least three independent experiments, and error bars indicate SEM. **P < 0.005 and ***P < 0.0005; ns, not significant.
Fig. 3.
Fig. 3.
AR2 RNA-binding region within the CTD of RNase E drives sRNA decay in the absence of PNPase. Stability curves of RyhB (AC) and CyaR (EG) in a WT strain (WT: NRD1138) or derived isogenic mutants (Δpnp: NRD1139, rneΔ603-627: NRD1591, rneΔ771-820: NRD1592, Δpnp rneΔ603-627: NRD1593, Δpnp rneΔ771-820: NRD1594, Δhfq: DS021, Δhfq rneΔ603-627: DS199, and Δhfq rneΔ771-820: NRD195). Expression of RyhB and CyaR was induced by the addition of 2, 2′-dipyridyl or cAMP, respectively, and total RNA was extracted from early-exponential phase cultures 15 min after induction at indicated time points after rifampicin addition. The sRNA signals were assessed by northern blot and normalized to that of SsrA loading control. Lines indicate best-fit exponential decay curves of three replicates, and error bars represent SEM of each time point. (D and H) Graphs showing mean sRNA half-life values corresponding to RyhB and CyaR stability curves. The sRNA half-lives are tabulated in Table 1.
Fig. 4.
Fig. 4.
AR2 region within the CTD facilitates interactions between Hfq-dependent sRNAs and RNase E. (A) Cell extracts prepared from late-exponential phase cultures of E. coli strains expressing untagged RNase E (WT: NRD1138) or FLAG-tagged constructs of full-length or truncated forms of RNase E (RNase E-3XF: DS196, RNase E-ΔARRBD-3XF: DS228, and RNase E-ΔAR2-3XF: DS229) were used to assess coprecipitation of sRNAs and Hfq with RNase E by northern blot and immunoblot, respectively. (B) Fold enrichment of a given RNA upon immunoprecipitation was determined by first calculating the signal intensity per microgram of RNA for the input and the elution from northern blots in (A). (C) Fold enrichment of Hfq upon immunoprecipitation was determined by first normalizing Hfq band intensities to corresponding RNase E band signals in the input and elution fractions from western blots in (A). sRNA and Hfq fold enrichments were then calculated by dividing normalized elution signal by the input signal. Points, bars, and error bars represent the value of each replicate, means, and SEM of at least four independent experiments. *P < 0.05, **P < 0.01, and ****P < 0.0001; ns, not significant. An untagged WT strain (WT) was used as a control.
Fig. 5.
Fig. 5.
Class I mRNA binding distal face residue of Hfq is critical for its association with RNase E. (A and B) RNase E-3XF pulldowns were performed using cell extracts prepared from late-exponential phase cultures of E. coli strains containing a FLAG-tagged construct of RNase E and expressing Hfq (RNase E-3XF: DS196) or Hfq mutants with substitutions in its proximal (Q8A and K56A) or distal (Y25D and I30D) faces (HfqQ8A RNase E-3XF: DS233, HfqK56A RNase E-3XF: DS240, HfqY25D RNase E-3XF: DS234, and HfqI30D RNase E-3XF: DS241). Control pulldowns were carried out with cell extracts from strains expressing an untagged RNase E and WT Hfq (WT, NRD1138) or mutant Hfq proteins (HfqQ8A: DS058, HfqK56A: DS239, HfqY25D: NRD1410, and HfqI30D: NRD1411). Coprecipitation of sRNAs and protein was analyzed by northern blot and immunoblot, respectively. Representative images of blots from a total of three independent RNase E coimmunoprecipitation assays are shown. (C and D) Determination of steady-state levels of RyhB and Hfq in the input fractions corresponding to Fig. 5 A and B. Northern and western blots were used to determine RyhB and Hfq amounts. RyhB and Hfq levels were normalized to those of SsrA and DnaK loading controls, respectively. Results represent the mean of at least three independent experiments, and error bars indicate SEM. **P < 0.002, ***P < 0.001, and ****P < 0.0001. RyhB levels calculated in (C) for HfqQ8A, HfqK56A, HfqQ8A RNase E-3XF, and HfqK56A RNase E-3XF were significantly different from that in the WT strain (**P < 0.002). (E and F) RyhB and Hfq fold enrichments were calculated as described in the legend of Fig. 4. Points, bars, and error bars represent the value of each replicate, means, and SEM of at least three independent experiments. **P < 0.01, ***P < 0.001, and ****P < 0.0001. RyhB fold enrichment calculated for HfqK56A RNase E-3XF was significantly different from that for HfqY25D RNase E-3XF (*P < 0.05).
Fig. 6.
Fig. 6.
A model depicting the mechanism by which RNase E regulates sRNAs and target mRNAs following Hfq-mediated base pairing. (Left) In the absence of Hfq, the NTD of RNase E recognizes the naked sRNA to activate its decay independent of the CTD. (Middle) AR2 RNA-binding region within the CTD of RNase E recognizes the Hfq-bound target mRNAs to subsequently recruit Hfq-dependent sRNAs to RNase E. In case of sRNA-mediated negative regulation, RNase E activates sequential degradation of target mRNA and its cognate sRNA. Exoribonuclease activity of PNPase is required for clearing of the decay products generated by RNase E. (Right) In the absence of PNPase, mRNA-derived short RNA fragments accumulate, which can base pair with sRNAs via Hfq. AR2 RNA-binding region within the CTD of RNase E subsequently recognizes the bound mRNA-derived short RNA fragments in the Hfq–sRNA–short RNA ternary complex to recruit Hfq along with the bound cognate sRNAs. These interactions ultimately activate RNase E catalytic function to deplete Hfq-dependent sRNAs through accelerated decay.

Similar articles

Cited by

References

    1. Wagner E. G. H., Romby P., Small RNAs in bacteria and archaea: who they are, what they do, and how they do it. Adv. Genet. 90, 133–208 (2015). - PubMed
    1. Hör J., Matera G., Vogel J., Gottesman S., Storz G., Trans-acting small rnas and their effects on gene expression in Escherichia coli and Salmonella enterica. EcoSal Plus 9, (2020). - PMC - PubMed
    1. Holmqvist E., Berggren S., Rizvanovic A., RNA-binding activity and regulatory functions of the emerging sRNA-binding protein ProQ. Biochim. Biophys. acta. Gene Regul. Mech. 1863, 194596 (2020). - PubMed
    1. De Lay N., Gottesman S., Role of polynucleotide phosphorylase in sRNA function in Escherichia coli. RNA 17, 1172–1189 (2011). - PMC - PubMed
    1. Cameron T. A., Matz L. M., De Lay N. R., Polynucleotide phosphorylase: Not merely an RNase but a pivotal post-transcriptional regulator. PLoS Genet. 14, e1007654 (2018). - PMC - PubMed

Publication types

MeSH terms

LinkOut - more resources