. 2022 Nov 29;119(48):e2208934119.
doi: 10.1073/pnas.2208934119. Epub 2022 Nov 21.

Modulation of cGAS-STING signaling by PPARα in a mouse model of ischemia-induced retinopathy

Affiliations

Modulation of cGAS-STING signaling by PPARα in a mouse model of ischemia-induced retinopathy

Xiang Ma et al. Proc Natl Acad Sci U S A. .

Abstract

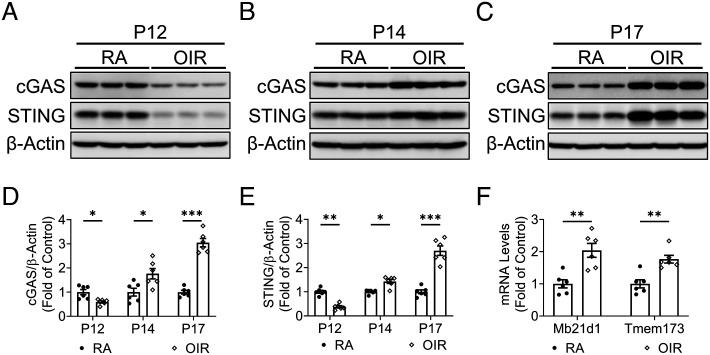
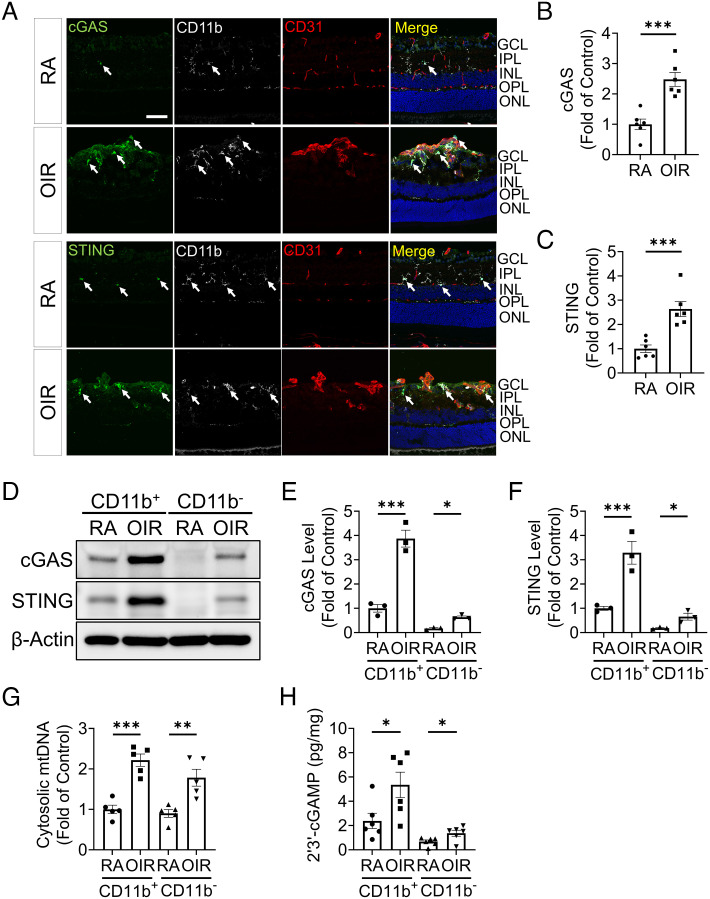
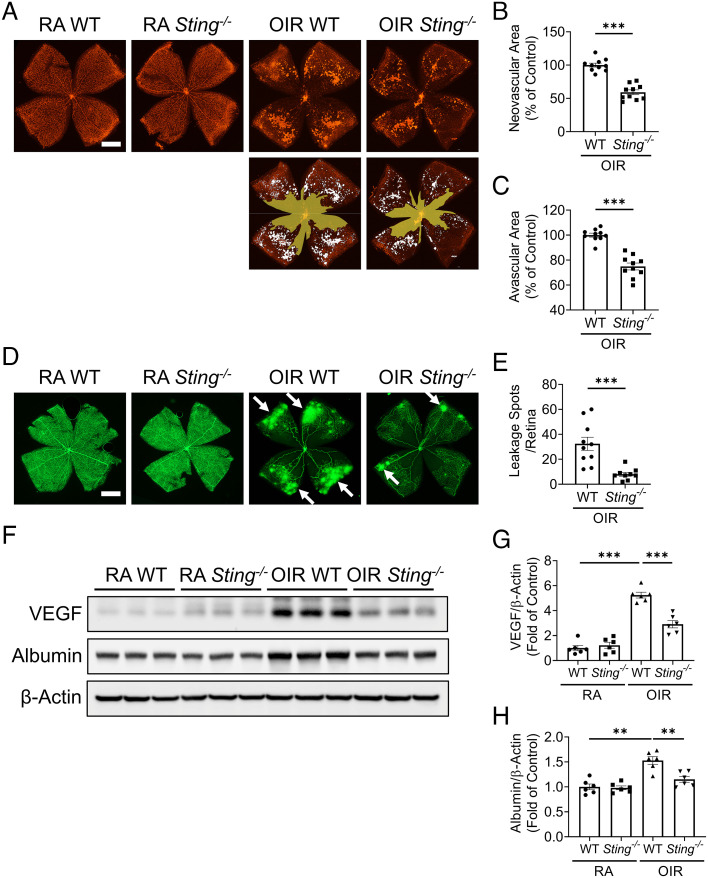
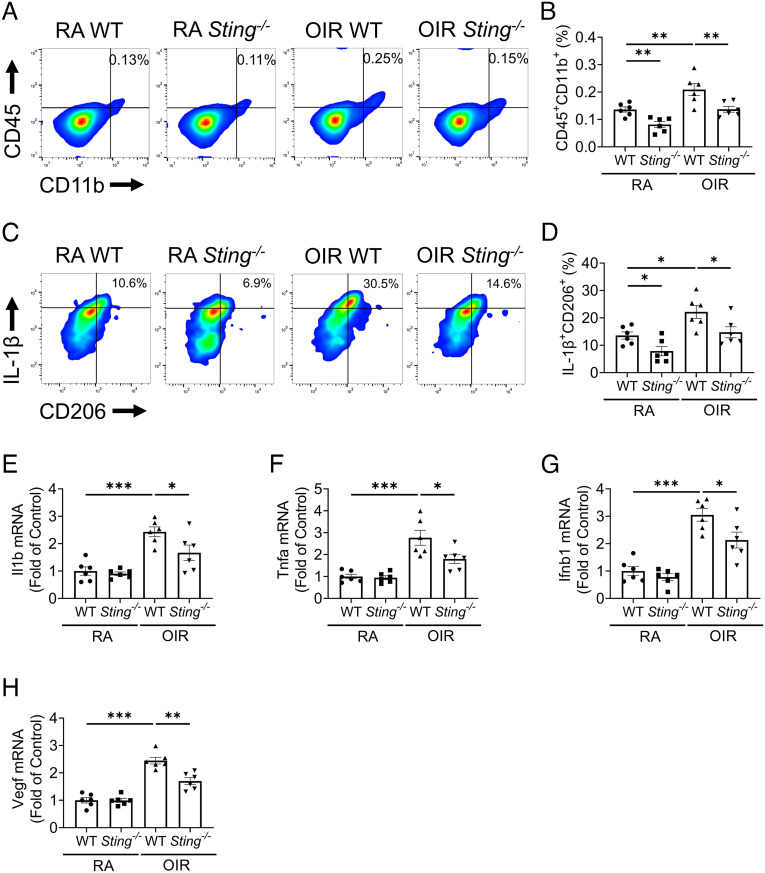
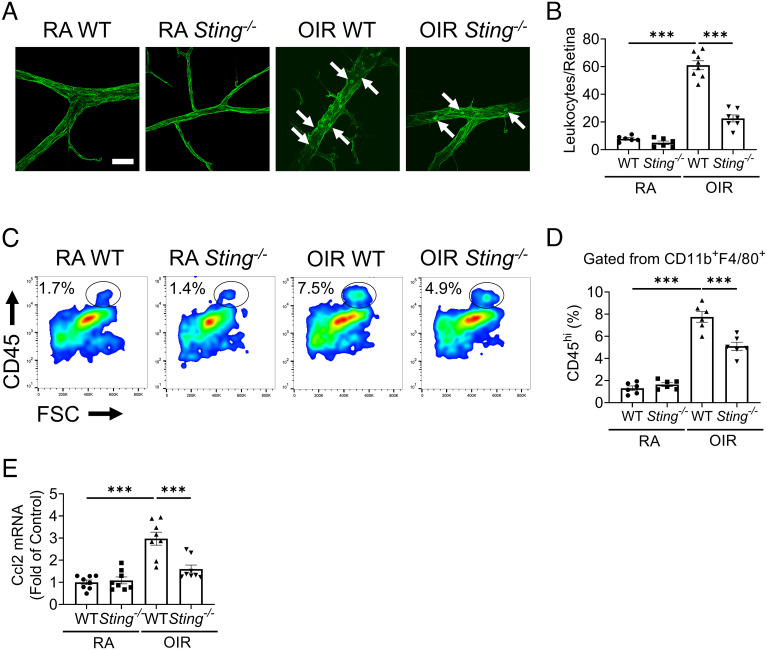
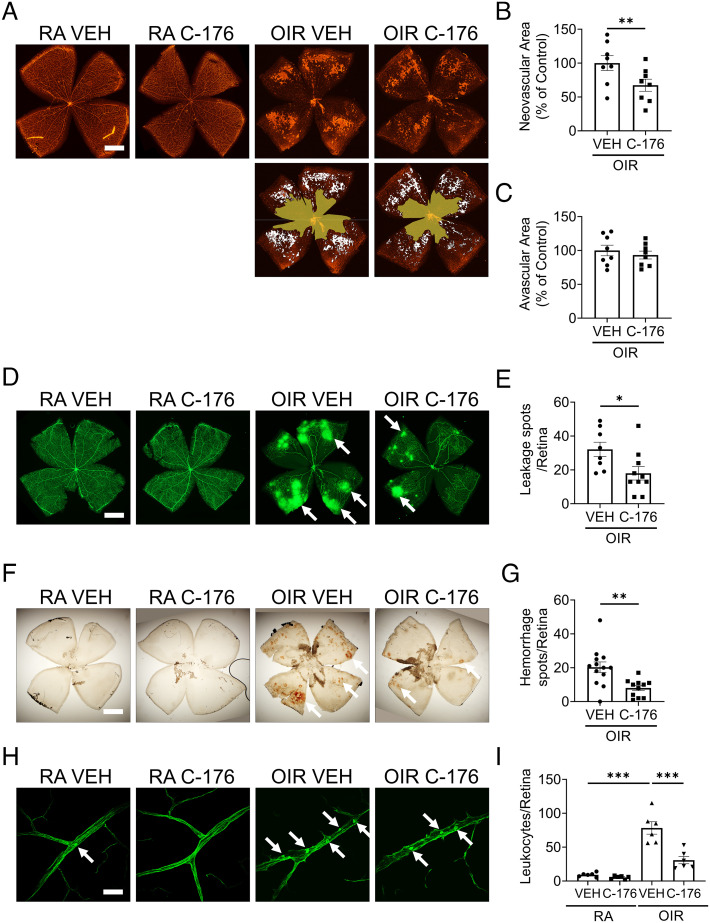
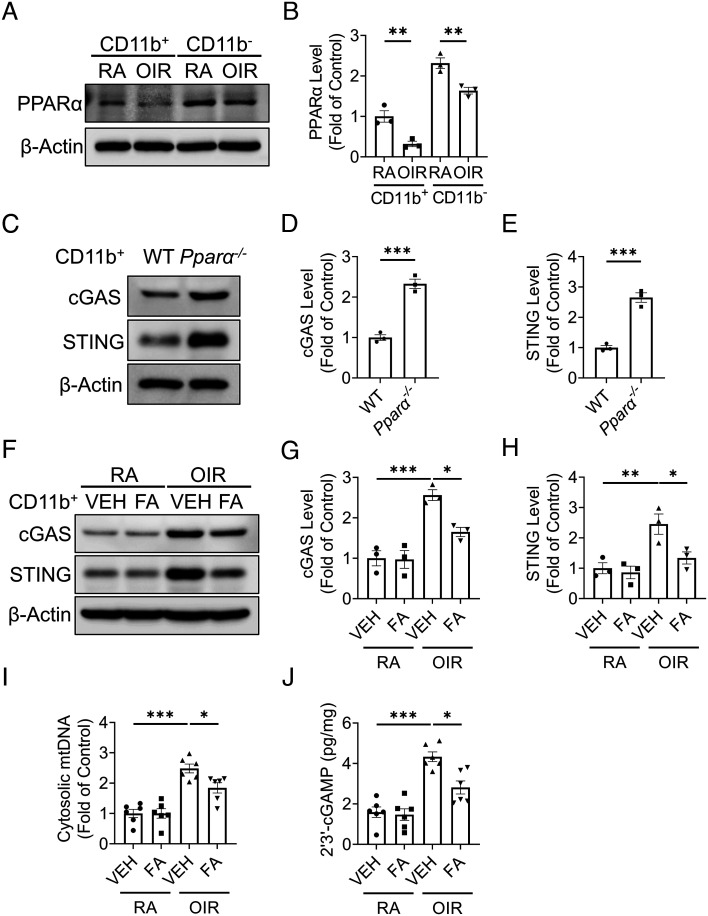
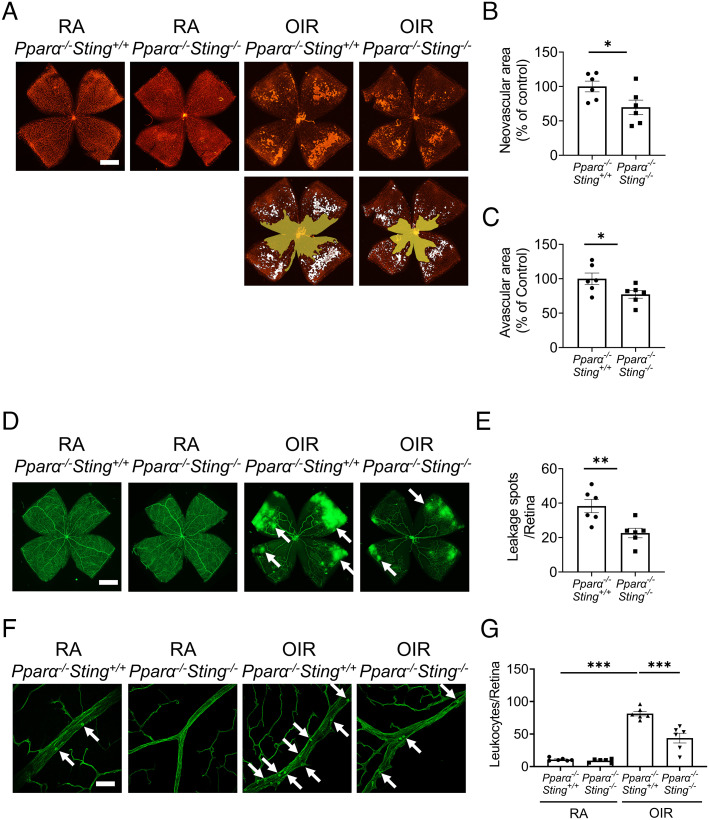
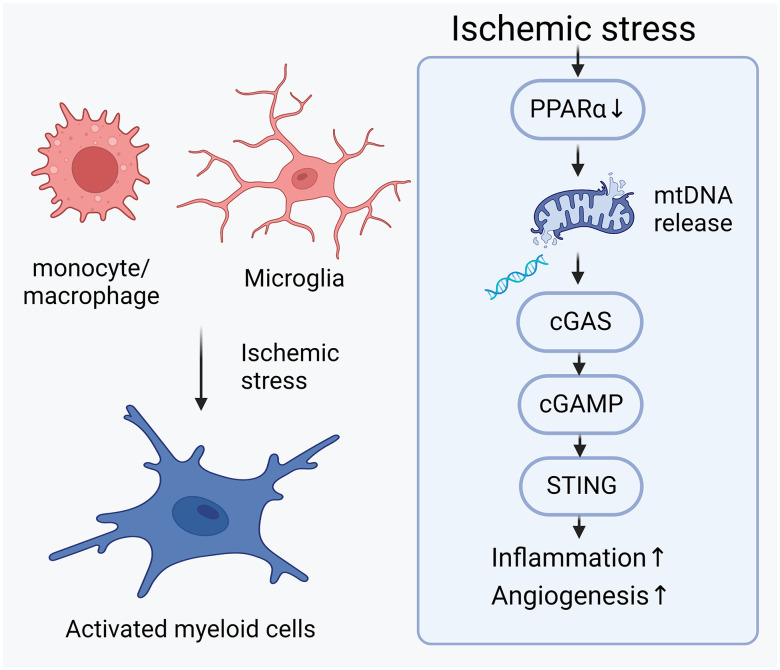
In ischemic retinopathy, overactivated retinal myeloid cells are a crucial driving force of pathological angiogenesis and inflammation. The cyclic GMP-AMP synthase (cGAS) and stimulator of interferon genes (STING) signaling are key regulators of inflammation. This study aims to investigate the association of cGAS-STING signaling with ischemic retinopathy and the regulation of its activation. We found that protein levels of cGAS and STING were markedly up-regulated in retinal myeloid cells isolated from mice with oxygen-induced retinopathy (OIR). Knockout of Sting and pharmacological inhibition of STING both alleviated retinal neovascularization (NV) and reduced retinal vascular leakage in OIR. Further, Sting knockout and STING inhibitor also alleviated leukocyte adhesion to retinal vasculature and infiltration into the retina as well as microglial activation in OIR. These results suggest that cGAS-STING signaling played a pathogenic role in retinal myeloid cell activation and NV in ischemic retinopathy. To identify the regulation of cGAS-STING signaling in OIR, we evaluated the role of transcription factor peroxisome proliferator-activated receptor α (PPARα). The results demonstrated that PPARα was down-regulated in OIR retinas, primarily in myeloid cells. Furthermore, Pparα knockout significantly up-regulated cGAS and STING levels in retinal CD11b+ cells, while PPARα agonist inhibited cGAS-STING signaling and cytosolic mitochondrial DNA (mtDNA) release, a causative feature for cGAS activation. Knockout of Sting ameliorated retinal NV, hyperpermeability, and leukostasis in Pparα-/- mice with OIR. These observations suggest that PPARα regulates cGAS-STING signaling, likely through mtDNA release, and thus, is a potential therapeutic target for ischemic retinopathy.

Keywords: PPARα; cGAS-STING signaling; ischemia-induced retinopathy; myeloid cells; neovascularization.


Conflict of interest statement

The authors declare no competing interest.

Figures

Fig. 1.
Fig. 1.
cGAS-STING signaling was up-regulated in the retinas of the OIR model. AC: Representative western blots of cGAS and STING in the retinas of OIR mice and RA controls at P12 (A), P14 (B), and P17 (C). D and E: Protein levels of cGAS and STING in (AC) were quantified by densitometry and normalized by β-actin levels (n = 6). F: mRNA levels of cGAS (Mb21d1) and STING (Tmem173) were measured in the retinas of OIR mice and controls at P14 (n = 6). Data were presented as mean ± SEM. *P < 0.05, **P < 0.01, ***P < 0.001.
Fig. 2.
Fig. 2.
cGAS-STING signaling was overactivated in retinal myeloid cells in the OIR model. A: Representative images of immunostaining for cGAS, STING, CD31, and CD11b in retinal cryosections of room air (RA) controls and OIR mice at P17. The white arrows indicated the cGAS and STING staining co-localized with CD11b staining. GCL: ganglion cell layer, IPL: inner plexiform layer, INL: inner nuclear layer, ONL: outer nuclear layer, and OPL: outer plexiform layer. (Scale bar: 50 µm.) B and C: cGAS and STING immunostaining intensities in (A) were quantified by ImageJ software (n = 6). D: Representative western blots of cGAS and STING in myeloid cells (CD11b+) and non-myeloid cells (CD11b) isolated from RA and OIR retinas at P17 using MACS separation. E and F: Protein levels of cGAS (E) and STING (F) in (D) were quantified by densitometry and normalized by β-actin levels (n = 3). G: Cytosolic mtDNA levels in isolated CD11b+cells were quantified by qPCR analysis using primers for a mitochondrial gene mt-Co1 (n = 5). H: Levels of 2′3′-cGAMP were measured in the CD11b+ and CD11b cells of RA and OIR retinas at P17 using 2′3′-cGAMP ELISA kit (n = 6). Data were presented as mean ± SEM. *P < 0.05, **P < 0.01, ***P < 0.001.
Fig. 3.
Fig. 3.
Knockout of Sting attenuated NV and vascular leakage in the OIR model. A: Representative images of isolectin-stained retinal flat mounts from Sting−/− mice and WT mice in the RA controls and OIR mice at P17. (Scale bar: 1 mm.) Neovascular areas and avascular areas were quantified and labeled with white color and yellow color, respectively. B and C: Neovascular areas (B) and avascular areas (C) in (A) were quantified (n = 10). D: Representative fluorescein angiography images of retina flat mounts perfused with FITC-dextran (70 kDa). (Scale bar: 1 mm.) The white arrows indicated the spots of vascular leakage. E: Numbers of vascular leakage spots in (D) were quantified (n = 9–10). F: Western blot analysis of VEGF and albumin in the perfused retinas of WT mice and Sting−/− mice in the OIR and RA groups at P17. G and H: Protein levels of VEGF (G) and albumin (H) in (F) were quantified by densitometry and normalized by β-actin levels (n = 6). Data were presented as mean ± SEM. **P < 0.01, ***P < 0.001.
Fig. 4.
Fig. 4.
Knockout of Sting attenuated the overactivation of retinal myeloid cells in the OIR model. A: Representative flow cytometric plots of retinal myeloid cells (CD45+CD11b+) in the retinas of WT and Sting−/− mice in RA control and OIR groups at P17. B: Flow cytometric quantification of retinal myeloid percentage in the retinal cells in (A) (n = 6). C: Representative flow cytometric plots of IL-1β+CD206+ in CD45+CD11b+ cells in the retinas of RA controls and OIR mice at P17. D: Flow cytometric quantification of IL-1β+CD206+ fractions in retinal CD45+CD11b+ cells in (C) (n = 6). EH: qRT-PCR analysis of Il1b, Tnfα, Ifnb1, and Vegf mRNA levels in MACS-isolated CD11b+ retinal cells at P17 (n = 6). Data were presented as mean ± SEM. *P < 0.05, **P < 0.01, ***P < 0.001.
Fig. 5.
Fig. 5.
Knockout of Sting reduced the number of leukocyte adhesion and macrophage infiltration in the retinas. A: Representative images of retinal leukostasis in WT and Sting−/− mice in RA control and OIR groups at P17. (Scale bar: 20 µm.) The white arrows indicated the adherent leukocytes. B: Quantification of adherent leukocytes in retinal vasculature of RA control and OIR mice in (A). C: Representative flow cytometric plots of macrophages (CD45high fractions in CD11b+F4/80+ cells) in the retinas of RA controls and OIR mice at P17. D: Quantification of retinal macrophages (CD45high percentage in CD11b+F4/80+ cells) in (C) (n = 6). E: qRT-PCR analysis of the Ccl2 mRNA expression in the retinas of RA controls and OIR mice at P17 (n = 8). Data were presented as mean ± SEM. ***P < 0.001.
Fig. 6.
Fig. 6.
STING inhibitor attenuated retinal NV, vascular leakage, and leukostasis in the OIR model. STING inhibitor C-176 (in 10% DMSO and 90% corn oil) was intraperitoneally injected into RA and OIR mice (21.5 mg/kg/day) from P12 to P17. A: Representative images of isolectin-stained retinal flat mounts of vehicle or C-176-treated RA and OIR mice at P17. (Scale bar: 1 mm.) The neovascular areas and avascular areas were labeled with white color and yellow color, respectively. B and C: The neovascular areas and avascular areas in (A) were measured (n = 8). D: Representative images of retina flat mounts perfused with FITC-dextran (70 kDa). (Scale bar: 1 mm.) The white arrows indicated the vascular leakage spots. E: Vascular leakage spots in (D) were quantified (n = 8–10). F: Representative images of hemorrhage spots on retinal flat mounts of vehicle or C-176-treated RA controls and OIR mice at P17. (Scale bar: 1 mm.) The white arrows indicate hemorrhage spots. G: Quantification of hemorrhage spots in (F) (n = 11–13). H: Representative images of retinal leukostasis in vehicle or C-176-treated RA control and OIR mice at P17. (Scale bar: 20 µm.) The white arrows indicated the adherent leukocytes. I: Quantification of adherent leukocytes in retinal flat mounts of vehicle or C-176-treated RA controls and OIR mice at P17 (n = 6). Data were presented as mean ± SEM. *P < 0.05, **P < 0.01, ***P < 0.001.
Fig. 7.
Fig. 7.
PPARα modulated cGAS-STING signaling in the OIR model. Myeloid cells (CD11b+) and non-myeloid cells (CD11b) were isolated from the retinas using the MACS method. A: Representative images of western blotting for PPARα in the myeloid cells and non-myeloid cells from the RA and OIR retinas at P17. B: Protein levels of PPARα in (A) were quantified by densitometry and normalized by β-actin levels (n = 3). C: Representative images of western blotting for cGAS and STING in myeloid cells from WT and Pparα−/− retinas at P17 at RA. D and E: Protein levels of cGAS (D) and STING (E) in (C) were quantified by densitometry and normalized by β-actin levels (n = 3). F: Representative images of western blotting for cGAS and STING in retinal myeloid cells isolated from RA controls and OIR mice treated with vehicle (VEH) or (FA, 25 mg/kg/day from P12 to P17). G and H: Protein levels of cGAS (G) and STING (H) in (F) were quantified by densitometry and normalized by β-actin levels (n = 3). I: Cytosolic mtDNA levels in retinal myeloid cells isolated from RA controls and OIR mice treated with VEH or FA. Cytosolic mtDNA levels were presented as the fold of VEH-treated RA group (n = 6). J: Levels of 2′3′-cGAMP were measured in retinal myeloid cells isolated from RA control and OIR mice treated with VEH or FA at P17 using 2′3′-cGAMP ELISA kit (n = 6). Data were presented as mean ± SEM. *P < 0.05, **P < 0.01, ***P < 0.001.
Fig. 8.
Fig. 8.
Knockout of Sting ameliorated retinal vascular pathologies in Pparα−/− OIR mice. A: Representative images of isolectin-stained retinal flat mounts from Pparα−/−Sting+/+ mice and Pparα−/−Sting−/− littermates in RA control and OIR groups at P17. (Scale bar: 1 mm.) The neovascular areas and avascular areas were labeled with white color and yellow color, respectively. B and C: The quantification of neovascular areas and avascular areas in (A) (n = 6). D: Representative images of retina flat mounts from Pparα−/−Sting+/+ mice and Pparα−/−Sting−/− littermates perfused with FITC-dextran. (Scale bar: 1 mm.) The white arrows indicated the vascular leakage spots. E: Vascular leakage spots in (D) were quantified (n = 6). F: Representative images of retinal leukostasis from Pparα−/−Sting+/+ mice and Pparα−/−Sting−/− littermates in RA control and OIR mice at P17. (Scale bar: 20 µm.) The white arrows indicated the adherent leukocytes. G: Quantification of adherent leukocytes in retinal flat mounts in (F) (n = 6). Data were presented as mean ± SEM. *P < 0.05, **P < 0.01, ***P < 0.001.
Fig. 9.
Fig. 9.
Pathogenic role of cGAS-STING signaling in ischemic retinopathy. Ischemic stress in the retinas transited the myeloid cells (including resident microglia and monocyte/macrophage derived from the bone marrow) from resting form to activated form. Downregulation of PPARα in the ischemic retina contributes to the mitochondrial stress, resulting in the release of mitochondrial DNA (mtDNA) into cytosol. Cytosolic mtDNA activated DNA sensor cGAS, which synthesized the second messenger 2′3′-cGAMP to activated downstream adaptor protein STING. Activation of cGAS-STING signaling in myeloid cells promoted the secretion of pro-inflammatory and pro-angiogenic cytokines, contributing to the inflammation and angiogenesis in ischemic retinas. The schematic figure was generated in BioRender.com.

Similar articles

Cited by

References

    1. Hartnett M. E., Penn J. S., Mechanisms and management of retinopathy of prematurity. N. Engl. J. Med. 367, 2515–2526 (2012). - PMC - PubMed
    1. Ding J., Wong T. Y., Current epidemiology of diabetic retinopathy and diabetic macular edema. Curr. Diab. Rep. 12, 346–354 (2012). - PubMed
    1. Wong W. L., et al. , Global prevalence of age-related macular degeneration and disease burden projection for 2020 and 2040: A systematic review and meta-analysis. Lancet Glob Health 2, e106–116 (2014). - PubMed
    1. Newman D. K., Surgical management of the late complications of proliferative diabetic retinopathy. Eye (Lond.) 24, 441–449 (2010). - PubMed
    1. Yang S., Zhao J., Sun X., Resistance to anti-VEGF therapy in neovascular age-related macular degeneration: A comprehensive review. Drug. Des. Devel. Ther. 10, 1857–1867 (2016). - PMC - PubMed

Publication types