. 2022 Nov 29;119(48):e2210379119.
doi: 10.1073/pnas.2210379119. Epub 2022 Nov 21.

Keratocytes migrate against flow with a roly-poly-like mechanism

Affiliations

Keratocytes migrate against flow with a roly-poly-like mechanism

Valentine Seveau de Noray et al. Proc Natl Acad Sci U S A. .

Abstract

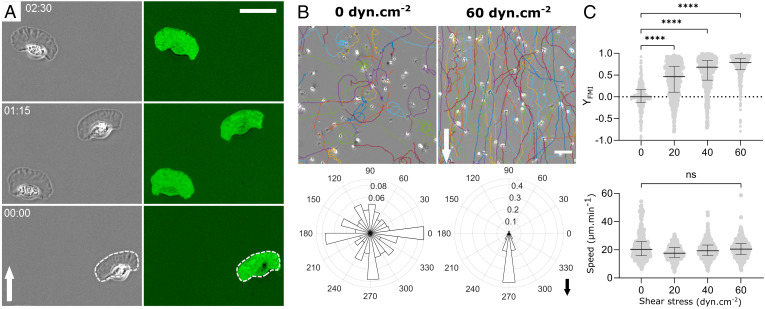
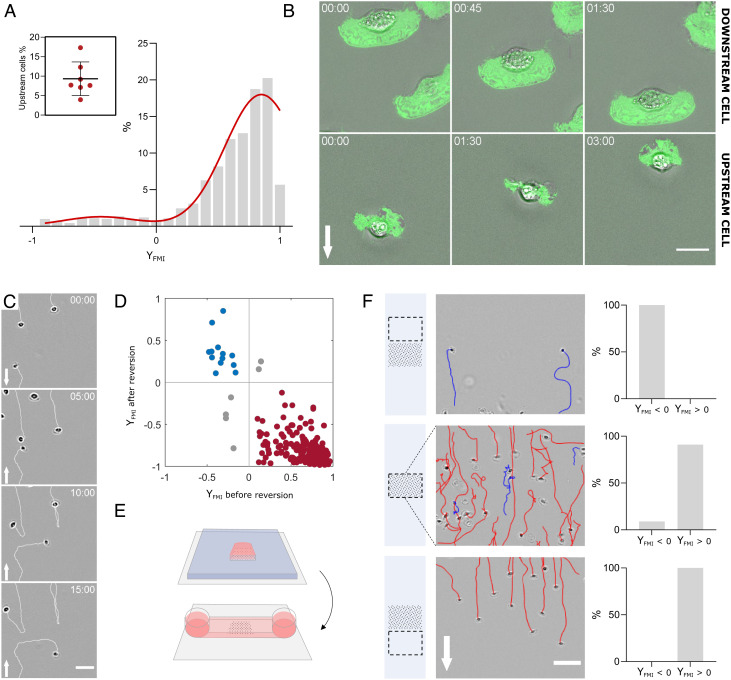
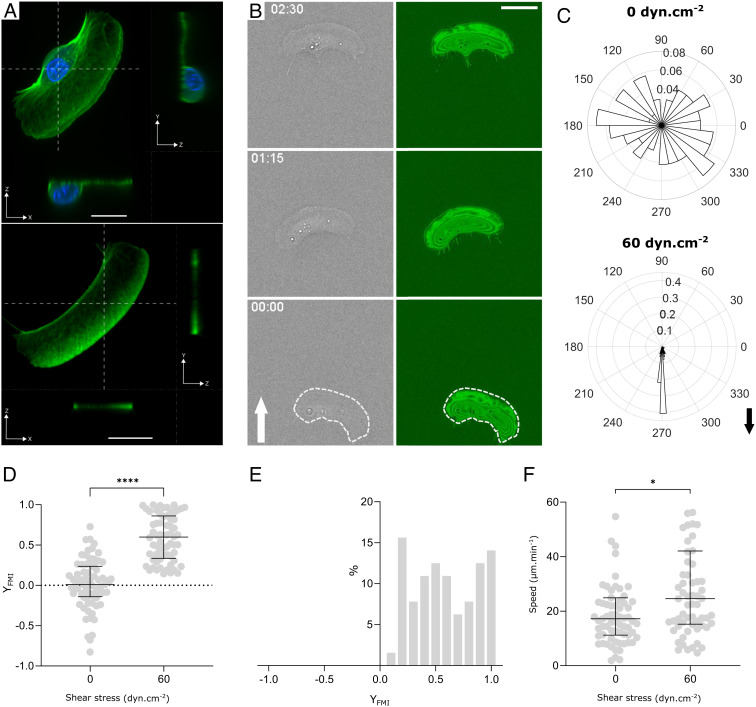
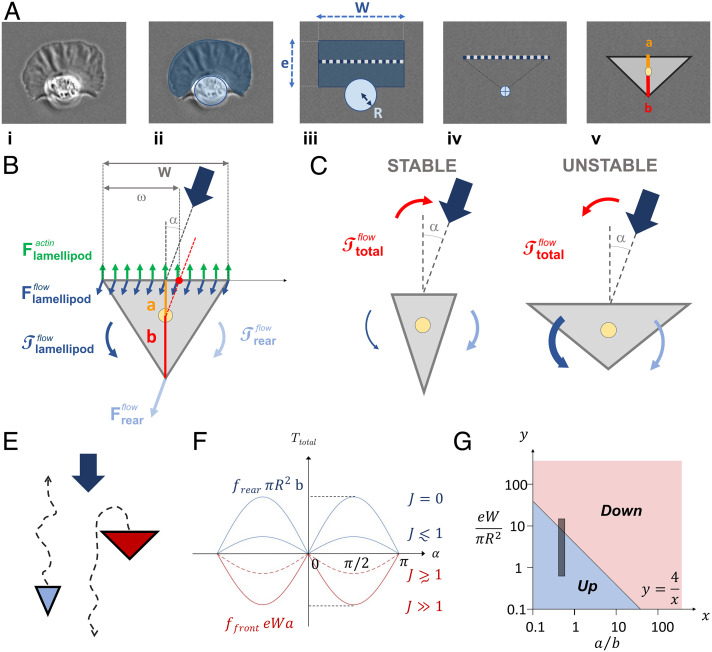
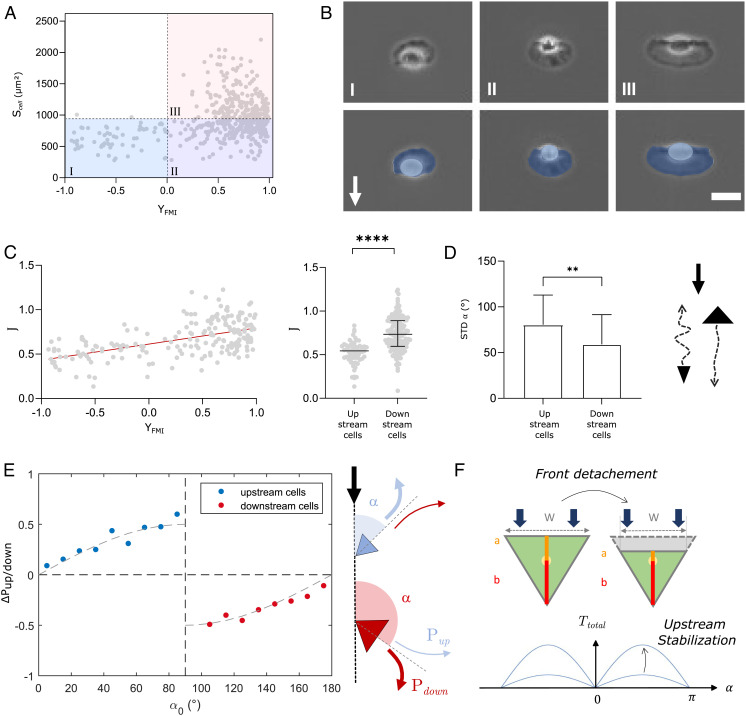
While cell migration can be directed by various mechanical cues such as force, deformation, stiffness, or flow, the associated mechanisms and functions may remain elusive. Single cell migration against flow, repeatedly reported with leukocytes, is arguably considered as active and mediated by integrin mechanotransduction, or passive and determined by a mechanical bias. Here, we reveal a phenotype of flow mechanotaxis with fish epithelial keratocytes that orient upstream or downstream at shear stresses around tens of dyn cm-2. We show that each cell has an intrinsic orientation that results from the mechanical interaction of flow with its morphology. The bulbous trailing edge of a keratocyte generates a hydrodynamical torque under flow that stabilizes an upstream orientation, just as the heavy lower edge of a roly-poly toy generates a gravitational torque that stabilizes an upright position. In turn, the wide and flat leading edge of keratocytes destabilizes upstream orientation, allowing the existence of two distinct phenotypes. To formalize these observations, we propose a simple mechanical model that considers keratocyte morphology as a hemisphere preceded by a wide thin sheet. Our findings show that this model can recapitulate the phase diagram of single cell orientation under flow without adjustable parameters. From a larger perspective, this passive mechanism of keratocytes flow mechanotaxis implies a potential absence of physiological function and evolution-driven process.

Keywords: directed migration; flow; keratocytes; mechanotaxis; mechanotransduction.


Conflict of interest statement

The authors declare no competing interest.

Figures

Fig. 1.
Fig. 1.
Keratocytes orient mainly downstream under flow. (A) Image sequences in phase-contrast mode (Left) and reflection interference contrast microscopy (RICM) mode (Right) of keratocytes crawling on glass. The contrast was inverted in RICM images and bright green corresponds to the adhesion fingerprint. The white dashed line underlines the apparent contour of cells in phase-contrast images. Time min:s. (Scale bar, 30 µm.) (Movie S1) (B) Cell trajectories in a representative experiment (Top) and rose plots showing the angular distribution of the trajectories taking into account the first and last points of each trajectory (Bottom) without flow (Left) and with a shear stress of 60 dyn cm−2 (Right). (Scale bar, 100 µm.) Three and seven independent experiments without and with flow, respectively, and 250 frames per cell with time interval 10 s, >200 cells per experiment. Arrows indicate flow direction. (C) Forward migration index YFMI (Top) and speed (Bottom) versus shear stress. Each data point corresponds to one cell tracked by 250 images taken every 10 s. Bars are median ± interquartile range. Kruskal–Wallis test, one-way ANOVA for non-Gaussian distribution, ****P < 0.0001. Two independent experiments, N > 400 cells per condition.
Fig. 2.
Fig. 2.
A subpopulation of keratocytes displays intrinsic upstream phenotype. (A) Histogram of forward migration index YFMI for individual cells is bimodal with a downstream-bound (90.7% of cells) population and an upstream-bound (9.3% of cells) population. Red line is a fit by a double Gaussian. Shear stress 60 dyn cm−2. Seven independent experiments, >200 cells per experiments, and 250 frames with time interval 10 s for each cell; values of each boxplot correspond to the average of all experiments. (Movie S2). Inset- Fraction of upstream-bound cells in each of the seven experiments. (B) Superposition of phase-contrast (gray) and inverted RICM (green) images of representative downstream-bound (Top) and upstream-bound (Bottom) cells. White arrows indicate flow direction. Shear stress 60 dyn cm−2. Time min:s. (Scale bar, 15 µm.) (Movies S1 and S7). (C) Image sequence showing downstream-bound and upstream-bound cells making U-turns after flow reversal at time t = 5 min. Arrow indicates flow direction. Shear stress is 60 dyn cm−2. (Scale bar, 50 µm, time min:s.) (Movie S3). (D) 2D plot of forward migration indexes YFMI for individual cells before and after flow reversal (red for downstream, blue for upstream) under a shear stress of 60 dyn cm−2. Data from two independent experiments, >100 cells per experiments, 300 frames per cell with time interval 20 s, and flow reversal at the 150th frame. Spearman’s correlation: rSpearman = −0.6. (E) Cartoon illustrating the cell seeding process in a stripe. A PDMS stencil (blue) with a 5 × 5 mm opening is used to seed cells in a selective zone of a coverslip (gray) (Top). After seeding, the stencil is replaced by an IBIDI channel (Bottom). Pink corresponds to medium and black dotted area to the cell seeding zone. (F) Functional cell sorting by flow mechanotaxis. (Left) Cartoon illustrating the imaging zone (dashed rectangle) relative to the initial seeding zone (black dotted area). (Middle) Images and tracks from a representative experiment (red for downstream, blue for upstream) of cells above, inside, and the below the seeding zone at 60 dyn cm−2. Arrows indicate flow direction. (Scale bar, 100 µm.) (Right) Percentage of cells with up- or down-stream orientation above, inside, and below the seeding zone. Data from three independent experiments, >200 cells per experiments. (Movie S4).
Fig. 3.
Fig. 3.
Trailing edge is required for upstream phenotype. (A) Confocal images of a whole keratocyte (Top) and of a fragment of keratocyte lamellipod (Bottom) with immunostaining of membrane (green) and nucleus (blue). x–y images correspond to projected images, while x–z and y–z images correspond to cross-sections at planes indicated by white dashed lines. (Scale bar, 10 µm.) (B) Sequences of phase-contrast (gray) and inverted RICM (green) images of a fragment crawling on glass. The white arrow indicates the flow direction. The white dashed line underlines the apparent contour of cells in phase-contrast images. Shear stress is 60 dyn cm−2. Time min:s. (Scale bar, 10 µm.) (Movie S5). (C) Angle histogram showing the distribution of fragment orientation with and without shear stress of 60 dyn cm−2. The length of each bin of the rose plots reflects the fraction of cells with a given angle. Black arrow indicates the flow direction. (D) Forward migration index YFMI versus shear stress. Each data point corresponds to one fragment tracked by 250 images taken every 10 s. Data from two independent experiments, >30 fragments per experiment. Bars are median ± interquartile range. Student’s t test, ****P < 0.0001. (E) Histogram of YFMI for individual fragments displays a downstream-bound population. Shear stress is 60 dyn cm−2. Data from two independent experiments, >30 fragments per experiment, 250 frames taken every 10 s. (F) Speed versus shear stress. Data from two independent experiments, >30 fragments per experiment. Bars are median ± interquartile range. Welsh’s t test, *P = 0.0351.
Fig. 4.
Fig. 4.
A mechanical model explains the versatile orientation of keratocytes under flow by the orientation of torque exerted by flow on the asymmetric cell morphologies. (A) Rationale for a triangle cell model. i) A keratocyte is composed of ii) a flat lamellipod in front (dark blue) and a protruding cell rear (light blue). iii) To calculate flow interactions on cell body, we consider the lamellipod as a thin rectangle of dimensions e and W (dark blue) and the cell rear body as a hemisphere of radius R (light blue). In a solid mechanic approach, we reduce the action of flow to its action on the median of the rectangular leading edge (dashed line) and the center of mass of the circular trailing edge (crossed dot). iv) This frontal median and the rear vertex define a minimal triangle keratocyte. v) The distance between the frontal edge and the rear vertex of the triangle cell with the center of rotation of the triangle cell (yellow dot) is called a and b, respectively. (B) Schematics of forces and torques exerted on a triangle keratocyte facing flow at a finite angle α. The internal forces of actin polymerization (green arrow) push cell forward, while flow pushes the frontal edge (dark blue) and rear vertex (light blue) downstream. (C) Schematics of cells with geometric features fostering either stable or unstable upstream phenotype. (D) Schematics illustrating the phase separation into upstream and downstream phenotypes depending on cell morphologies. (E) Total torque versus angle α for different morphologies (J values) according to Eq. 5. (F) Phase diagram of upstream (blue) and downstream (red) phenotypes depending on cell morphological parameters πR2eW and ba according to Eq. 5 and considering a value frearffront= 4 (34, 35). The gray zone delineates the domain of morphologies observed for keratocytes in our experiments.
Fig. 5.
Fig. 5.
Keratocyte morphology controls orientation under flow consistently with the model of torque on a triangle cell. (A) 2D plot of cell orientation under flow YFMI (at 60 dyn cm−2) and cell surface area Scell. Linear regression yields rPearson=0.31. Two independent experiments, >200 cells per experiments, 250 frames with time interval 10 s for each cell. (B) Representative images of cells in quadrants I, II, and III of 2D plot in A (Top) and with Lamellipods colored in dark blue and cell body in light blue (Bottom). White arrow shows flow direction. (Scale bar, 20 µm.) (C) Correlation between single cell orientation and morphology. (Left) 2D plot of forward migration index YFMI (at 60 dyn cm−2) and control parameter J18Scell-SrearSrear. Linear regression (red line) yields rPearson= 0.54. (Right) Control parameter J18Scell-SrearSrear for upstream- and downstream-bound cells in two independent experiment, N > 100 cells per experiment, 250 frames with time interval 10 s for each cell. Unpaired t test, ****P < 0.001. (D) Effect of torque intensity on guidance strength. (Left) Standard deviation of cell orientation for upstream- and downstream-bound cells. Unpaired t test, P = 0.0035. (Right) Cartoons of cells with upstream or downstream orientation: the arrows illustrate tracks with fluctuations of direction. (E) Effect of torque intensity on instant guidance. (Left) Preferential probability to turn upstream, ΔPup/down = 2Pup−1, versus the angle between cell and flow directions α, for (blue) upstream- and (red) downstream-bound cells. 337 cells, 250 frames with time interval 10 s for each cell. The lines are sine functions. (Right) Cartoons of cells with upstream or downstream orientation and arrows representing instant probabilities to turn upstream, Pup, or downstream, Pdown. (F) Effect of lamellipod detachment on a triangle cell facing flow (green indicates adherent footprint). Reduction of a and W (Top) stabilizes upstream phenotype (Bottom) according to Eq. 5.

Similar articles

Cited by

References

    1. SenGupta S., Parent C. A., Bear J. E., The principles of directed cell migration. Nat. Rev. Mol. Cell Biol. 22, 529–547 (2021). - PMC - PubMed
    1. Carter S. B., Haptotaxis and the mechanism of cell motility. Nature 213, 256 (1967). - PubMed
    1. Dineur E., Note sur la sensibilité des leucocytes à l’électricité. Bull Séances Soc Belge Microsc. 18, 113–118 (1891).
    1. Blakemore R., Magnetotactic bacteria. Science 190, 377–379 (1975). - PubMed
    1. Sunyer R., Trepat X., Durotaxis. Curr. Biol. 30, R383–R387 (2020). - PubMed

Publication types

LinkOut - more resources