. 2022 Nov 29;119(48):e2208058119.
doi: 10.1073/pnas.2208058119. Epub 2022 Nov 21.

T cell and B cell antigen receptors share a conserved core transmembrane structure

Affiliations

T cell and B cell antigen receptors share a conserved core transmembrane structure

Samyuktha Ramesh et al. Proc Natl Acad Sci U S A. .

Abstract

The B cell and T cell antigen receptors (BCR and TCR) share a common architecture in which variable dimeric antigen-binding modules assemble with invariant dimeric signaling modules to form functional receptor complexes. In the TCR, a highly conserved T cell receptor αβ (TCRαβ) transmembrane (TM) interface forms a rigid structure around which its three dimeric signaling modules assemble through well-characterized polar interactions. Noting that the key features stabilizing this TCRαβ TM interface also appear with high evolutionary conservation in the TM sequences of the membrane immunoglobulin (mIg) heavy chains that form the BCR's homodimeric antigen-binding module, we asked whether the BCR contained an analogous TM structure. Using an unbiased biochemical and computational modeling approach, we found that the mouse IgM BCR forms a core TM structure that is remarkably similar to that of the TCR. This structure is reinforced by a network of interhelical hydrogen bonds, and our model is nearly identical to the arrangement observed in the just-released cryo-electron microscopy (cryo-EM) structures of intact human BCRs. Our biochemical analysis shows that the integrity of this TM structure is vital for stable assembly with the BCR signaling module CD79AB in the B cell endoplasmic reticulum, and molecular dynamics simulations indicate that BCRs of all five isotypes can form comparable structures. These results demonstrate that, despite their many differences in composition, complexity, and ligand type, TCRs and BCRs rely on a common core TM structure that has been shaped by evolution for optimal receptor assembly and stability in the cell membrane.

Keywords: B cell receptor; antigen receptor; receptor assembly; receptor structure; transmembrane.


Conflict of interest statement

The authors declare no competing interest.

Figures

Fig. 1.
Fig. 1.
The B and T cell antigen receptors share highly conserved Y and T residues in their antigen-binding subunit TM domains. (A) Components of the BCR complex: ligand-binding mIg and signaling CD79AB. Structures shown of mIgM extracellular domains are from PDB IDs 6KXS, 4JVU and 1ADQ, and CD79AB from Alphafold2 prediction. (B) Components of the TCR complex: ligand-binding TCRαβ and signaling CD3δε, CD3γε, and ζζ. PDB IDs: 6JXR human αβ TCR extracellular domains and TM domains, 2K4F CD3ε tail with ITAM tyrosines shown in yellow. Inset: top view of the TCR complex showing the TM domain with assembly-mediating basic (blue) and acidic (red) residues as spheres. Gray box around the TM domains represents the cell membrane. (C) TCR αβ TM model generated by experimentally restrained modeling (18) showing key polar interactions at the dimer interface. Assembly-mediating basic residues are colored blue. (D) Weblogos showing evolutionary conservation of the TM domain sequences of over 65 species of TCR αβ/γδ and all isotypes of mouse and human BCR mIgs. Polar uncharged residues are colored orange, basic residues in blue, and acidic residues in red. The highly conserved Y and T residues (boxed in red) found at the TCR αβ interface are also highly conserved and similarly spaced in mIg. TCR numbering is based on Dong et al. (9). BCR numbering starts from the beginning of its TM domain.
Fig. 2.
Fig. 2.
In vitro assembly of the BCR complex in ER microsomes. (A) BCR mIg HC, CD79A, and CD79B were assembled by in vitro translation in ER microsomes for 4 h. The assembled complexes were extracted in 0.5% digitonin and immunoprecipitated targeting either the HC (anti-FLAG beads) or total CD79 (streptavidin and anti-HA beads) (Left). Samples were deglycosylated with Endo H and analyzed by nonreducing SDS-PAGE. Each IP strategy yielded all chains of the BCR, showing assembly of the complex. Alternatively, a sequential nondenaturing IP from CD79A to B (streptavidin to anti-HA) could purify CD79AB heterodimers and all associated BCR chains (Right). *: mixing control reaction where HC and CD79 chain mRNAs were added to separate IVT reactions and combined at the extraction step. The lack of co-IP of HC with CD79AB shows that only cotranslationally assembled BCR complexes survive the IP. (B) Schematic showing the BCR chains and their C-terminal affinity tags. The extracellular portion removed in the HCtrunc construct is boxed in red. The cysteines mutated to serines in the C-less construct are highlighted in yellow. (C) HCtrunc and C-less HCs are capable of assembling into BCR complexes comparable to WT. Complexes were assembled as described in (A).
Fig. 3.
Fig. 3.
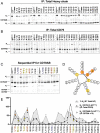
Cysteine scanning of the mIg HC TM domain identifies highly specific crosslinks. (A–C) Cysteine mutants generated on the C-less HCtrunc background were assembled into BCR complexes by IVT for 4 h. Complexes were extracted in 0.5% digitonin and immunoprecipitated targeting (A) HC (anti-FLAG), (B) total CD79 (streptavidin and anti-HA), or (C) CD79AB (snIP from streptavidin to anti-HA). Samples were Endo H-treated and analyzed by nonreducing SDS-PAGE. Most cysteine mutants were able to form crosslinked dimers (A), while only a subset of them assembled with CD79 (B). These were further refined to three key cysteine mutants (orange) that formed strong dimers and also assembled with CD79AB heterodimers: L1C, A5C, and S19C (C). Weaker CD79AB-associated HC dimers are colored yellow. (D) Positioning of these strong (orange) and weak (yellow) crosslinks on a helix wheel diagram reveals a likely interaction face on the mIg HC TM helix. (E) Summary plot showing the helical periodicity of the crosslinks. Densitometry was performed on the experiments shown in panels AC and the normalized yield of HC dimer was plotted. Solid gray line and gray dots: Yield of H2 as a percentage of total H from total HC IP (representative autoradiogram in A); line traces the mean of N = 2 and dots show individual data points. Dashed black line and black dots: Yield of H2 with respect to CD79A, as a percentage of HCtrunc. Calculated from total CD79 IP (representative autoradiogram in B); line traces the mean of N = 2 and dots show individual data points. Diamonds: Yield of H2 with respect to CD79AB, as a percentage of HCtrunc. Calculated from sequential CD79A to B IP (representative autoradiogram in C); mean ± SD, N=3. Strongest, assembly-competent crosslinks are highlighted in orange and weaker crosslinks in yellow.
Fig. 4.
Fig. 4.
Experimentally guided MD simulations reveal an mIgM TM dimer structure. (A) Sequence of mIgM HC TM domain with the strongest (orange sold lines) crosslinks identified. The strong crosslinks were used as distance restraints for REMD simulations. (B) Cβ–Cβ distances between the restraining residue pairs over the REMD simulation are maintained at ~4 Å. (C) REMD model of the mIgM TM dimer with positions of strongest crosslinks highlighted in orange. (D) Contact probability map between all modeled TM residues, averaged over the five replicas from the last 200 ns of the unrestrained simulations. Contacting residue pairs are defined as those within 4.5 Å heavy atom distance. (E) Cα RMSD between the unrestrained MD simulations and the mIgM REMD model over the indicated simulation time. Each of the five replicas are shown as different colors.
Fig. 5.
Fig. 5.
Interactions at the mIg TM interface are crucial for stable BCR assembly. (A) Top: Side view of C-terminal end of the mIgM TM dimer with the residues involved in interfacial hydrogen bonding colored cyan. Bottom: Top-down view of the hydrogen bonding network. (BE) The requirement for hydrogen bonding and/or close packing at the mIg TM interface for BCR assembly was tested with mutations that removed hydrogen bonding capability or increased steric bulk. Full-length HC proteins with the indicated mutations were assembled with CD79A and B by IVT. BCR complexes were extracted in digitonin and immunoprecipitated targeting total CD79 (simultaneous streptavidin and anti-HA capture). Samples were deglycosylated and analyzed by reducing SDS-PAGE. Representative autoradiogram is shown in (B). (C and D) Densitometry was performed on the autoradiograms and the yield of HC with respect to CD79A (as a percentage of WT) was plotted as a measure of assembly competence of the mutants. N = 3, error bars show SD, significance with respect to WT (C and D) or between the indicated mutants (E) calculated by RM one-way ANOVA with uncorrected Fisher’s LSD test and single pooled variance, *P <0.05, **P < 0.01, ***P < 0.001, ****P< 0.0001.
Fig. 6.
Fig. 6.
BCR mIg and TCR αβ TM domains form highly similar dimeric structures. (A) Alignment of the TM domains of BCR mIgM (blue) and TCR αβ (yellow and pink, PDB ID: 6JXR (9)). Residues aligned: mIg W2-F25, TCRα N246-R269, TCRβ L276-L299, numbering based on Fig. 1. The backbone Cα RMSD between mIgM and TCRαβ TM domains is 0.68 Å. (B) Hydrogen bonding stabilizes the lower half of both interfaces, with the BCR mIg containing a polar network among Ser, Tyr, and Thr residues and TCR αβ containing a network involving Asn, Tyr, and Thr. The shared Y–T staple is highlighted in cyan. (C) Sequences of other immune protein dimers which are also stabilized by the Y–T staple (cyan).
Fig. 7.
Fig. 7.
BCR mIgs of all the five isotypes can form similar homodimeric TM structures. (A) TM domain sequences of the five mouse mIg isotypes. The residues involved in the mIg TM interfacial polar network are colored cyan. (B) Representative snapshot from the modeling of the mIg TM domains (blue) equilibrated in fully atomistic POPC bilayers (white) over five 500 ns simulations. Shown together are potassium (green) and chloride ions (purple). Water, hydrogen, and components in front of the mIg TM domains are omitted for clarity. (C) Overlay of the structures adopted by the five mIg isotypes (gray) with respect to the mIgM REMD model (blue, used to define backbone Cα starting coordinates for all isotypes). Most isotypes formed structures highly similar to mIgM, with only mIgD showing some looser packing at the top end. Interfacial Ser, Tyr, and Thr polar network residues are colored cyan. The position of T5 in mIgA, where an additional hydrogen bond was seen, is also indicated. (D) Top-down view of the polar network interactions in the five mIg isotypes based on the hydrogen bond occupancy analysis (Table 1).

Similar articles

Cited by

References

    1. Berry R., Call M. E., Modular activating receptors in innate and adaptive immunity. Biochemistry 56, 1383–1402 (2017). - PubMed
    1. Reth M., Antigen receptor tail clue. Nature 338, 383 (1989). - PubMed
    1. Alt F. W., et al. , Synthesis of secreted and membrane-bound immunoglobulin mu heavy chains is directed by mRNAs that differ at their 3’ ends. Cell 20, 293–301 (1980). - PubMed
    1. Early P., et al. , Two mRNAs can be produced from a single immunoglobulin mu gene by alternative RNA processing pathways. Cell 20, 313–319 (1980). - PubMed
    1. Hombach J., Tsubata T., Leclercq L., Stappert H., Reth M., Molecular components of the B-cell antigen receptor complex of the IgM class. Nature 343, 760–762 (1990). - PubMed

Publication types

Substances