. 2023 Jan 3;11(1):56-71.
doi: 10.1158/2326-6066.CIR-22-0260.

CD73 Inhibits cGAS-STING and Cooperates with CD39 to Promote Pancreatic Cancer

Affiliations

CD73 Inhibits cGAS-STING and Cooperates with CD39 to Promote Pancreatic Cancer

Célia Jacoberger-Foissac et al. Cancer Immunol Res. .

Abstract

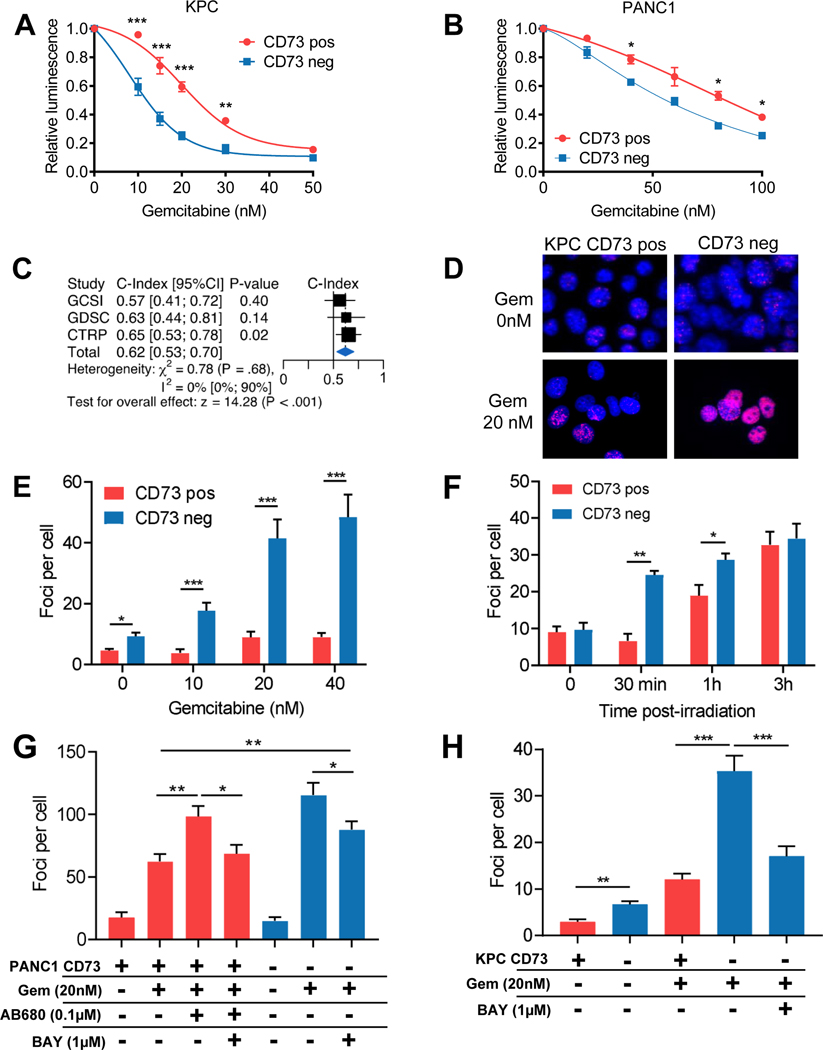
The ectonucleotidases CD39 and CD73 catalyze extracellular ATP to immunosuppressive adenosine, and as such, represent potential cancer targets. We investigated biological impacts of CD39 and CD73 in pancreatic ductal adenocarcinoma (PDAC) by studying clinical samples and experimental mouse tumors. Stromal CD39 and tumoral CD73 expression significantly associated with worse survival in human PDAC samples and abolished the favorable prognostic impact associated with the presence of tumor-infiltrating CD8+ T cells. In mouse transplanted KPC tumors, both CD39 and CD73 on myeloid cells, as well as CD73 on tumor cells, promoted polarization of infiltrating myeloid cells towards an M2-like phenotype, which enhanced tumor growth. CD39 on tumor-specific CD8+ T cells and pancreatic stellate cells also suppressed IFNγ production by T cells. Although therapeutic inhibition of CD39 or CD73 alone significantly delayed tumor growth in vivo, targeting of both ectonucleotidases exhibited markedly superior antitumor activity. CD73 expression on human and mouse PDAC tumor cells also protected against DNA damage induced by gemcitabine and irradiation. Accordingly, large-scale pharmacogenomic analyses of human PDAC cell lines revealed significant associations between CD73 expression and gemcitabine chemoresistance. Strikingly, increased DNA damage in CD73-deficient tumor cells associated with activation of the cGAS-STING pathway. Moreover, cGAS expression in mouse KPC tumor cells was required for antitumor activity of the CD73 inhibitor AB680 in vivo. Our study, thus, illuminates molecular mechanisms whereby CD73 and CD39 seemingly cooperate to promote PDAC progression.


Figures

Figure 1.
Figure 1.. CD73 gene expression is associated with poor PDAC prognosis.
(A) Meta-analysis of CD73 gene expression (median) with 5-year overall survival (5-y OS). Forest plot displays the log hazard ratios (logHR) and 95% confidence intervals (CI). Horizontal bars represent the 95% CI of effect-size. Blue diamond represents the overall effect in all PDAC patients. (B) Association between CD73 gene expression (median) and OS in CD39-High PDAC (CD73 Low: n=37; CD73 High: n=36) and CD39-Low PDAC (CD73 Low: n=37; CD73 High: n=36) from the TCGA cohort. (C) Spearman correlation heatmap between ENTPD1 (CD39), NT5E (CD73), PDCD1 (PD-1), LAG3, CTLA4, TIGIT and three signatures (CYT, CD8, and Treg) in 179 PDAC patients from the TCGA cohort. Cells are colored according to Spearman’s correlation coefficient values, with blue indicating a positive correlation and red indicating a negative correlation.
Figure 2.
Figure 2.. Tumor CD73 and stromal CD39 protein expression associate with poor PDAC prognosis and suppressed immune surveillance.
(A-B) Representative immunofluorescence staining of CD73 expression in epithelium (A) and CD39 expression in stroma (B) of PDAC tumors. Epithelium was determined as the compartment expressing cytokeratin (CK, green). Stroma is the CK-negative compartment. CD73, red; DAPI, blue. (C-D) Mean fluorescence intensity (MFI) of epithelial and stromal CD73 (C) and CD39 (D) expression in 104 normal adjacent pancreas (N) versus intratumoral compartment (IT) (red bars indicate mean). (E-F) Association between CD73 expression in tumor epithelium (CD73 Low: n=69; CD73 High: n=35) (E) or CD39 expression in tumor stroma (CD39 Low: n=73; CD39 High: n=36) (F) with overall survival (OS), using the upper tertile as cut-off. (G-H) Combined prognostic value of CD8 infiltration with CD73 protein expression in epithelial tissue (G) (CD73_Low/CD8_Low: n=13; CD73_Low/CD8_High: n=55; CD73_High/CD8_Low: n=8; CD73_High/CD8_High: n=28) or CD39 protein expression in tumor stroma (H) with OS. Patients were stratified into four groups depending on expression, using upper tertile as cut-off for CD73 and CD39 and upper-quartile for CD8 (CD39 Low/CD8 Low: n=16; CD39 Low/CD8 High: n=56; CD39 High/CD8 Low: n=4; CD39 High/CD8 High: n=33) (I) Soluble CD73 (sCD73) in the serum of healthy patients (n=10) compared to patients with benign hepato-biliary disease (n=10) or PDAC patients (n=248)(median, interquartile range and 95%CI are shown). (J) Association between sCD73 and patient outcomes (Low: n=178; High: n=60), using upper quartile as a cut-off. Statistical significance was determined with Student T test (C-D), Log-rank test (E-H, J) or Wilcoxon rank-sum test (I). *P<0.05, **P<0.01, ***P<0.001, ns: not significant.
Figure 3.
Figure 3.. CD73 on tumor cells and myeloid cells promotes mouse PDAC.
(A) CD73-positive (pos) or -negative (neg) KPC tumor cells were injected s.c. into C57BL/6 mice and treated with gemcitabine (gem; i.p. 100 mg/kg) on days 5 and 8. Mean tumor sizes are shown ± SEM (n=9–11). (B) KPC tumors were analyzed at day 11 by qPCR for expression of selected immune genes. Data represent mean relative expression ± SEM compared to CD73-positive tumors. (C) KPC tumors were analyzed at day 11 by FACS to assess the proportion of CD11b+Ly6GLy6Clo/− cells (TAMs) expressing CD206. Data represent individual and mean frequencies of TAM ± SEM gated on CD45+ cells. (D-E) CD73-negative KPC tumor cells were injected s.c. into CD73fl/fl LysMCre−/− mice (n=9) and into CD73fl/fl LysMCre+/− mice (n=12). On day 11, tumors were weighed (D) and the proportion of CD206+ TAMs was assessed by FACS. Data are representative of 2 independent experiments (n=9–10/group). Statistical comparisons were performed using one-way ANOVA comparing indicated groups (A, C), multiple t-test or unpaired t-test (B, D, E). *P<0.05, **P<0.01, ***P<0.001, ns: not significant.
Figure 4.
Figure 4.. CD39 cooperates with CD73 to promote mouse PDAC.
(A) KPC tumor cells were injected s.c. into CD39fl/fl LysMCre−/− mice and CD39fl/fl LysMCre+/− mice. Mean tumor sizes are shown ± SEM (n=10). (B-C) KPC tumors from CD39fl/fl and LysMCre+/− CD39fl/fl mice were analyzed by FACS at day 11 to measure the proportion of CD206+ TAMs and tumor-infiltrating lymphocytes (mean are shown ± SEM). (D) In vitro spheroids composed of ovalbumin-expressing KPC (KPC-ova) and pancreatic stellate cells (WT or CD39−/−) were cultured with OT-I cells (WT or CD39−/−). The frequency of IFN-γ producing OT-I cells was measured 8 hours later by FACS (n=3/group; means ± SEM are shown). (E) Ova-expressing KPC tumors injected s.c. into C57BL/6 mice were treated with gemcitabine (i.p. 100 mg/kg, day 7 and 10) and/or anti-CD39 (i.p. 400 μg, every three days from day 7 to 22). Mean tumor sizes ± SEM are shown (n= 8–10). (F) Ova-expressing KPC tumors injected s.c. into C57BL/6 mice were treated with gemcitabine (i.p. 100 mg/kg, day 7 and 10) and/or AB680 (10 mg/kg s.c. daily from day 6 to 11). Mean tumor sizes ± SEM are shown (n= 8–10). (G) Ova-expressing KPC tumors injected s.c. into CD39+/+ (WT) or CD39−/− (KO) C57BL/6 mice were treated with gemcitabine (i.p. 100 mg/kg on days 6 and 9) and the CD73 inhibitor AB680 (10 mg/kg s.c. daily from day 6 to 11). Survival of mice shown. (H) Ova-expressing KPC tumors injected s.c. into C57BL/6 mice were treated with AB680 (10 mg/kg s.c. daily from day 6 to 10) and/or anti-CD39 (i.p. 400 μg, on day 3, 6 and 9). On day 11, tumors were analyzed by FACS (means ± SEM are shown). All experiments were performed twice. Statistical comparisons were performed using Mann-Whitney test (A, E), unpaired t-test (B, D, F), multiple T-test (C, H), or log-rank test (G). *P<0.05, **P<0.01, ***P<0.001, ns: not significant.
Figure 5.
Figure 5.. CD73 promotes DNA damage repair and suppresses cGAS-STING activation.
(A-B) CD73-positive (pos) or -negative (neg) KPC and PANC1 cells were exposed to increasing concentrations of gemcitabine, and proliferation was measured using CellTiter-Glo (Promega) after 48 hours of treatment. Data represents the average relative luminescence units (RLU) ± SEM of triplicates and is representative of 4 independent experiments. (C) Meta-analysis of CD73 gene association with sensitivity to gemcitabine in PDAC cell lines from the Genentech Cell Line Screening Initiative (gCSI), the Genomics of Drug Sensitivity in Cancer (GDSC), and the Cancer Therapeutics Response Portal (CTRP) datasets. Forest plot displaying the C-Index and 95% confidence intervals (CI) for each dataset. Horizontal bars represent the 95% confidence intervals of effect-size. The blue diamond represents the overall effect of the variable. (D) Representative images of γ-H2AX foci detected by immunofluorescence. (E) Number of γ-H2AX foci detected by immunofluorescence in CD73-positive or -negative KPC tumor cells following 48 hours of gemcitabine treatment at the indicated doses (n=4; mean ± SEM). (F) Number of γ-H2AX foci over time detected by immunofluorescence in KPC tumor cells following 1 Gy irradiation (n=3; mean ± SEM). (G) Number of γ-H2AX foci detected in human PANC1 cells treated with gemcitabine, CD73 inhibitor AB680, and/or A2B receptor agonist BAY 60–6583 (n=3; mean ± SEM). (H) Number of γ-H2AX foci detection after 48 hours of gemcitabine treatment in KPC tumor cells, in presence or absence of BAY 60–6583 (A2B receptor agonist)(n=3; mean ± SEM). (I) CD73-positive or -negative KPC tumor cells were exposed to gemcitabine (20 nM) for 48 hours and cGAMP was measured in supernatants by ELISA (n=3; mean ± SEM). (J) Following gemcitabine exposition, cGAS-induced gene expression in KPC cells was measured by qPCR (n=2; mean ± SEM). (K) CD73-positive KPC tumor cells expressing cGAS or not were injected in mice (n=10 per group). Some groups were treated with AB680 (peri-tumoral, 10mg/kg daily from day 6 to 11). Means ± SEM tumor growth at day 20 are shown (experiment performed once). Statistical significance was determined with Student T test (A-B, E-K). *P<0.05, **P<0.01, ***P<0.001, ns: not significant.

Similar articles

Cited by

References

    1. Orth M, Metzger P, Gerum S, Mayerle J, Schneider G, Belka C, et al. Pancreatic ductal adenocarcinoma: Biological hallmarks, current status, and future perspectives of combined modality treatment approaches. Radiat Oncol. 2019;14:1–20. - PMC - PubMed
    1. Klein AP. Pancreatic cancer epidemiology: understanding the role of lifestyle and inherited risk factors. Nat Rev Gastroenterol Hepatol. 2021;18:493–502. - PMC - PubMed
    1. Neoptolemos JP, Kleeff J, Michl P, Costello E, Greenhalf W, Palmer DH. Therapeutic developments in pancreatic cancer: Current and future perspectives. Nat Rev Gastroenterol Hepatol. 2018;15:333–348. - PubMed
    1. Conroy T, Desseigne F, Ychou M, Bouché O, Guimbaud R, Bécouarn Y, et al. FOLFIRINOX versus gemcitabine for metastatic pancreatic cancer. N Engl J Med. 2011;364:1817–25. - PubMed
    1. Von Hoff DD, Ervin T, Arena FP, Chiorean EG, Infante J, Moore M, et al. Increased survival in pancreatic cancer with nab-paclitaxel plus gemcitabine. N Engl J Med. 2013;369:1691–703. - PMC - PubMed

Publication types