. 2022 Nov-Dec:90-91:101909.
doi: 10.1016/j.cimid.2022.101909. Epub 2022 Nov 7.

Host gene expression is associated with viral shedding magnitude in blue-winged teals (Spatula discors) infected with low-path avian influenza virus

Affiliations

Host gene expression is associated with viral shedding magnitude in blue-winged teals (Spatula discors) infected with low-path avian influenza virus

Amanda C Dolinski et al. Comp Immunol Microbiol Infect Dis. 2022 Nov-Dec.

Abstract

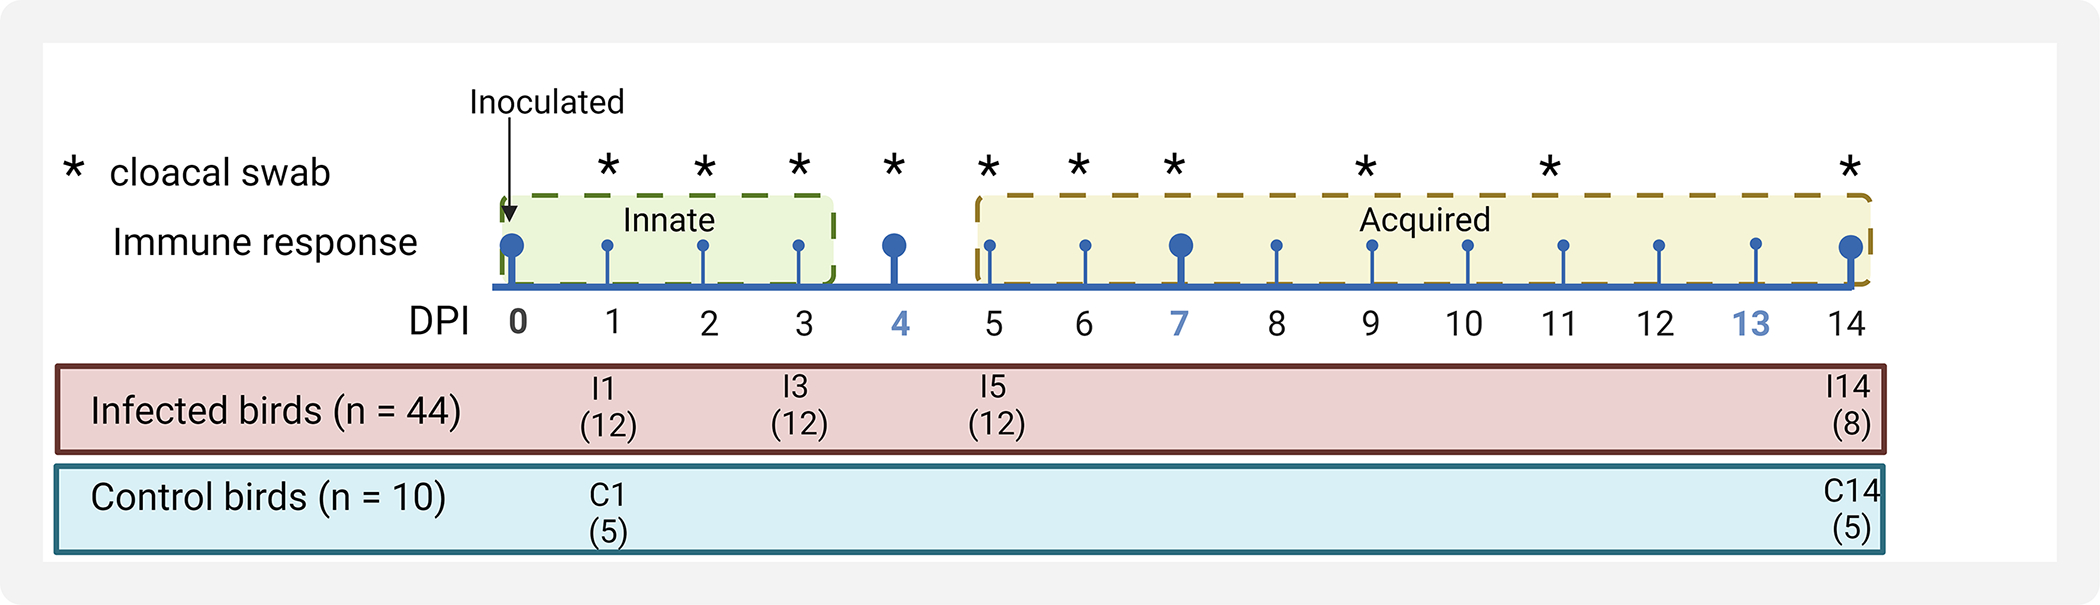
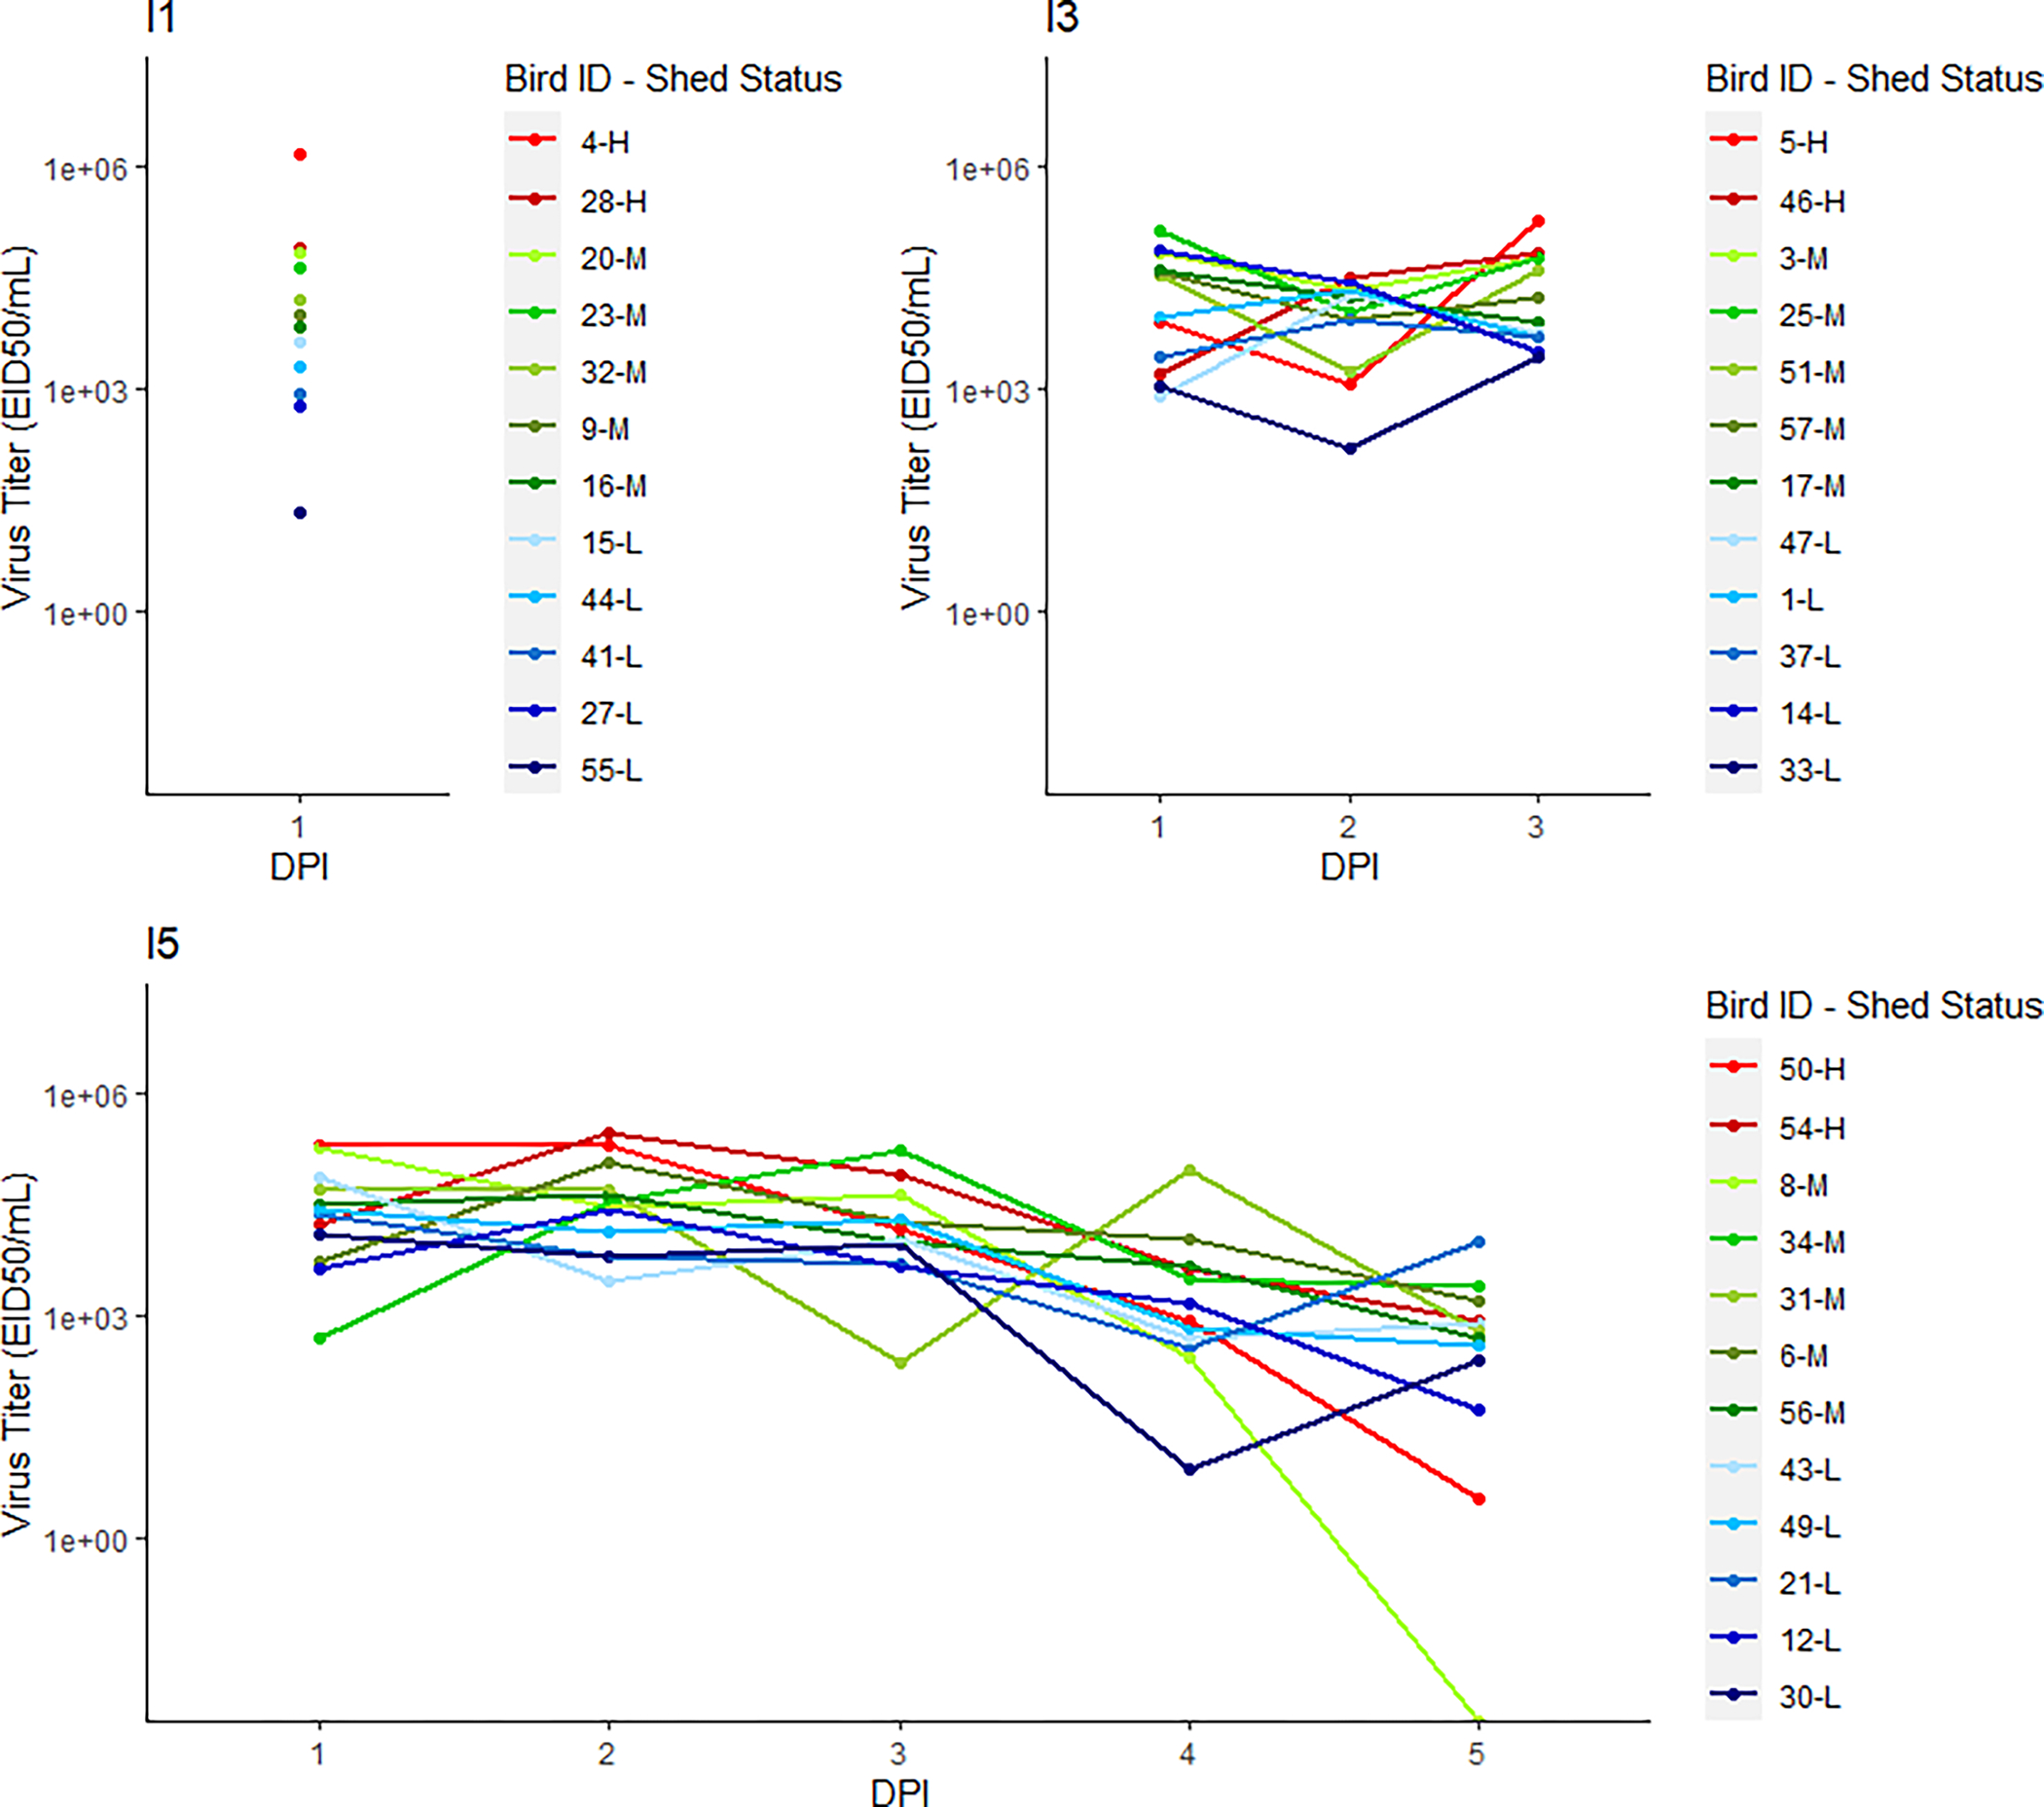
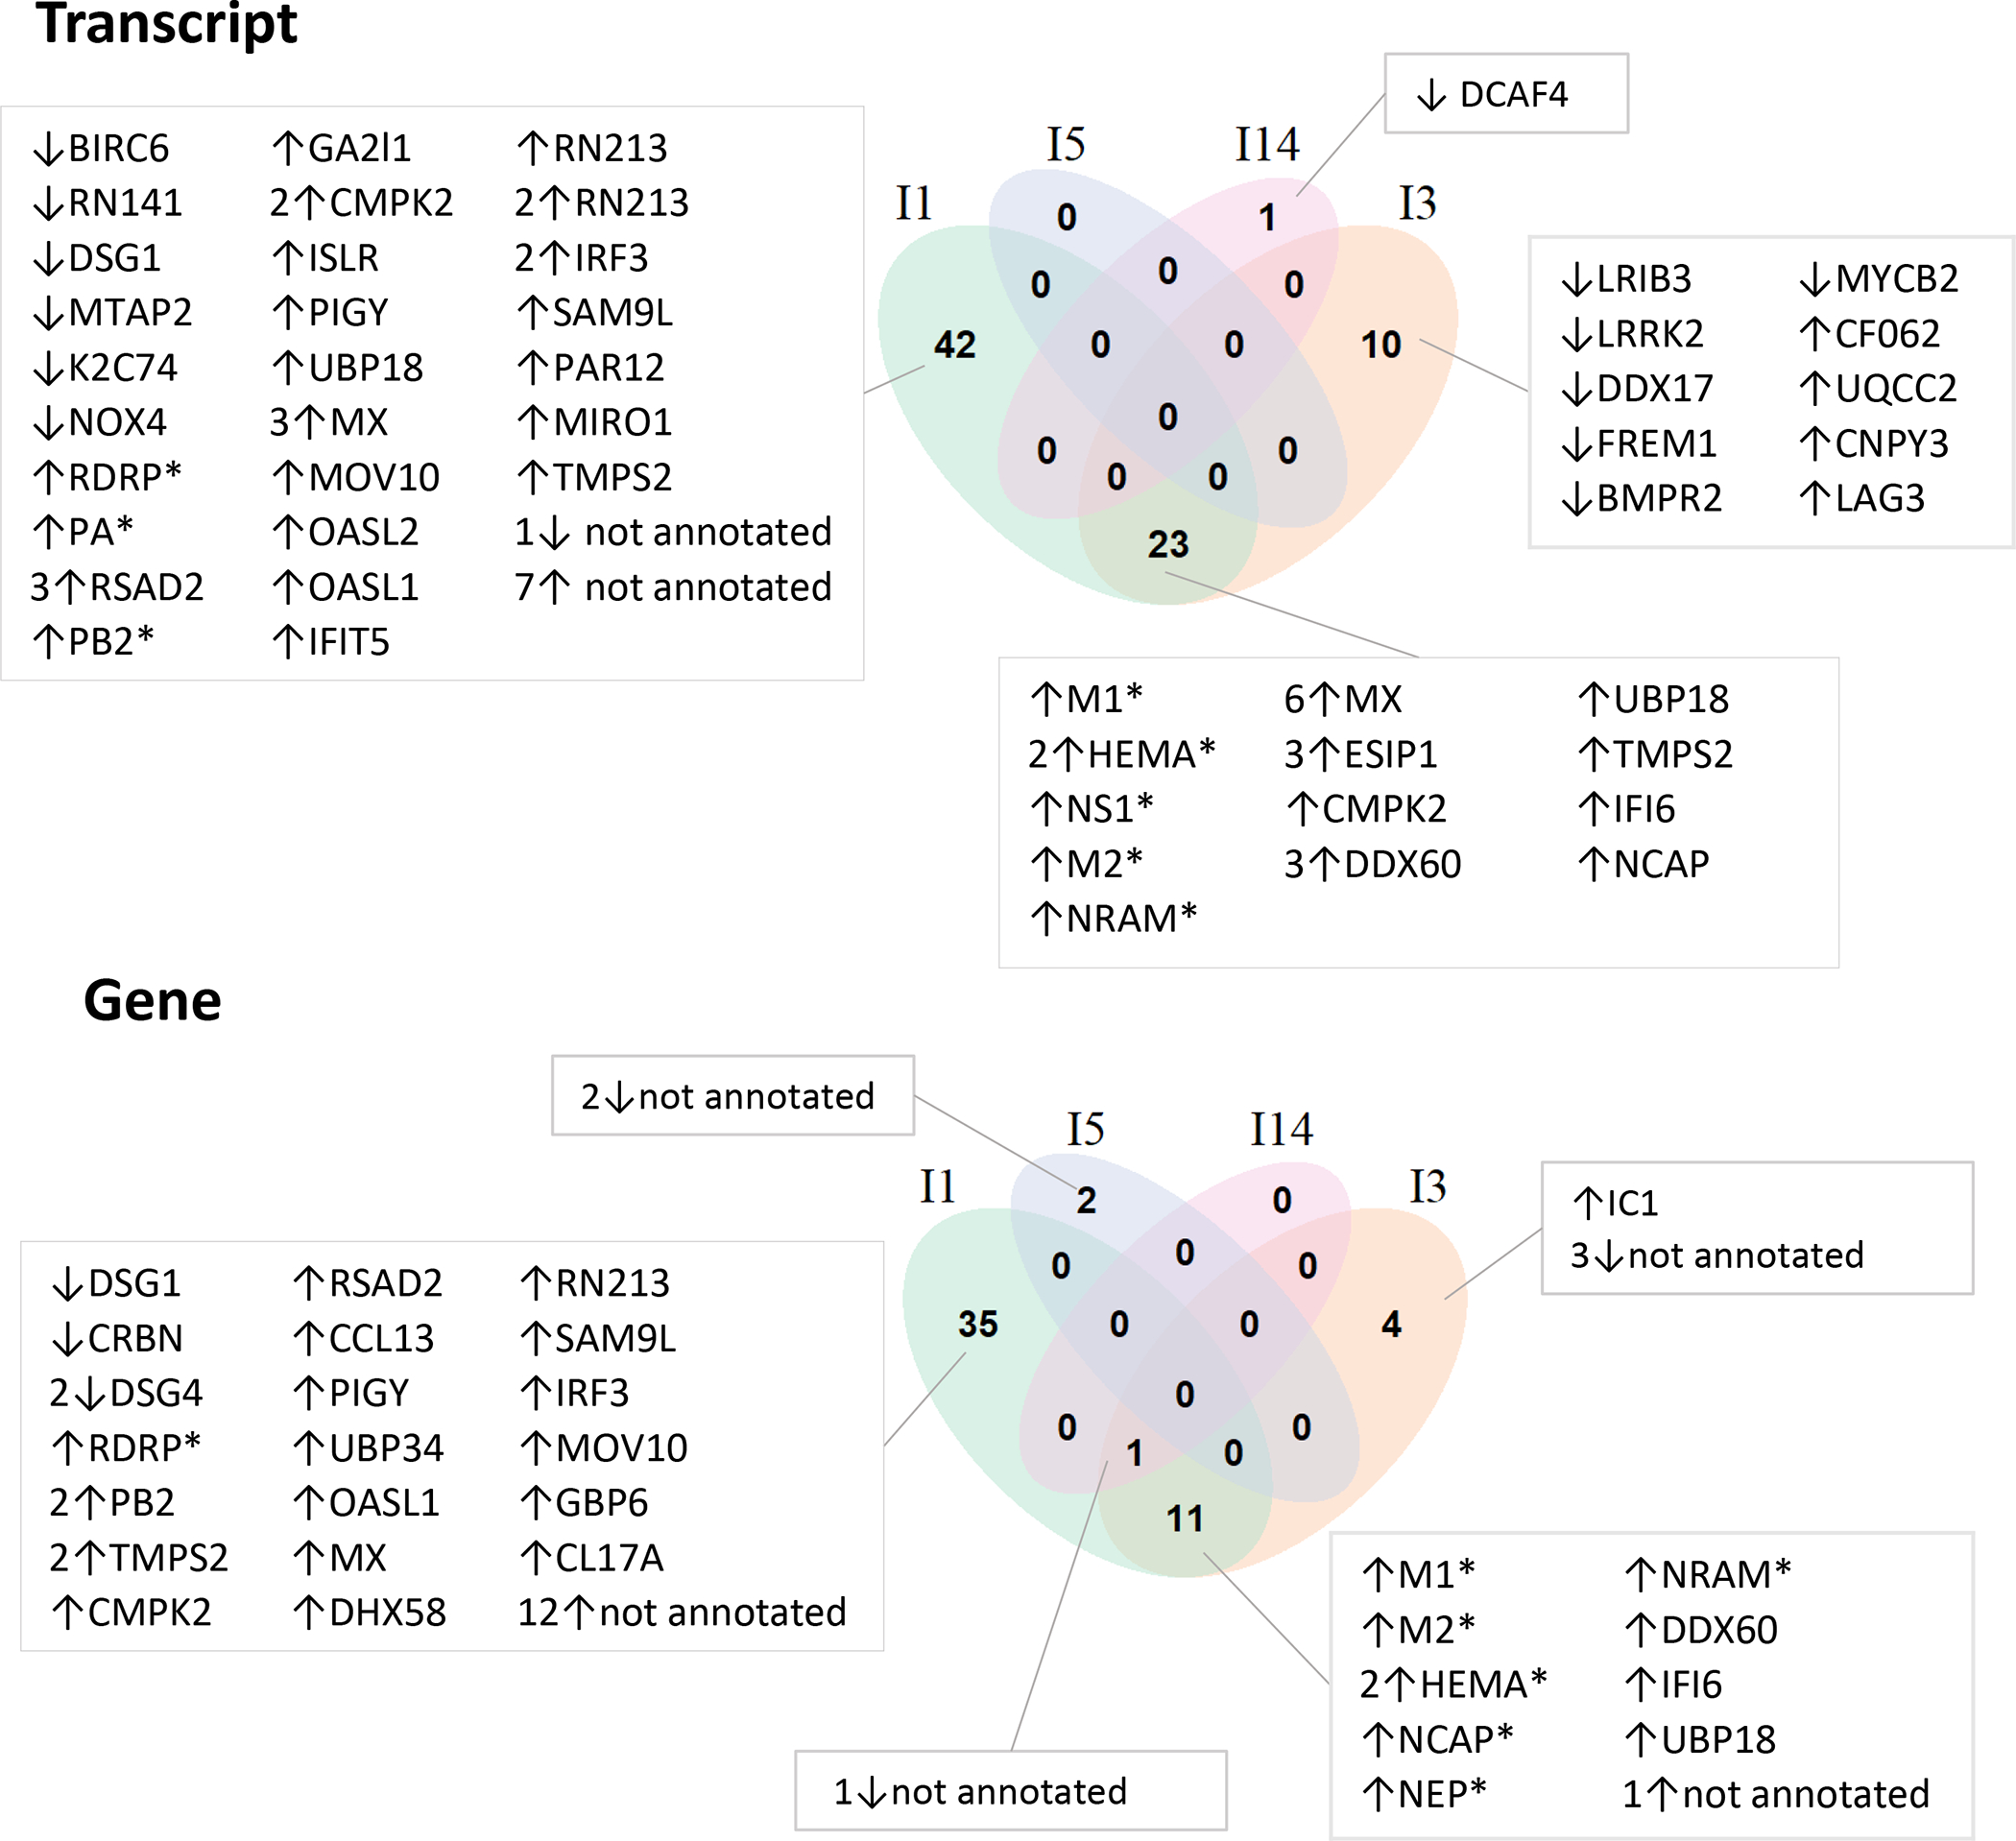
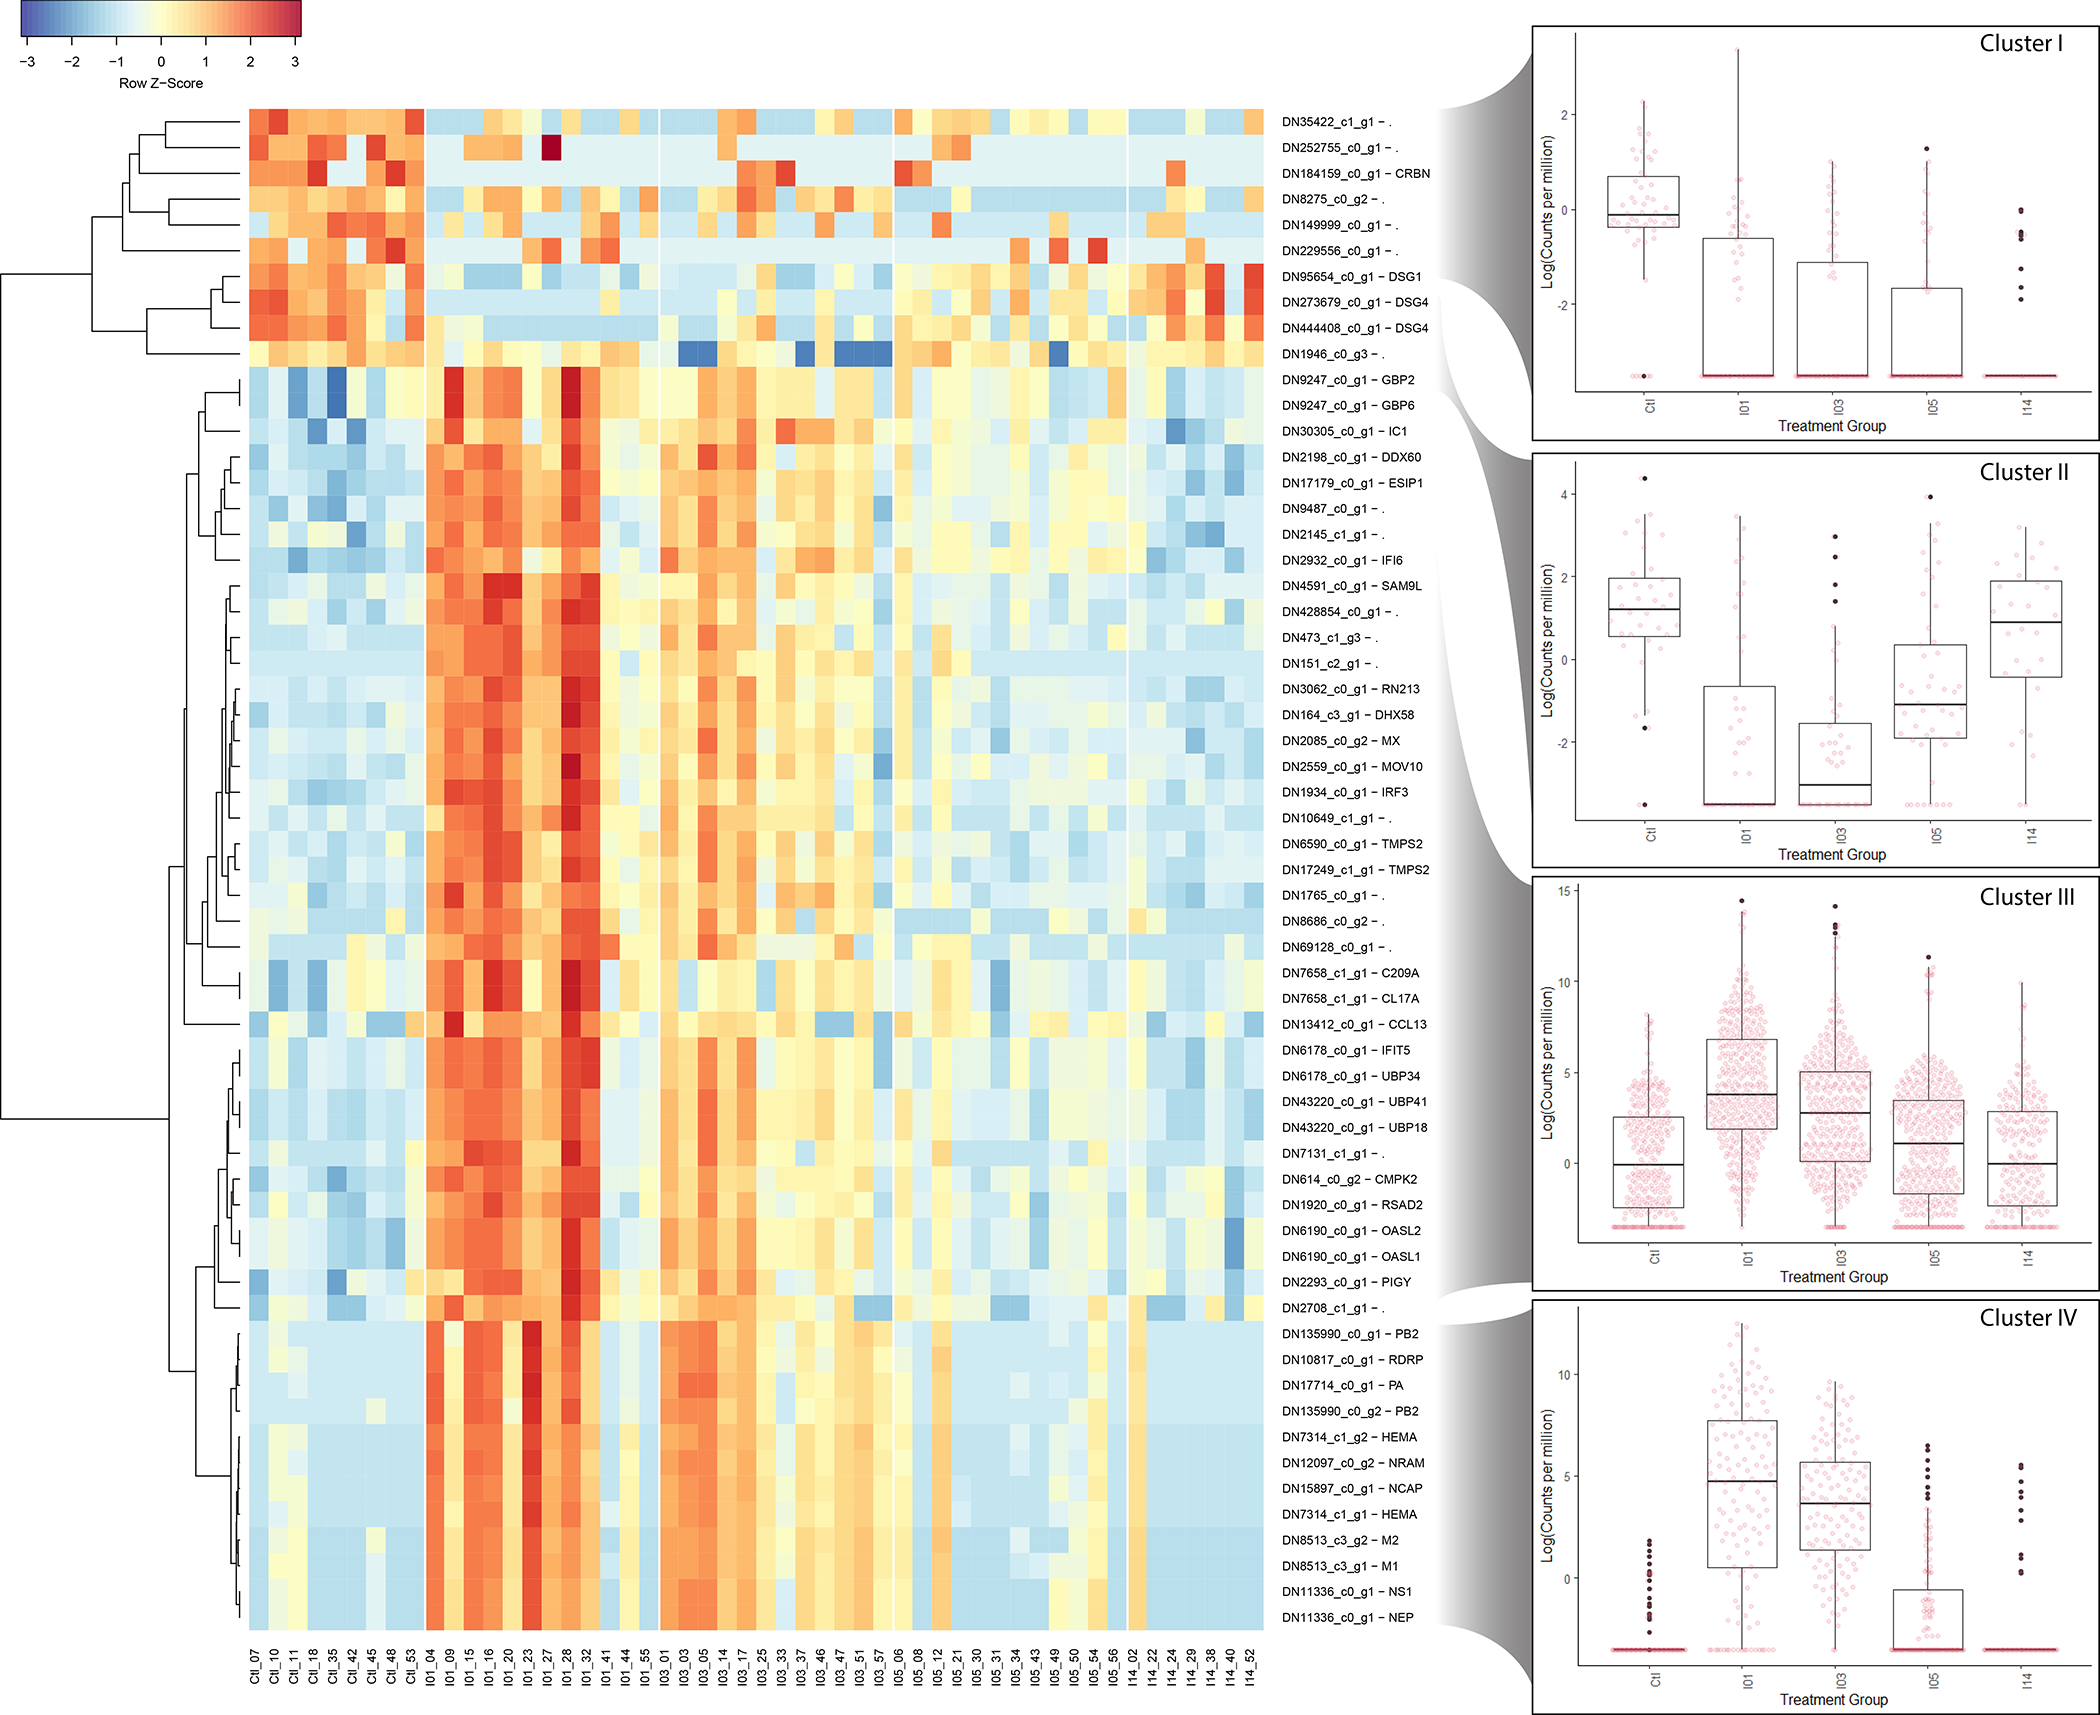
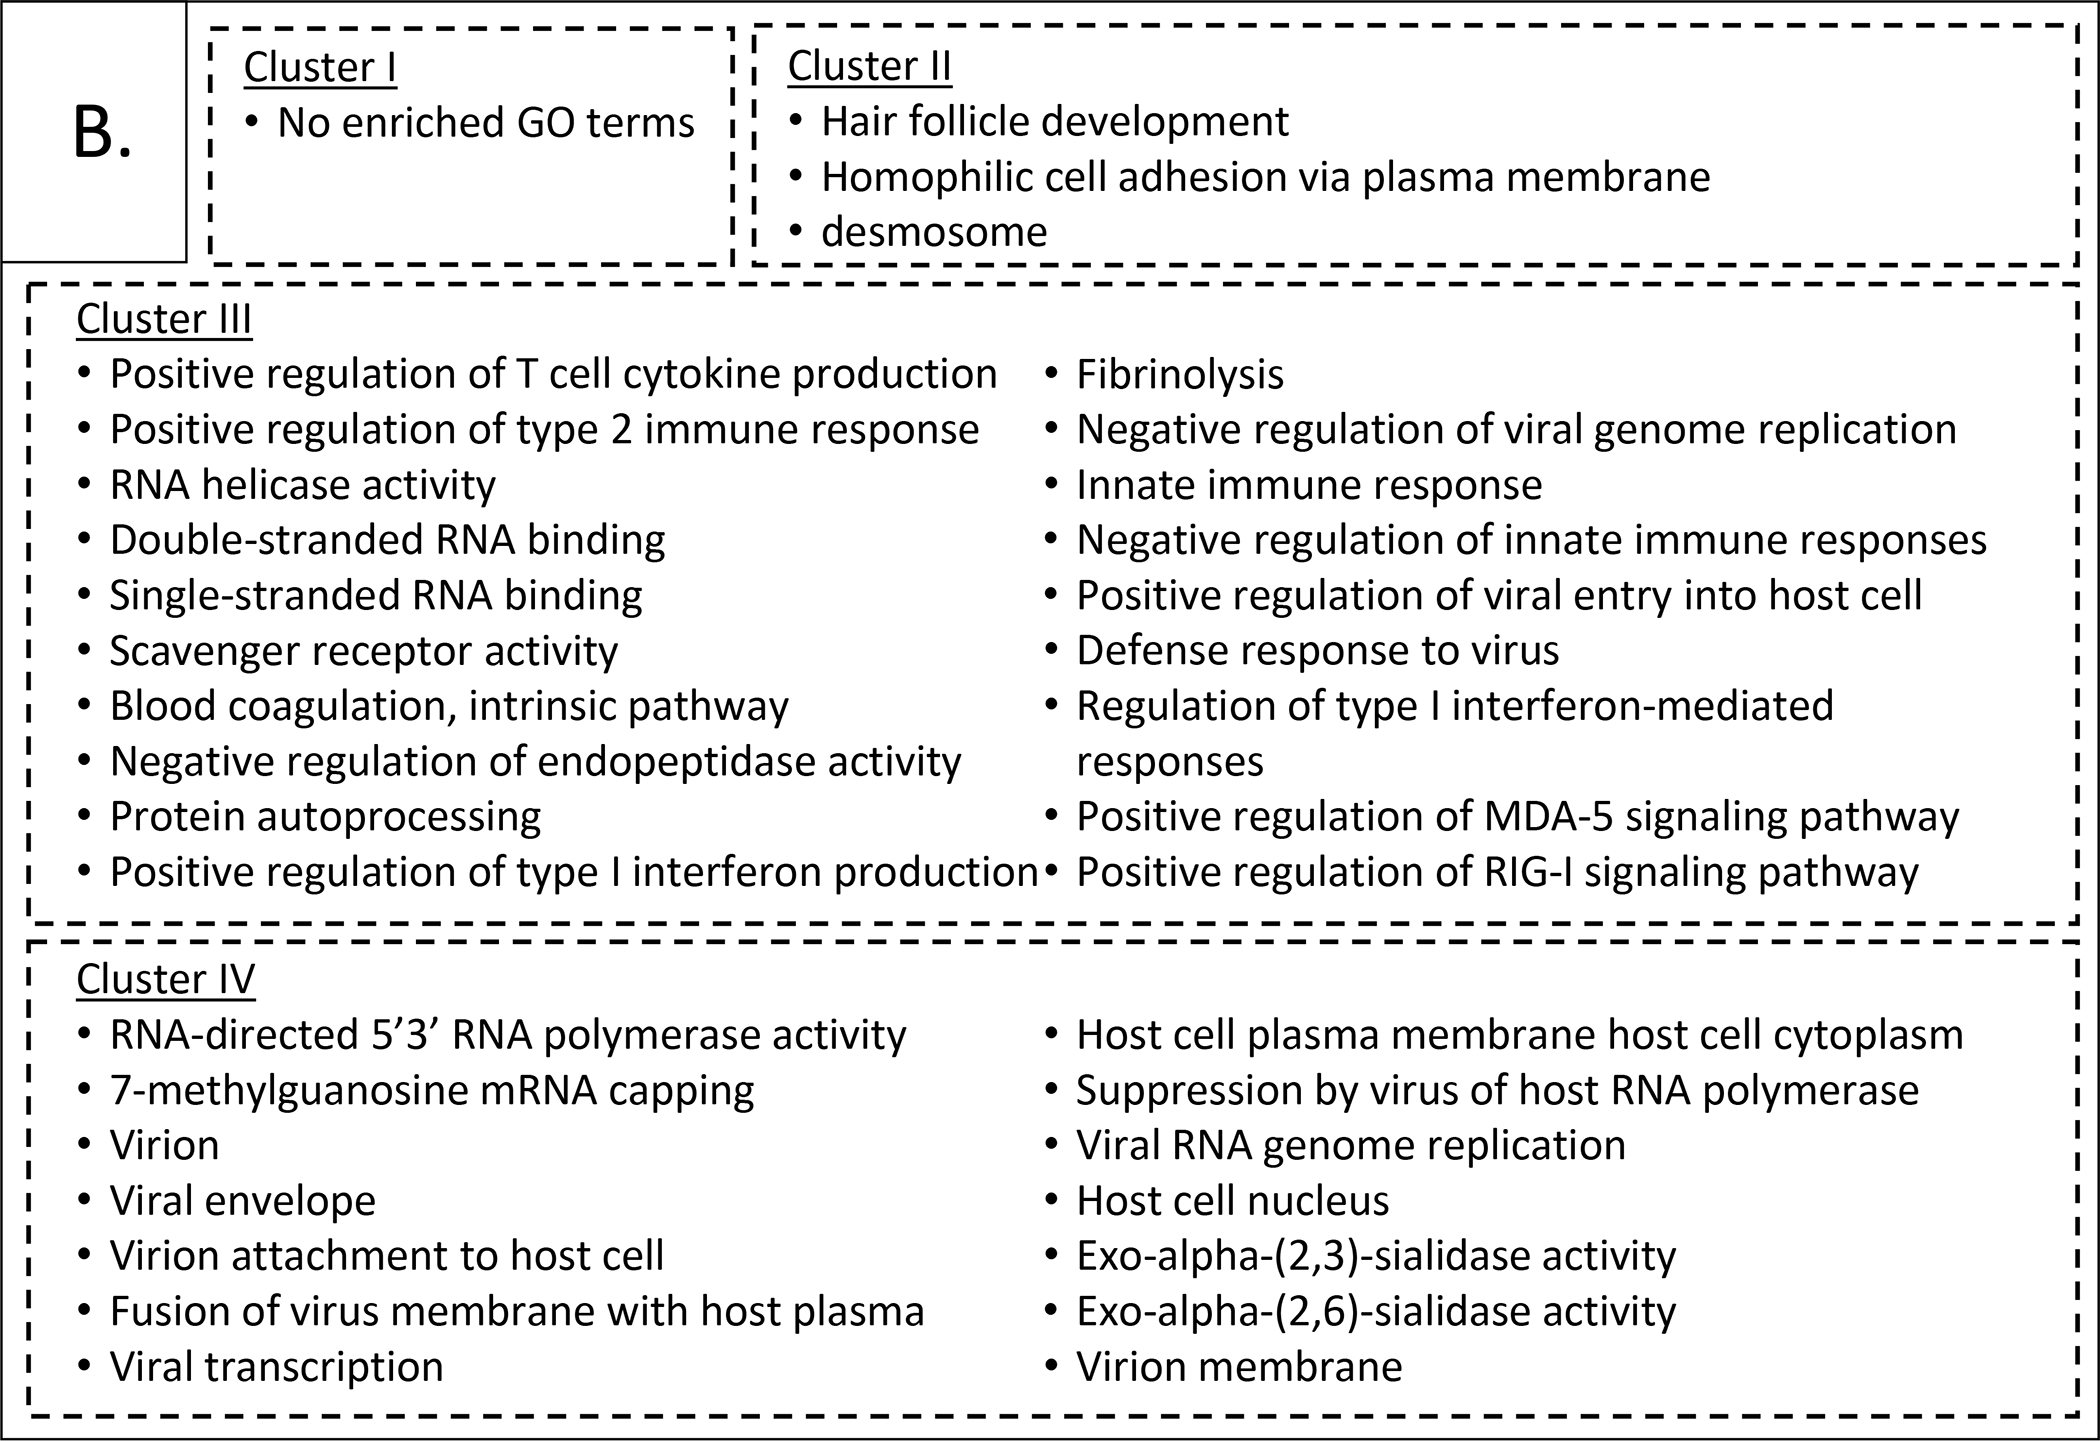
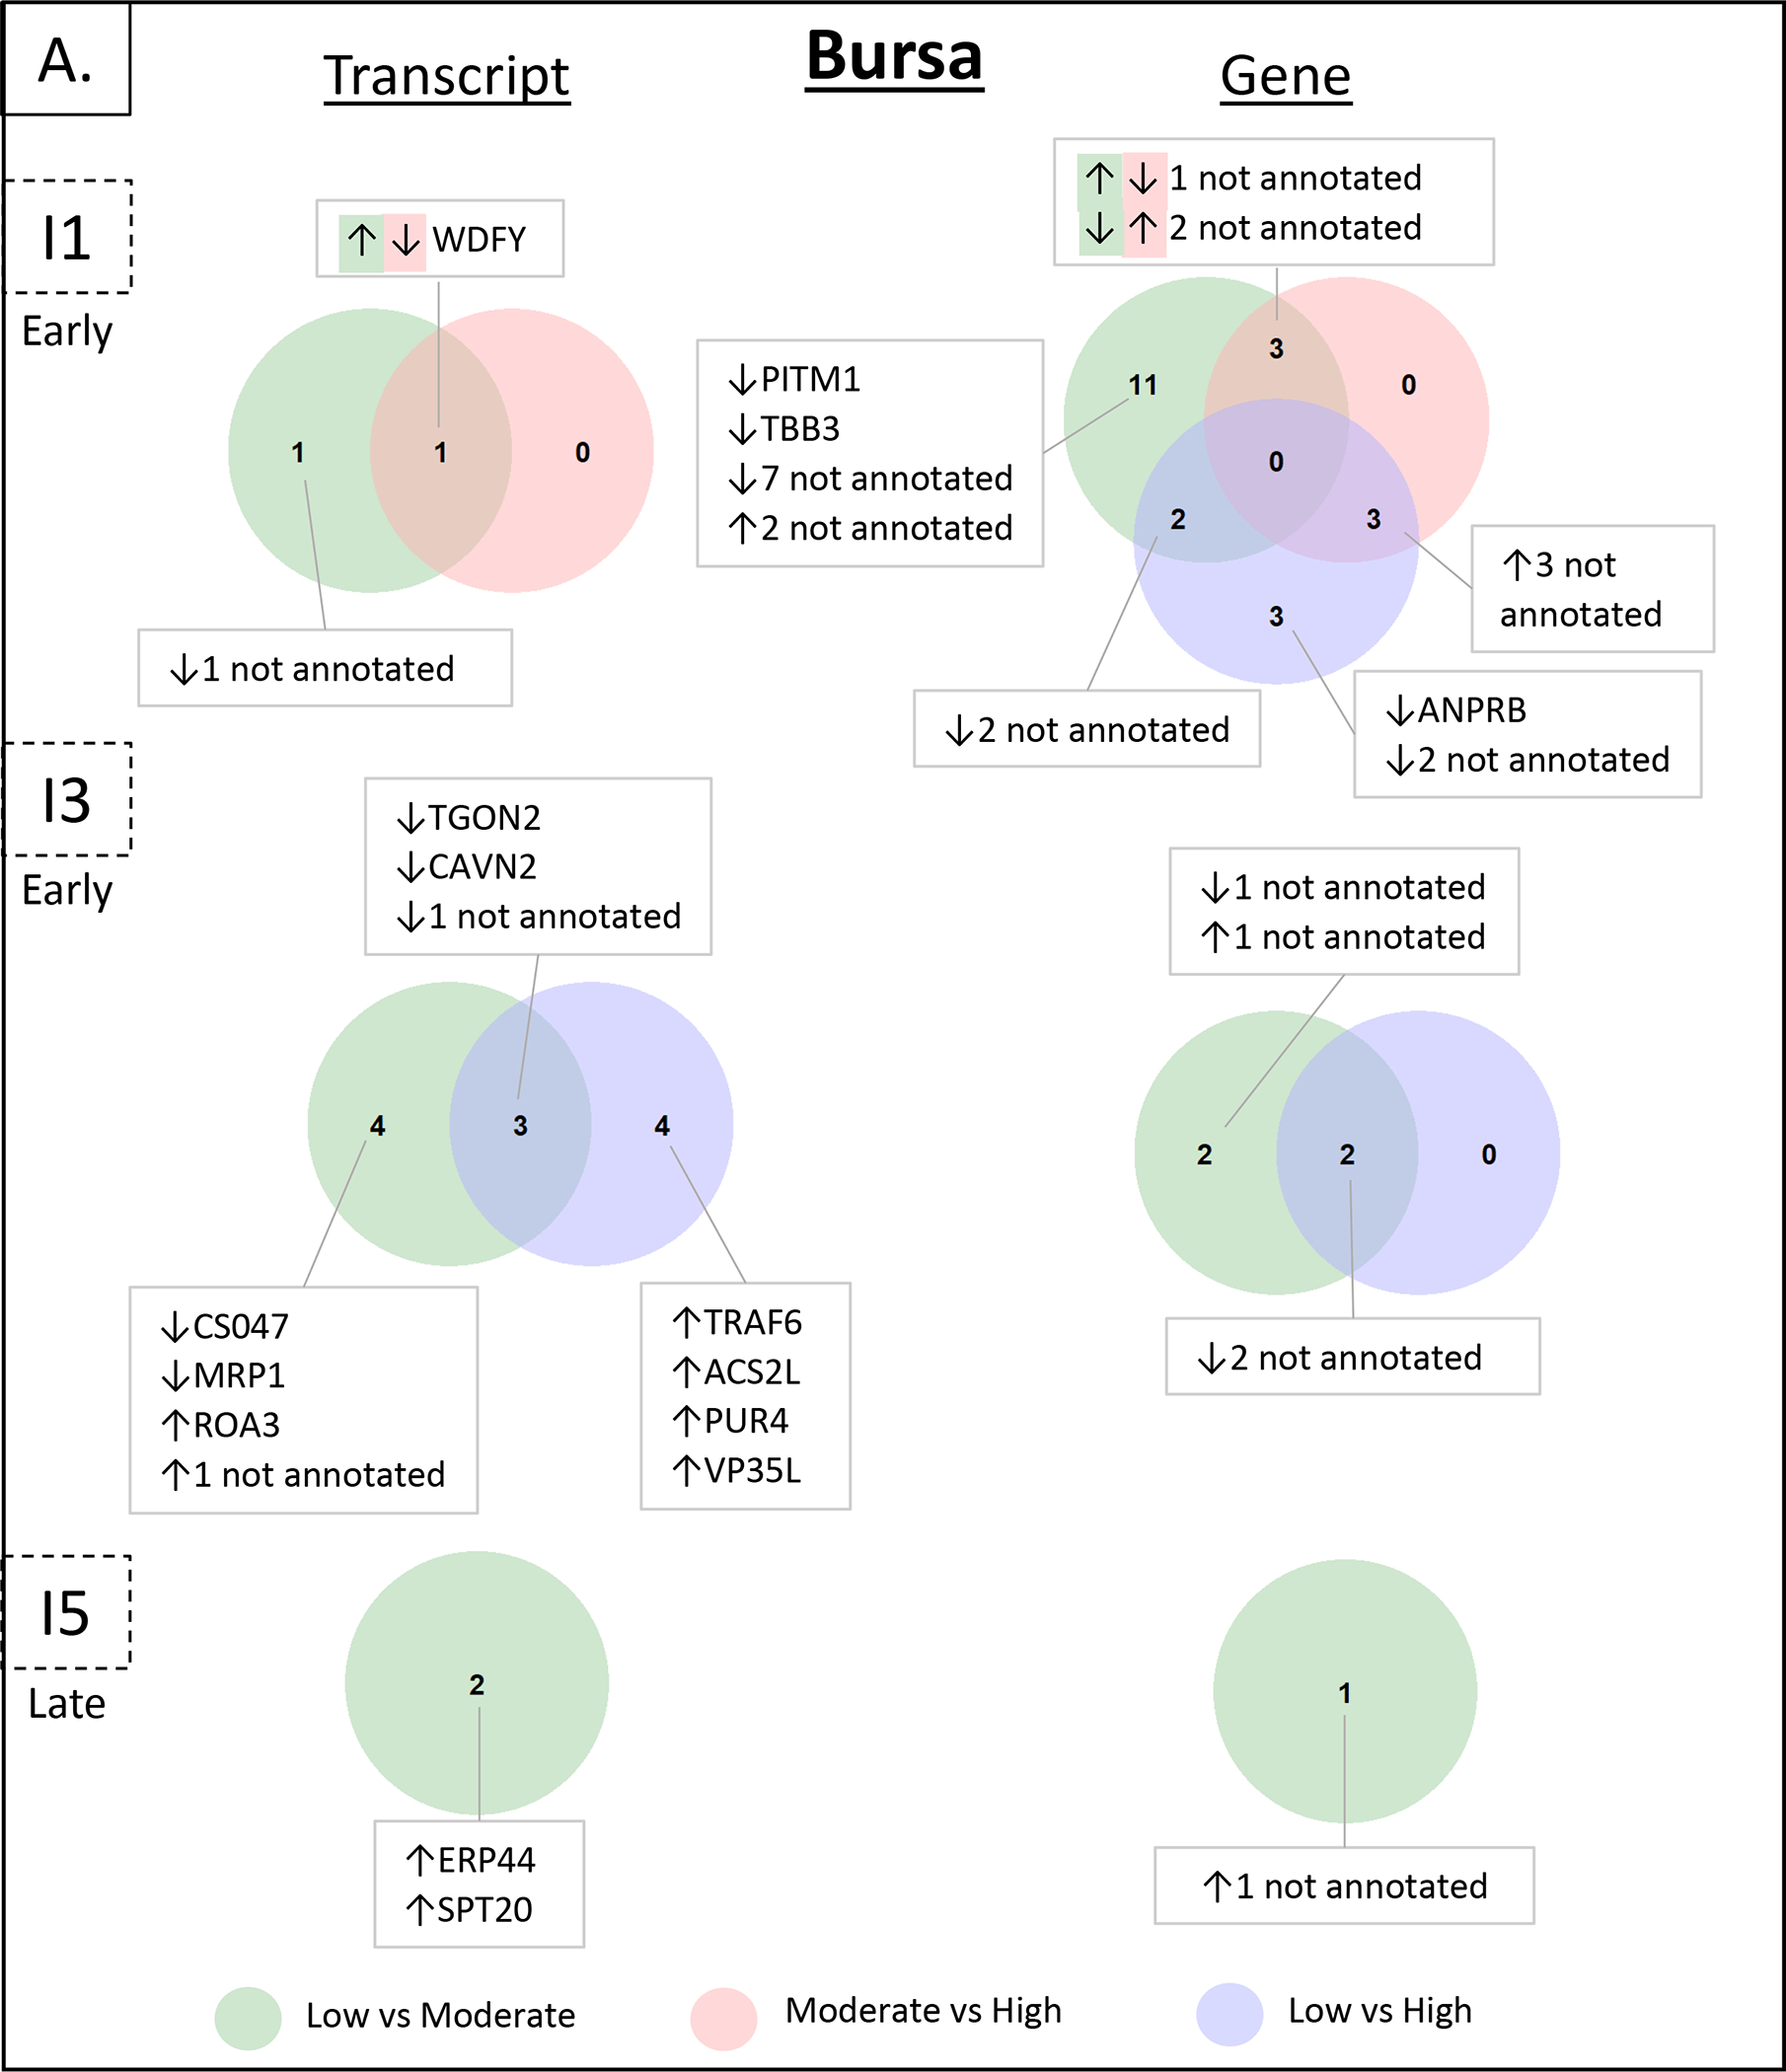
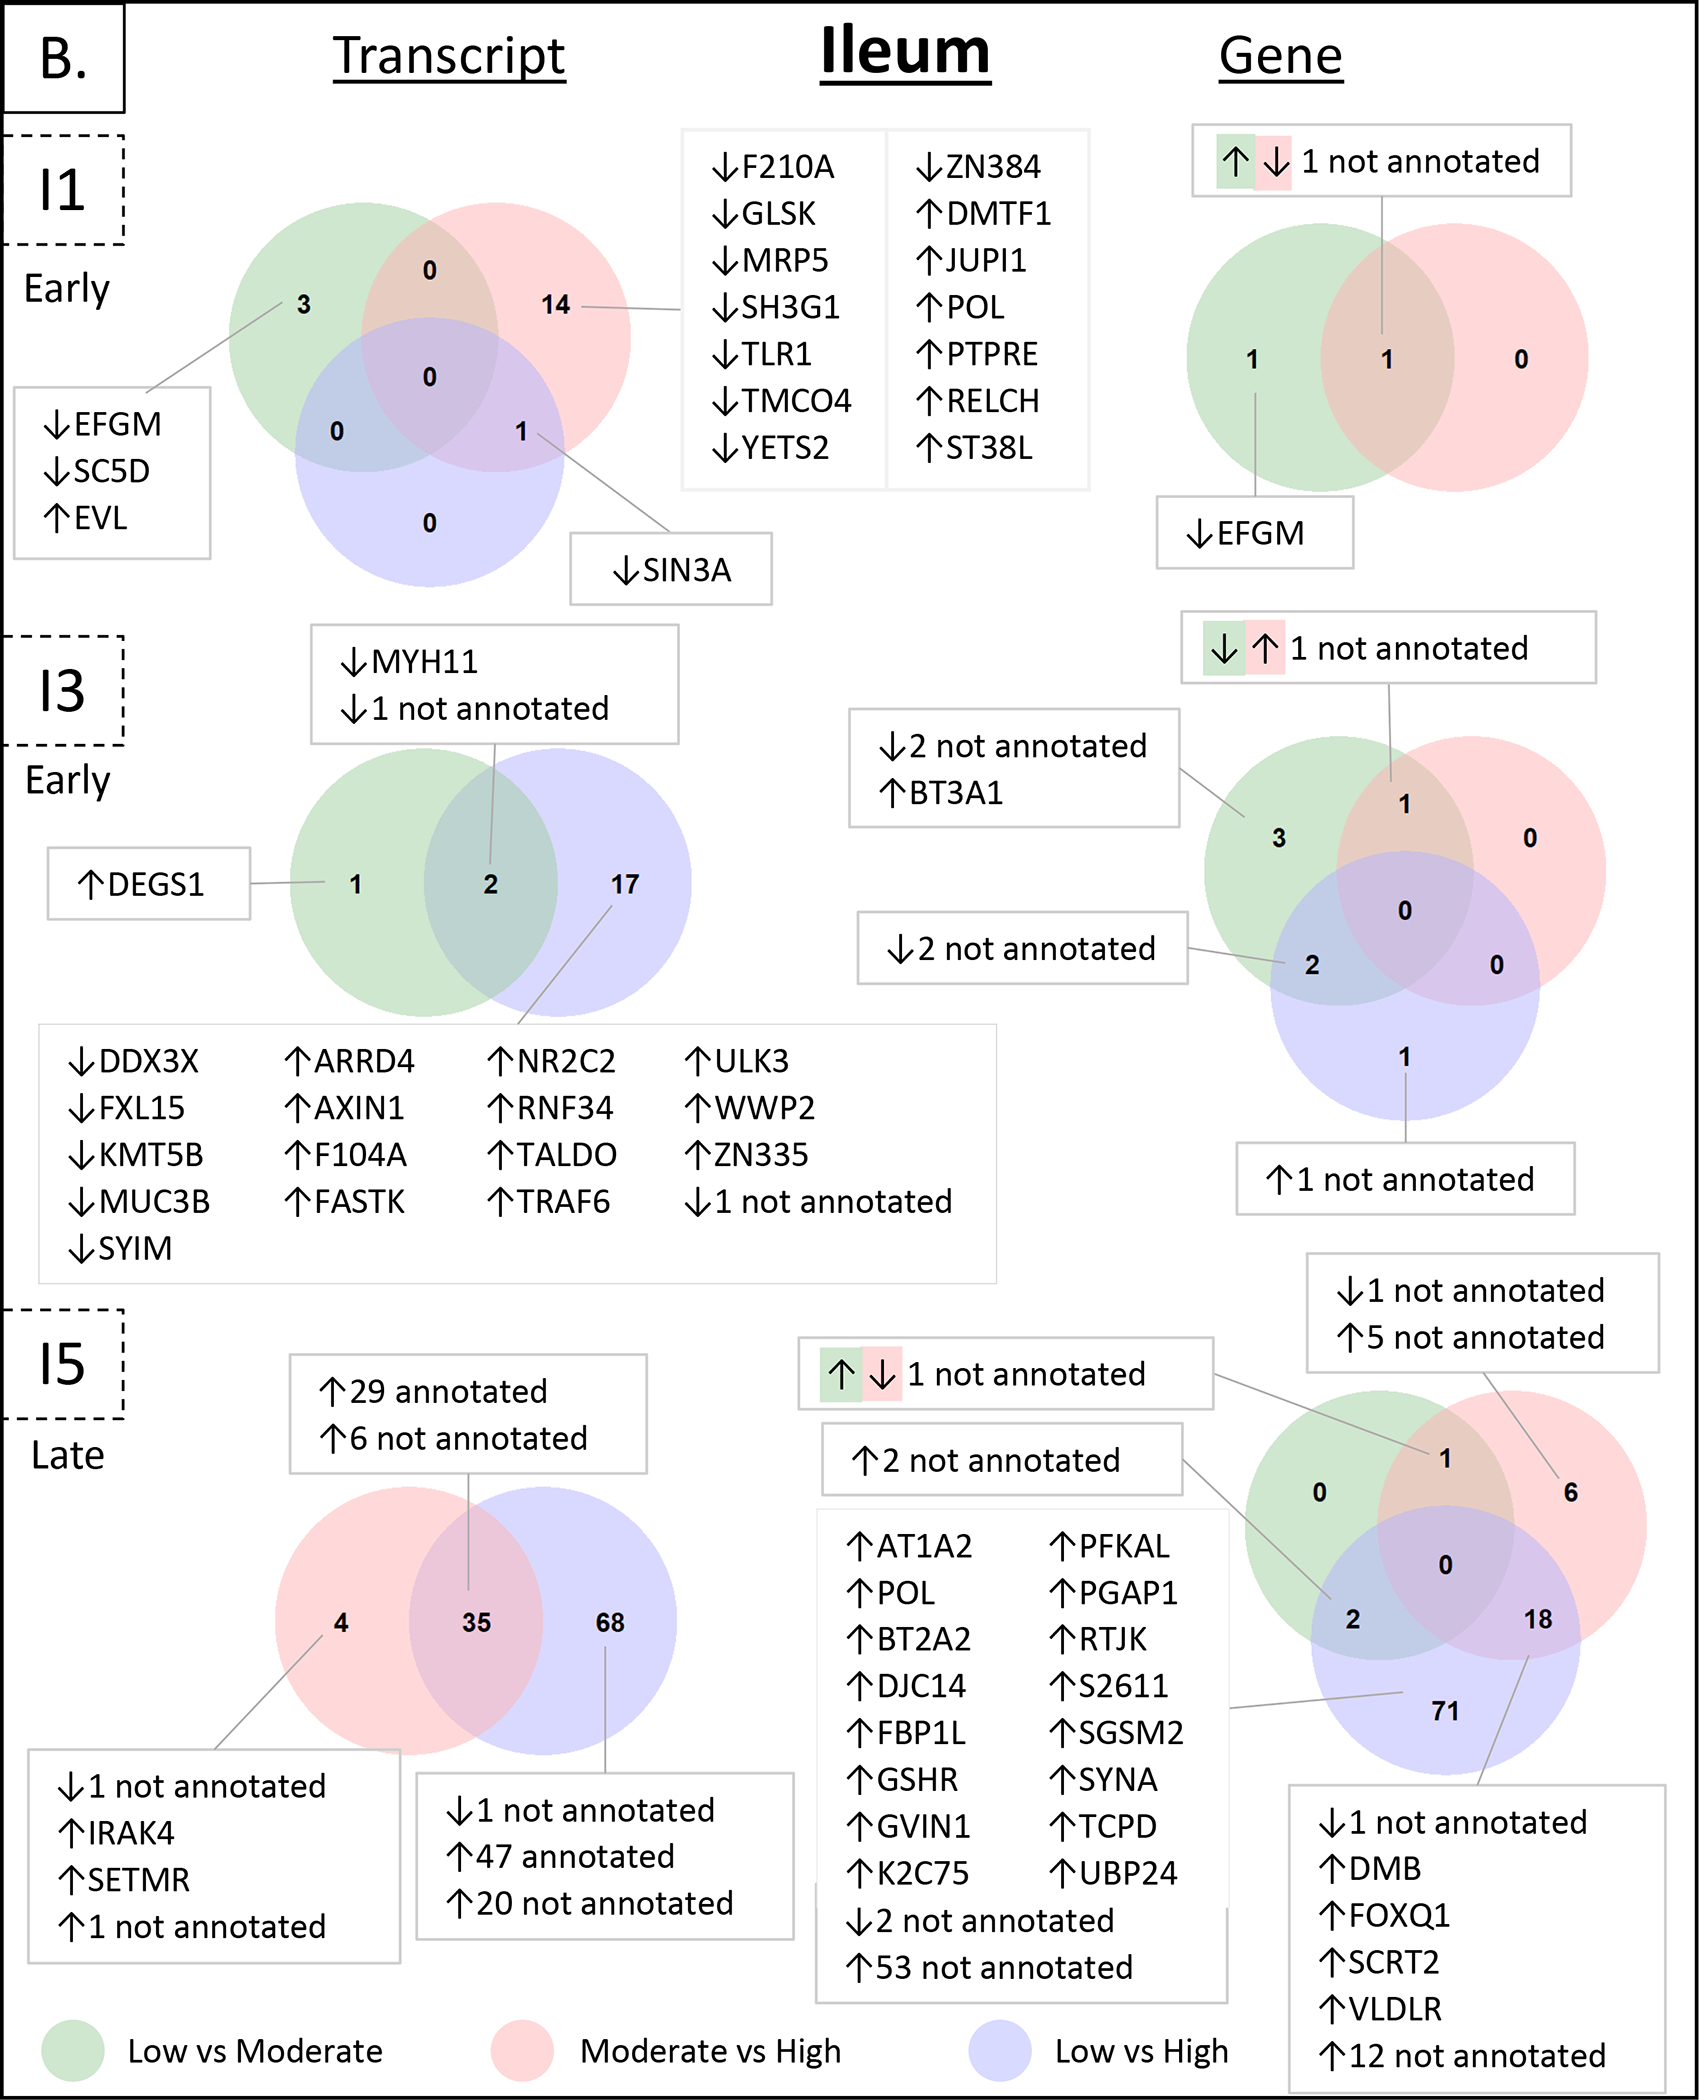
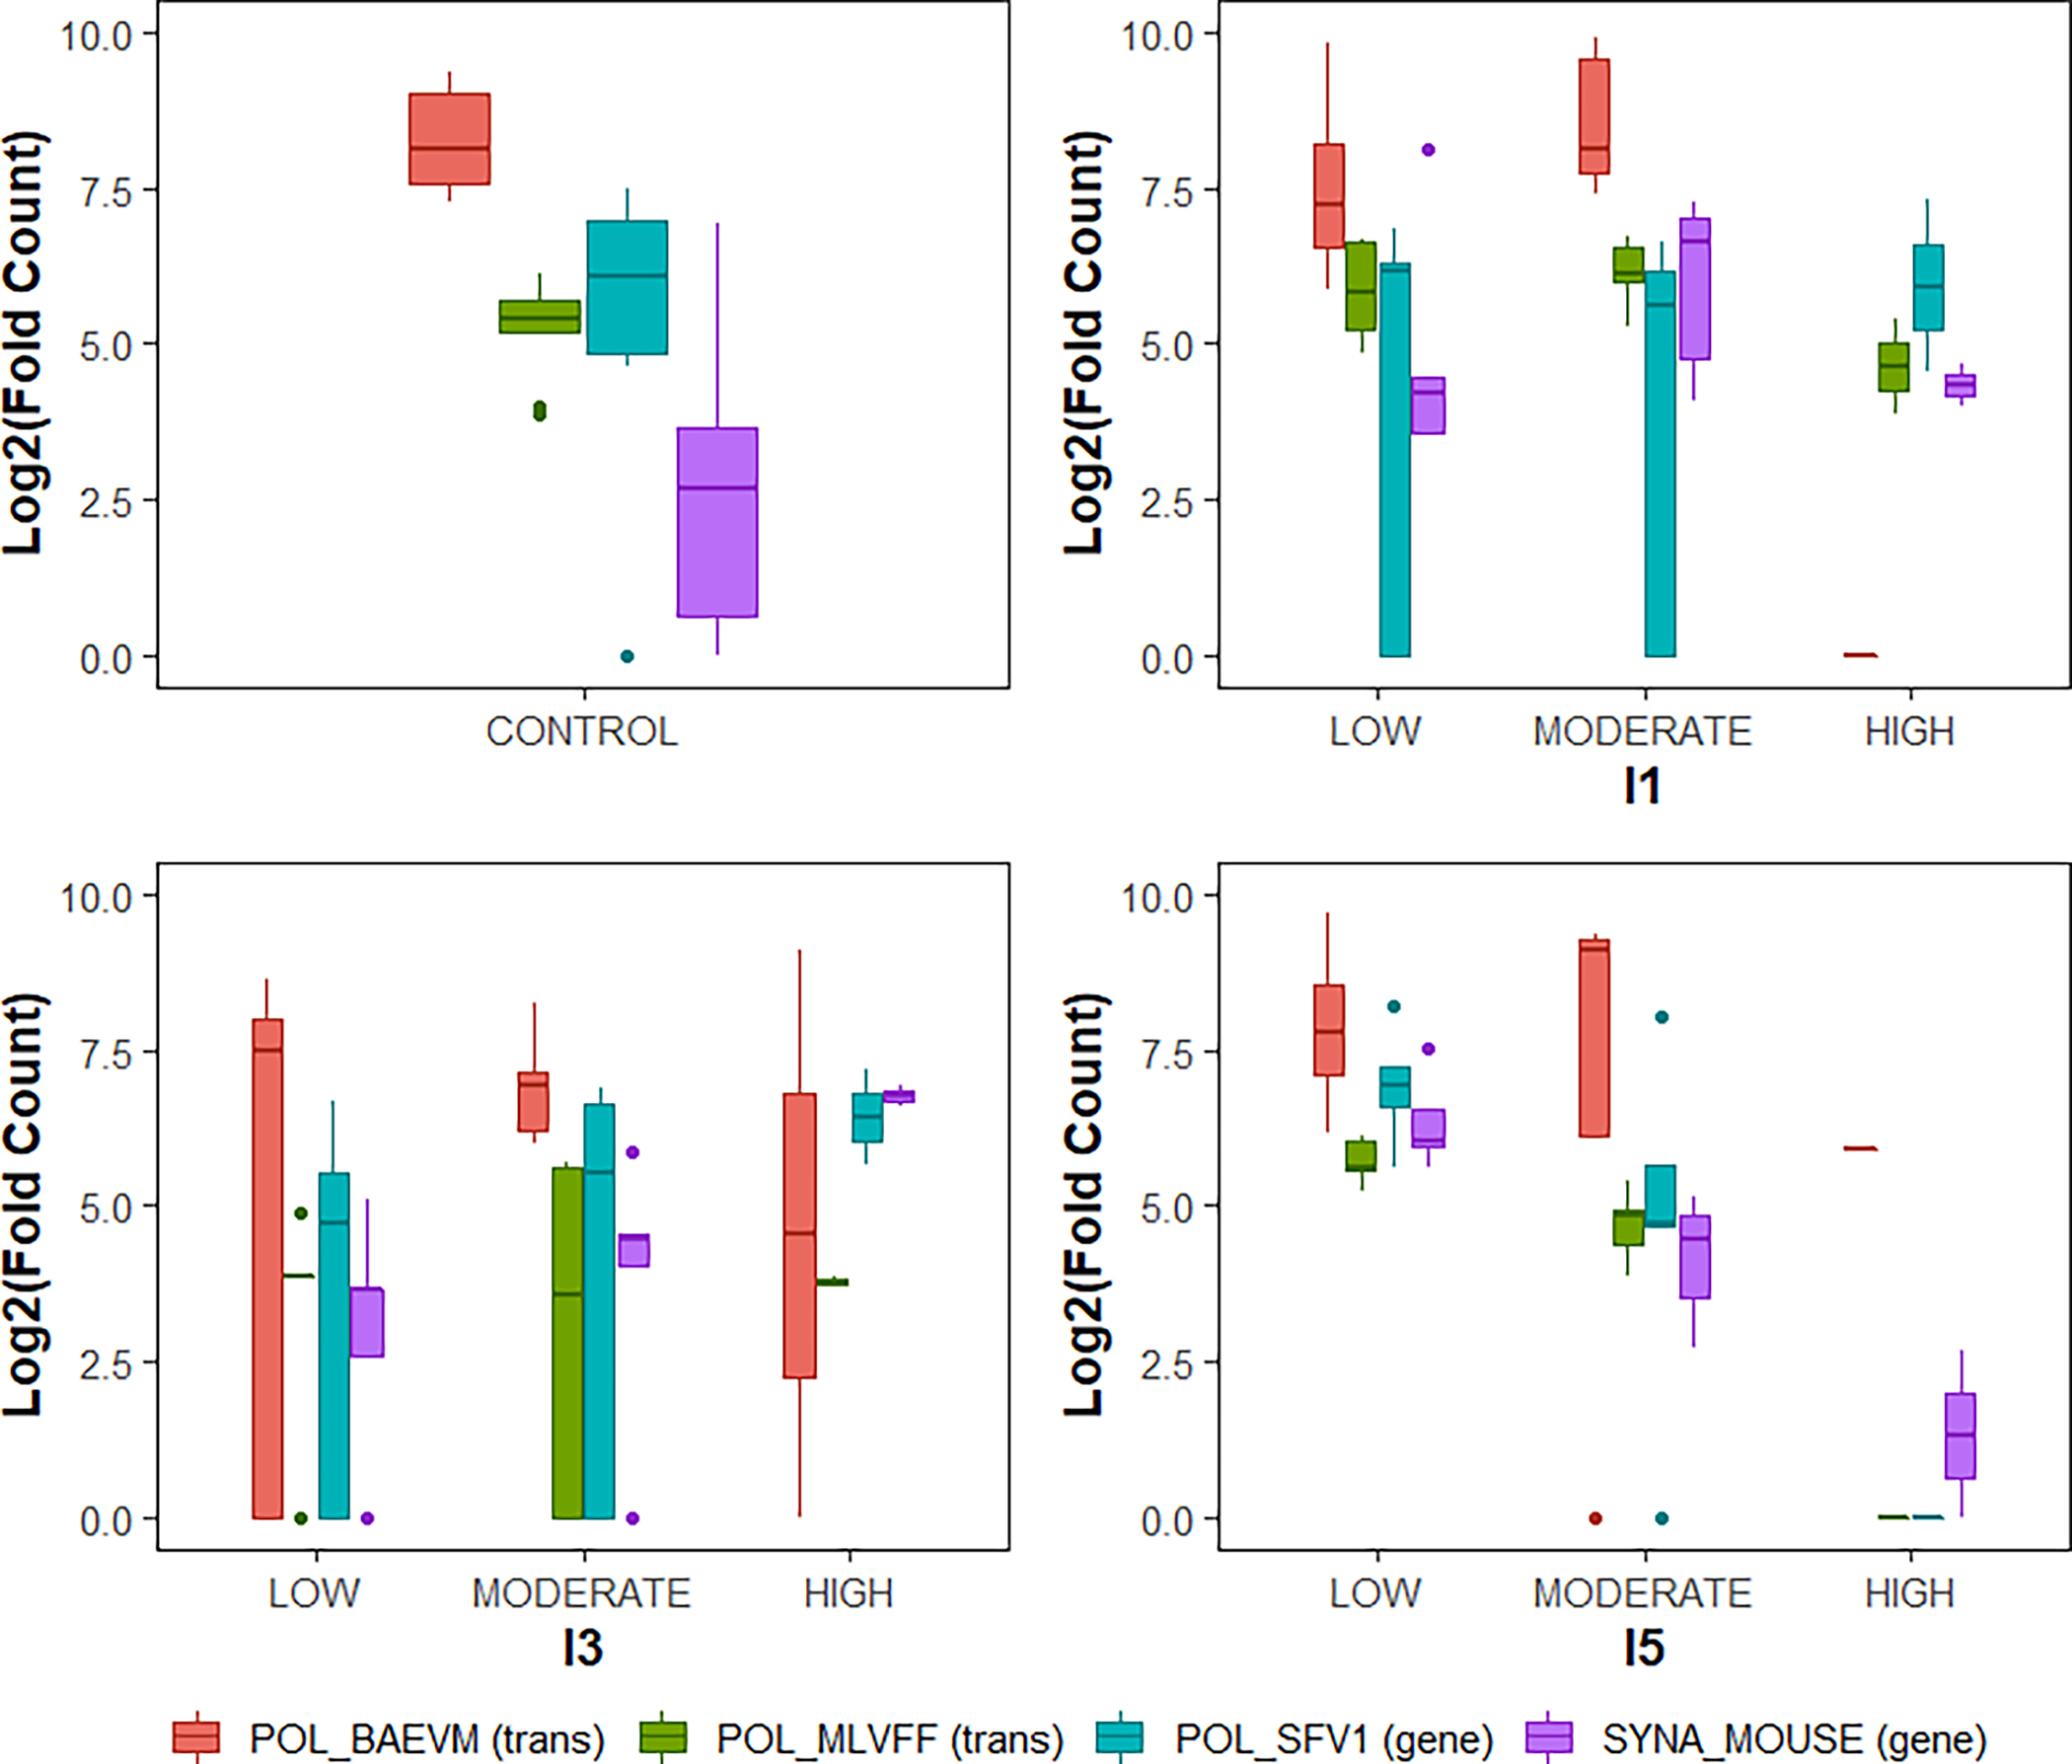
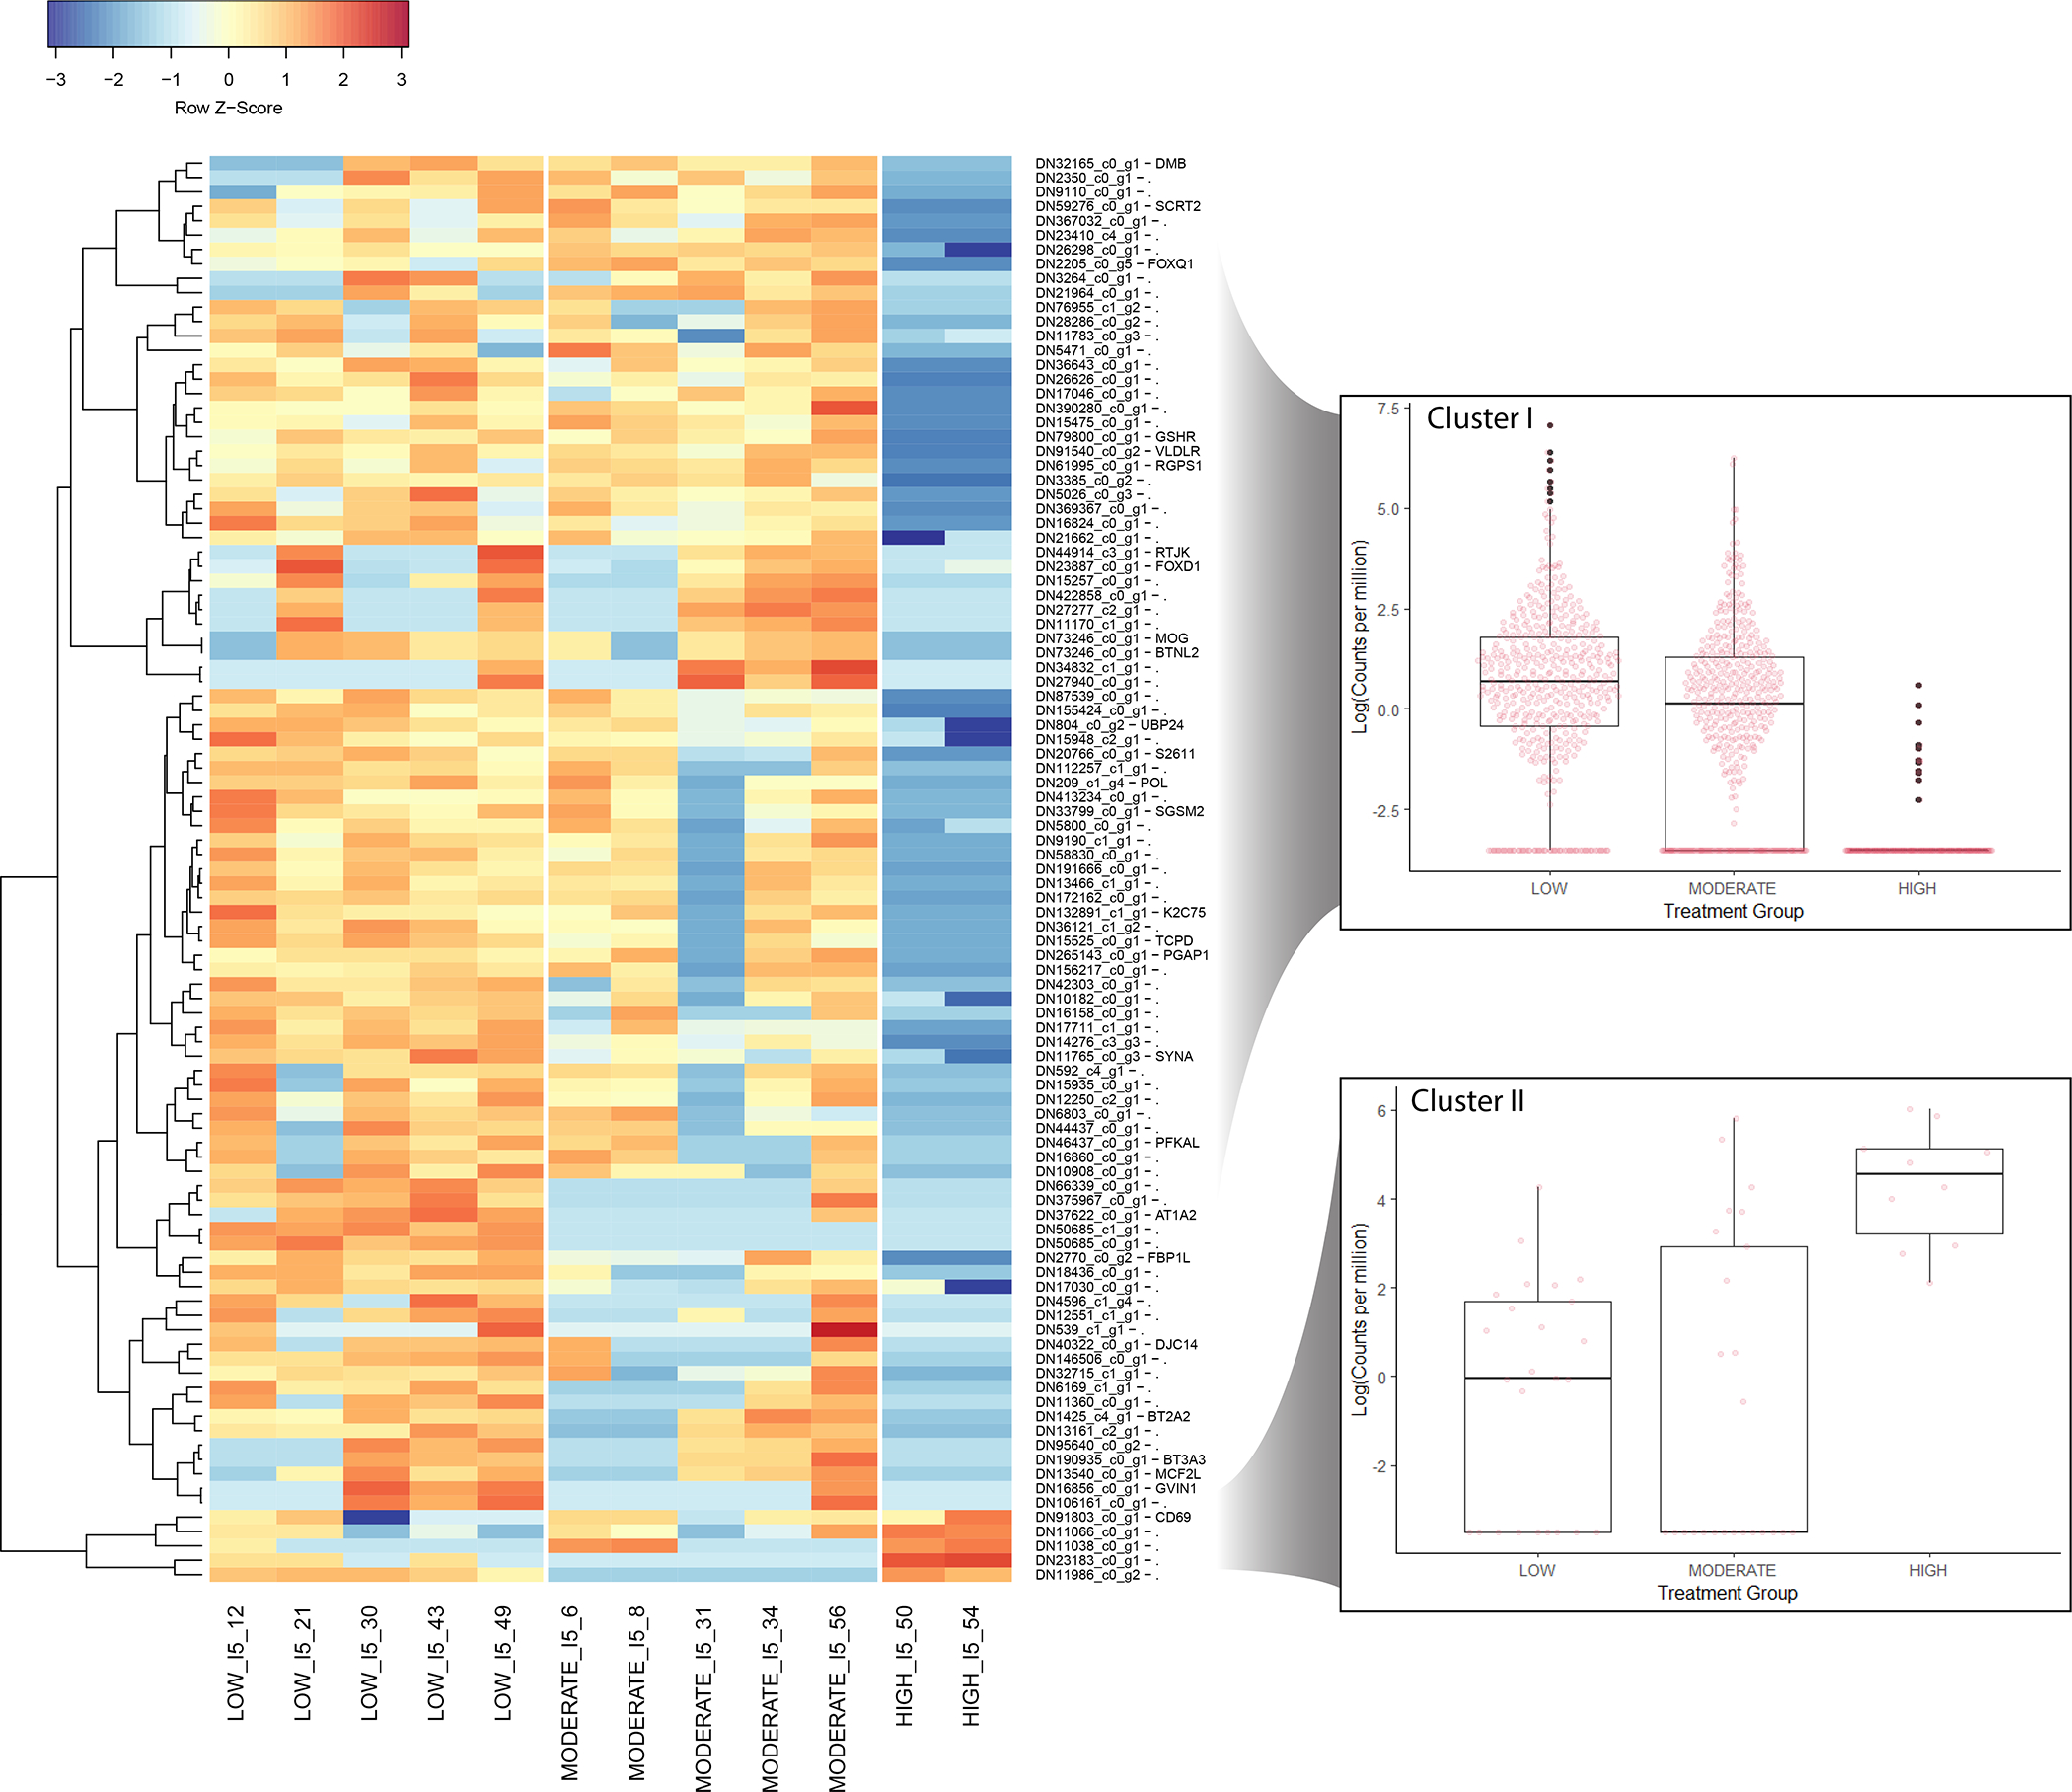
Intraspecific variation in host infectiousness affects disease transmission dynamics in human, domestic animal, and many wildlife host-pathogen systems including avian influenza virus (AIV); therefore, identifying host factors related to host infectiousness is important for understanding, controlling, and preventing future outbreaks. Toward this goal, we used RNA-seq data collected from low pathogenicity avian influenza virus (LPAIV)-infected blue-winged teal (Spatula discors) to determine the association between host gene expression and intraspecific variation in cloacal viral shedding magnitude, the transmissible fraction of virus. We found that host genes were differentially expressed between LPAIV-infected and uninfected birds early in the infection, host genes were differentially expressed between shed level groups at one-, three-, and five-days post-infection, host gene expression was associated with LPAIV infection patterns over time, and genes of the innate immune system had a positive linear relationship with cloacal viral shedding. This study provides important insights into host gene expression patterns associated with intraspecific LPAIV shedding variation and can serve as a foundation for future studies focused on the identification of host factors that drive or permit the emergence of high viral shedding individuals.

Keywords: Avian influenza; Blue-winged teal; Gene expression; RNA-seq; Supershedders; Viral shedding.


Conflict of interest statement

Declaration of Competing Interest The authors declare that they have no known competing financial interests or personal relationships that could have appeared to influence the work reported in this paper. This research does not reflect the official positions and policies of the US EPA. Mention of products/trade names does not constitute recommendation for use by US EPA.

Figures

Figure 1:
Figure 1:. Experimental design and timeline.
Experimental timeline starting when the blue-winged teal eggs were collected from nests in North Dakota in June 2016. Birds hatched over a period of 22 days, with age (weeks) of oldest birds matching the week number on timeline. After birds were inoculated with virus on 5 September 2016, the timeline (weeks 13 and 14) are shown in days-post infection (dpi). Birds were sacrificed and the ileum and bursa collected according to group designation denoted by infection status (I = LPAIV-infected, C = uninfected control) and dpi sacrificed, with number (n) of birds in each sample group in parentheses. Cloacal swabs were collected from all living birds designated with the asterisk.
Figure 2:
Figure 2:. Cloacal swab virus titer profiles for LPAIV-infected blue-winged teal
Virus profile for infected-teal sacrificed on one (I1), three (I3), and five (I5) days post infection (DPI). Shed level of high (H), moderate (M), or low (L) was assigned to individuals by their last virus titer (I1, I3) or the average virus titer across all DPI (I5).
Figure 3:
Figure 3:. Differentially expressed transcripts/genes between LPAIV-infected and uninfected control teal in the ileum.
LPAIV-infected birds were sacrificed on one (I1), three (I3), five (I5), and 14 (I14) days post infection (DPI). Each number represents the quantity of DET/DEGs per comparison, and/or shared between comparisons. DEGs/DETs up-regulated (↑) or down-regulated (↓) in each group corresponds to the LPAIV-infected group. Numbers preceding arrows indicate the number of unique transcripts/genes per annotation. (*) indicates LPAIV genes.
Figure 4:
Figure 4:. Heat map for differentially expressed genes in the ileum of uninfected and LPAIV-infected blue-winged teals.
A. Heat map for differentially expressed genes in the ileum between uninfected (control) and LPAIV-infected birds on one, three, five-, and 14-days post infection (DPI). Illustrated are the relative expression levels of each transcript (rows) in each sample (column). Rows are hierarchically clustered by expression. Log2-transformed expression values are z-transformed. Box plots are provided for each visually observed gene cluster. B. Enriched GO terms corresponding to each cluster.
Figure 5:
Figure 5:. Differentially expressed transcripts and genes by shed status and days post-infection for two tissue types (bursa and ileum) for LPAIV-infected blue-winged teals.
Differentially expressed transcripts/genes between shed level groups (Low, Moderate, High) of LPAIV-infected teal on one (I1), three (I3), and five (I5) days post infection for (A) bursa and (B) ileum tissues. Each number represents the quantity of DET/DEGs per comparison, and/or shared between comparisons. Transcripts/Genes up-regulated (↑) or down-regulated (↓) corresponds to the first shed level group listed in the comparison. See S2 Supplemental File for additional gene information and log2(fold count).
Figure 6:
Figure 6:. Differential expression of endogenous retroviral genes in ileum of LPAIV-infected blue-winged teals.
Expression levels of differentially expressed endogenous retroviral genes in the ileum between shed level groups of LPAIV-infected teal on one (I1), three (I3), and five (I5) days post infection (DPI). The expression of uninfected (control) birds is displayed for reference.
Figure 7:
Figure 7:. Heat map for differentially expressed genes on five days post-infection in the ileum of LPAIV-infected blue-winged teals.
A. Heat map for differentially expressed genes in the ileum between shed level groups of LPAIV-infected teal on five days post infection. Illustrated are the relative expression levels of each transcript (rows) in each sample (column). Rows are hierarchically clustered by expression. Log2-transformed expression values are z-transformed. Box plots are provided for each visually observed gene cluster. B. Enriched GO terms corresponding to each cluster.
FIGURE 8.
FIGURE 8.. Type I Interferon Pathway.
Antiviral interferon stimulated genes (ISGs, purple) are produced through a cascade of intracellular signaling processes (signaling molecules are red) known as the interferon pathway. Pattern recognition receptors (dark blue) and toll-like receptors (TLRs) stimulate adaptor molecules (green) for the production of transcription factors (orange). Transcription factors relocate to the nucleus to trigger the production of interferons (IFN, light blue). Interferons transport outside the nucleus to initiate the JAK-STAT signaling pathway responsible for the production of the ISGF3 complex, which relocates to the nucleus to stimulate the production of ISGS. ISGs have various antiviral effects targeting viral replication or acting directly on the interferon pathway.

Similar articles

References

    1. Woolhouse ME, Dye C, Etard JF, Smith T, Charlwood JD, Garnett GP, Hagan P, Hii JL, Ndhlovu PD, Quinnell RJ, Watts CH, Chandiwana SK, Anderson RM, Heterogeneities in the transmission of infectious agents: implications for the design of control programs., Proc. Natl. Acad. Sci. U. S. A. 94 (1996) 338–342. doi:10.1073/pnas.94.1.338. - DOI - PMC - PubMed
    1. Lloyd-Smith JO, Schreiber SJ, Kopp PE, Getz WM, Superspreading and the effect of individual variation on disease emergence, Nature. 438 (2005) 355–359. - PMC - PubMed
    1. Chase-Topping M, Gally D, Low C, Matthews L, Woolhouse M, Super-shedding and the link between human infection and livestock carriage of Escherichia coli O157, Nat. Rev. Microbiol. 6 (2008) 904–912. - PMC - PubMed
    1. Matthews L, Low JC, Gally DL, Pearce MC, Mellor DJ, Heesterbeek J. a P, Chase-Topping M, Naylor SW, Shaw DJ, Reid SWJ, Gunn GJ, Woolhouse MEJ, Heterogeneous shedding of Escherichia coli O157 in cattle and its implications for control, Proc. Natl. Acad. Sci. U. S. A. 103 (2006) 547–552. doi:10.1073/pnas.0503776103. - DOI - PMC - PubMed
    1. Wang O, McAllister TA, Plastow G, Stanford K, Selinger B, Guan LL, Host mechanisms involved in cattle Escherichia coli O157 shedding: A fundamental understanding for reducing foodborne pathogen in food animal production, Sci. Rep. 7 (2017) 1–15. doi:10.1038/s41598-017-06737-4. - DOI - PMC - PubMed