. 2023 Mar;164(3):376-391.e13.
doi: 10.1053/j.gastro.2022.11.014. Epub 2022 Nov 18.

Dysregulated Amino Acid Sensing Drives Colorectal Cancer Growth and Metabolic Reprogramming Leading to Chemoresistance

Affiliations

Dysregulated Amino Acid Sensing Drives Colorectal Cancer Growth and Metabolic Reprogramming Leading to Chemoresistance

Sumeet Solanki et al. Gastroenterology. 2023 Mar.

Abstract

Background & aims: Colorectal cancer (CRC) is a devastating disease that is highly modulated by dietary nutrients. Mechanistic target of rapamycin complex 1 (mTORC1) contributes to tumor growth and limits therapy responses. Growth factor signaling is a major mechanism of mTORC1 activation. However, compensatory pathways exist to sustain mTORC1 activity after therapies that target oncogenic growth factor signaling. Amino acids potently activate mTORC1 via amino acid-sensing GTPase activity towards Rags (GATOR). The role of amino acid-sensing pathways in CRC is unclear.

Methods: Human colon cancer cell lines, preclinical intestinal epithelial-specific GATOR1 and GATOR2 knockout mice subjected to colitis-induced or sporadic colon tumor models, small interfering RNA screening targeting regulators of mTORC1, and tissues of patients with CRC were used to assess the role of amino acid sensing in CRC.

Results: We identified loss-of-function mutations of the GATOR1 complex in CRC and showed that altered expression of amino acid-sensing pathways predicted poor patient outcomes. We showed that dysregulated amino acid-sensing induced mTORC1 activation drives colon tumorigenesis in multiple mouse models. We found amino acid-sensing pathways to be essential in the cellular reprogramming of chemoresistance, and chemotherapeutic-resistant patients with colon cancer exhibited de-regulated amino acid sensing. Limiting amino acids in in vitro and in vivo models (low-protein diet) reverted drug resistance, revealing a metabolic vulnerability.

Conclusions: Our findings suggest a critical role for amino acid-sensing pathways in driving CRC and highlight the translational implications of dietary protein intervention in CRC.

Keywords: 5-Fluorouracil; Depdc5; Sestrin 2; Wdr24; mTORC1.


Conflict of interest statement

Disclosure Statement: The authors are not aware of any affiliations, funding, or financial interests that might impact the objectivity of the manuscript.

Conflict of Interest: The authors have declared that no conflict of interest

Figures

Figure 1:
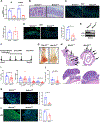
Figure 1:. Low dietary protein decreases tumorigenesis in a colon tumor model
(A) Human CRC cells were serum starved followed by amino acid starvation for 2 hours and 1X amino acids were added for 1 hour. CRC cells were stimulated with insulin (10nmol/ml) at indicated time points (B) PI3K+/+ and PI3KΔIE mice aged 6–8 weeks were induced with three doses of tamoxifen (100mg/kg) and were sacrificed a week later, colonic scrapes collected (representative westerns shown, n = 3 – 5 mice per group). (C) PI3K+/+ and PI3KΔIE mice were induced with tamoxifen, kept on control (21% protein) or low protein (4%) diet and were sacrificed a week later and colonic scrapes collected (D) Schematic of dietary regimen for the sporadic colon tumor model. (E) Gross colonic, (F) H&E images and (G) total and (H) stratified dysplasia scores of CDX2ERT2 ApcF/F mice on control (n = 8) or 4% protein diet (n = 11). (I) pS6 staining and quantitation in CDX2ERT2 ApcF/F mice on control (n = 3) or 4% protein diet (n = 4). (J) Ki67 staining and quantitation of in CDX2ERT2 ApcF/F mice on control (n = 8) or 4% protein diet (n = 11). All pictures shown are Representative. *P < .05, ***P < .001. Data are presented as mean ± SEM
Figure 2:
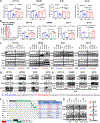
Figure 2:. GATOR complexes are dysregulated in CRC and are essential in mTORC1 regulation.
(A) Schematic of amino acid sensing pathway. (B) Wdr24+/+ & Wdr24−/− CRC cells were incubated in serum free or 10% FBS containing media for 24 hours (C) Depdc5+/+ and Depdc5−/− CRC cells were incubated in amino acid free, 0.1X, 0.2X, 0.5X and 1X of total amino acids for 24 hours (D) Depdc5 mutants in CRC. (E) R243*, Q63R, D1357G, L1472V mutants were modeled and visualized in PyMOL (Molecular Graphics System Version 2.0 Schrödinger LLC). Green arrows indicate R243* mutant, red arrows indicate Q63R, D1357G, L1472V mutants. (F) HEK293T cells were transfected with 1 ug of Empty vector, R243* mutant and Depdc5 plasmids, and (G) D1357G, G578V, K917R, L1472V, S692Y, Q63R mutants and Depdc5 plasmids, 48 hours later cells were lysed and probed (H) Depdc5 expression was analyzed in adjacent normal and tumor tissues of CRC patients using RNA-sequencing dataset from The Cancer Genome Atlas (TCGA) and (I) in tumor tissues of a small cohort of CRC patients at UM. (J) CRC patient survival (Km plotter, statistical test) stratification based on Depdc5 expression. (Red indicates high expression of Depdc5 and black indicates low expression of Depdc5). **P < .01, ****P < .0001 Data are presented as mean ± SEM.
Figure 3:
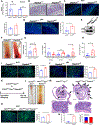
Figure 3:. Disruption of intestinal epithelial Wdr24 decreases mTORC1 and colon tumors.
(A) Wdr24 expression in scraped duodenum (small intestine) and colons of Wdr24+/+ and Wdr24ΔIE mice by qPCR (n = 3). (B) Colonic H&E images of Wdr24+/+ and Wdr24ΔIE mice aged 6–8 weeks (n = 3 – 5 mice per group). (C) Ki67 staining and quantitation in colons of Wdr24+/+ and Wdr24ΔIE mice (n = 3). (D) pS6 staining and quantitation of colons of Wdr24+/+ and Wdr24ΔIE mice (n = 3). (E) Wdr24+/+ and Wdr24ΔIE mice aged 6–8 weeks were sacrificed and colonic scrapes were probed (F) Schematic of azoxymethane/dextran sulfate sodium (AOM/DSS) colon tumor model (G) Gross colonic tumors and (H) H&E images of Wdr24+/+ (n = 7) and Wdr24ΔIE mice (n = 14) subjected to AOM/DSS model. (I) Quantitation of tumor numbers, size and (J) tumor volume in Wdr24+/+ and Wdr24ΔIE mice. (K) Ki67 staining and quantitation in tumor tissues of Wdr24F/F and Wdr24ΔIE mice subjected to AOM/DSS model (n = 3) (L) pS6 staining and quantitation in tumor tissues of Wdr24+/+ and Wdr24ΔIE mice subjected to AOM/DSS model (n =3). All pictures shown are Representative. *P < .05, **P < .01. Data are presented as mean ± SEM.
Figure 4:
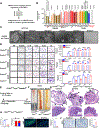
Figure 4:. Disruption of intestinal epithelial Depdc5 increases mTORC1 and colon tumors.
(A) Depdc5 expression in scraped duodenum (small intestine) and colons of Depdc5+/+ and Depdc5ΔIE mice by qPCR (n = 3). (B) Colonic H&E images of Depdc5+/+ and Depdc5ΔIE mice aged 6–8 weeks (n = 3 – 5). (C) Ki67 staining and quantitation in colons of Depdc5+/+ and Depdc5ΔIE mice (n = 3–4). (D) pS6 staining and quantitation in colons of Depdc5+/+ and Depdc5ΔIE mice (n = 3–4). (E) Depdc5+/+ and Depdc5ΔIE mice aged 6–8 weeks were sacrificed and colonic scrapes were probed. (F) Gross colonic tumors of Depdc5+/+ (n = 7) and Depdc5ΔIE mice (n = 9) subjected to AOM/DSS model. (G) Quantitation of tumor numbers, size and (H) tumor burden of Depdc5+/+ (n = 7) and Depdc5ΔIE mice (n = 9) subjected to AOM/DSS model. (I) Ki67 staining and quantitation in tumor tissues of Depdc5+/+ and Depdc5ΔIE mice (n = 4) (J) pS6 staining and quantitation of tumor tissues in Depdc5+/+ (n = 3) and Depdc5ΔIE mice (n = 4). (K) Schematic of sporadic colon tumor model in CDX2ERT2 ApcF/F and CDX2ERT2 ApcF/F/Depdc5F/F mice. (L) Gross colonic and (M) H&E images (N) Total and stratified Dysplastic scores of CDX2ERT2 ApcF/F (n = 5) and CDX2ERT2 ApcF/F/Depdc5F/F mice (n = 4). (O) Ki67 staining and quantitation of dysplastic tissue area in CDX2ERT2 ApcF/F (n = 3) and CDX2ERT2 ApcF/F/Depdc5F/F mice (n = 4). All pictures shown are Representative. *P < .05, **P < .01, ***P < .001, ****P < .0001. Data are presented as mean ± the SEM
Figure 5:
Figure 5:. Drug resistance alters cellular amino acid sensing leading to constitutive mTORC1 activation in CRC.
(A) Depdc5+/+ and Depdc5−/− CRC cells treated with 5FU, and growth assessed by live cell imaging. (B) Schematic of generating 5FU resistant colonies. 5FU sensitive and resistant cells were treated with 5FU and growth was assessed by live cell imaging. (C) 5FU sensitive and resistant CRC cells were incubated in amino acid free, 0.1X, 0.2X, 0.5X and 1X of total amino acids for 24 hours (D) 5FU sensitive and resistant CRC cells were lysed and probed (E) CRC cells were treated with 5FU for 24 hours (F) OncoPrint displaying mutually exclusive genetic alterations of amino acid sensing and TP53 pathways. (G) Colonic enteroids from Apc−/− and Apc−/−/p53−/− mice were incubated in amino acid free, 0.1X, 1X hours for 2 hours, probed **P < .01, ***P < .001, ****P < .0001. Data are presented as mean ± SEM.
Figure 6:
Figure 6:. Disruption of Depdc5 leads to a metabolic vulnerability under amino acid limiting conditions.
(A) Schematic of small interfering RNA (siRNA)-based screen targeting known regulators of mTORC1. (B) Quantitation of cell growth to low amino acids (0.025X) by small interfering RNA (siRNA)-based screen. (C) Depdc5+/+ and Depdc5−/− CRC cells were incubated in low amino acids (0.025X) for 5 days and were imaged (D) Depdc5+/+ and Depdc5−/− CRC cells were incubated in amino acid free, 0.025X, 0.1X, 0.2X,0.5X and 1X and growth was assessed using colony forming assays at 10 days. (E) Schematic of sporadic colon tumor model and dietary regimen. (F) Gross colonic and (G) H&E images and (H) quantitation of total and stratified dysplastic tissue of CDX2ERT2 ApcF/F/Depdc5F/F mice on control and low protein diet (n = 5 mice per group). (I) Ki67 staining image and quantitation of CDX2ERT2 ApcF/F/Depdc5F/F mice on control and low protein diet (n = 3) (J) Cleaved caspase 3 staining image and quantitation of CDX2ERT2 ApcF/F/Depdc5F/F mice on control and low protein diet (n = 3). All pictures shown are Representative. *P < .05, **P < .01, ***P < .001, ****P < .0001. Data are presented as mean ± SEM
Figure 7:
Figure 7:. Low amino acids induce cell death in drug resistant CRC cells.
(A, B) Depdc5+/+ and Depdc5−/− or 5FU sensitive and resistant CRC cells were incubated in 1X amino acid media, rapamycin (1μM) or 0.025X amino acid media with 5FU and growth was assessed using colony forming assay at 10 days. (C) Human colorectal cancer patients treated with chemotherapeutics were classified as responder’s (n = 11) vs non responders (n = 9) depending on treatment effect and were assessed for Sesn2. (D) Model of dysregulated amino acid sensing pathway driving growth but offering vulnerability under low dietary protein. All pictures shown are Representative. *P < .05, **P < .01, ***P < .001, ****P < .0001. Data are presented as mean ± SEM

References

    1. Fearon ER. Molecular genetics of colorectal cancer. Annu Rev Pathol 2011, pp.479–507 - PubMed
    1. Li J, Ma X, Chakravarti D, et al. Genetic and biological hallmarks of colorectal cancer. Genes & development, 2021, pp. 787–820. - PMC - PubMed
    1. Siegel RL, Miller KD, Fuchs HE, et al. Cancer statistics, 2022. CA Cancer J Clin 2022; pp.7–33 - PubMed
    1. Francipane MG, Lagasse E. mTOR pathway in colorectal cancer: an update Oncotarget 2014, pp. 49–66. - PMC - PubMed
    1. Liu GY, Sabatini DM. mTOR at the nexus of nutrition, growth, ageing and disease. Nat Rev Mol Cell Biol 2020, pp. 183–203. - PMC - PubMed

Publication types

Substances