. 2023 Jan 19;24(1):bbac475.
doi: 10.1093/bib/bbac475.

Benchmarking cell-type clustering methods for spatially resolved transcriptomics data

Affiliations

Benchmarking cell-type clustering methods for spatially resolved transcriptomics data

Andrew Cheng et al. Brief Bioinform. .

Abstract

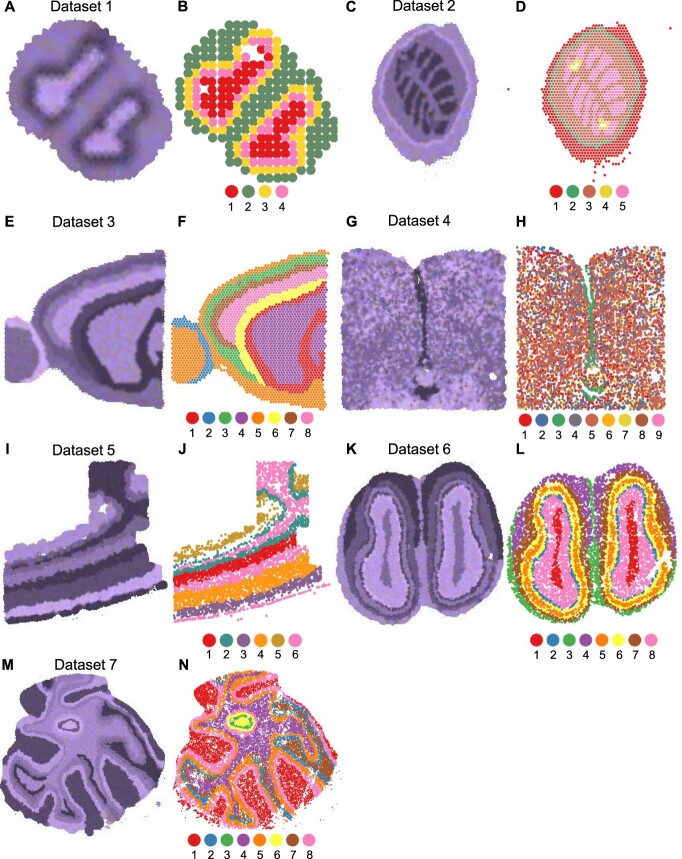
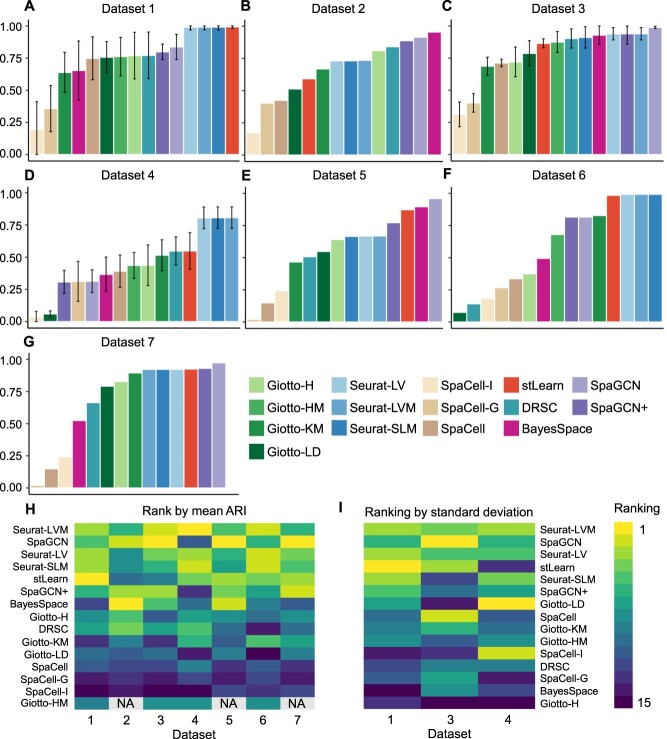
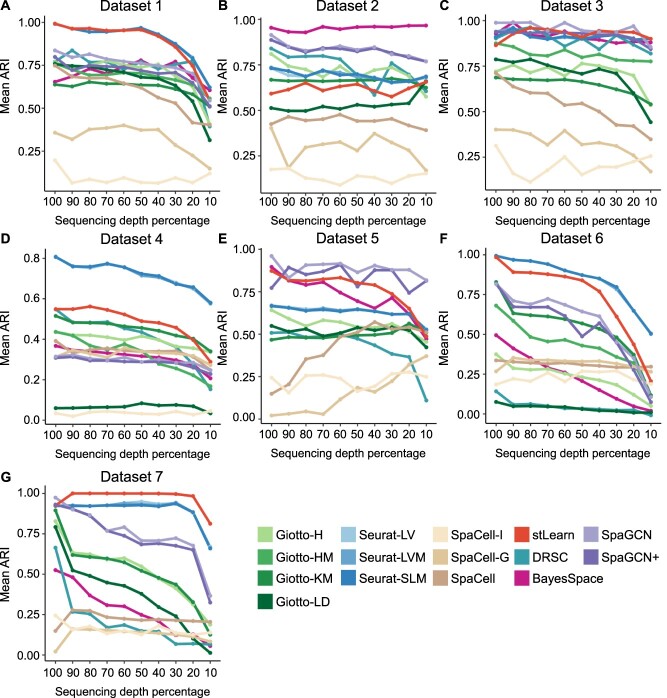
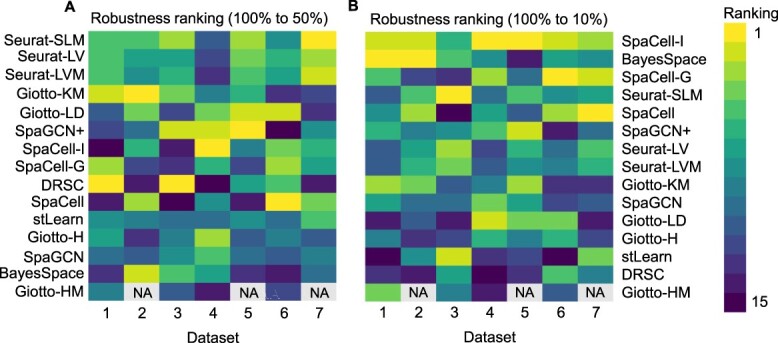
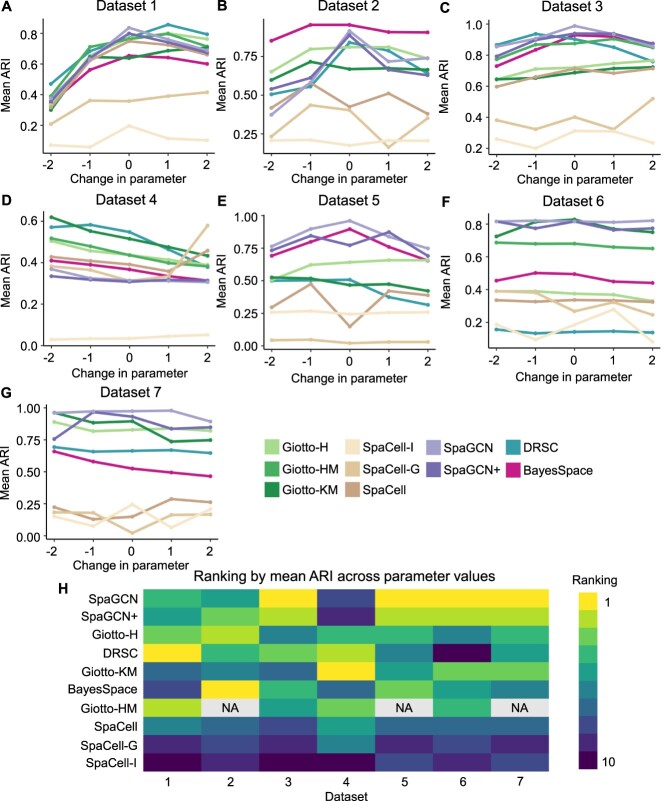
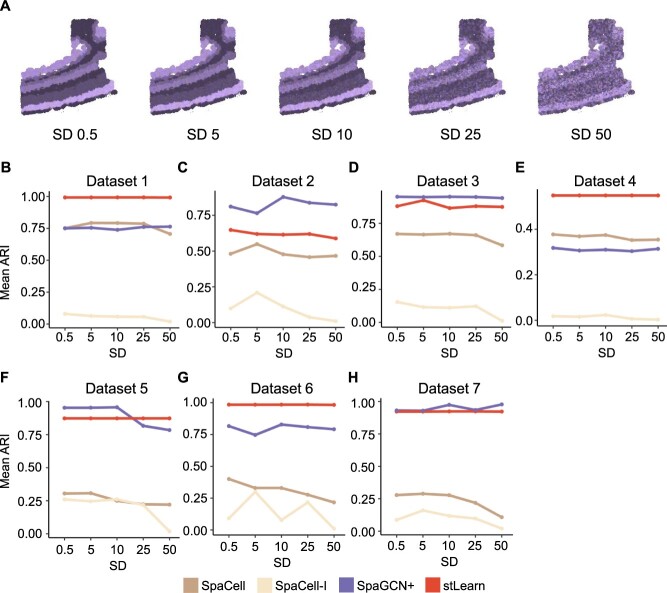
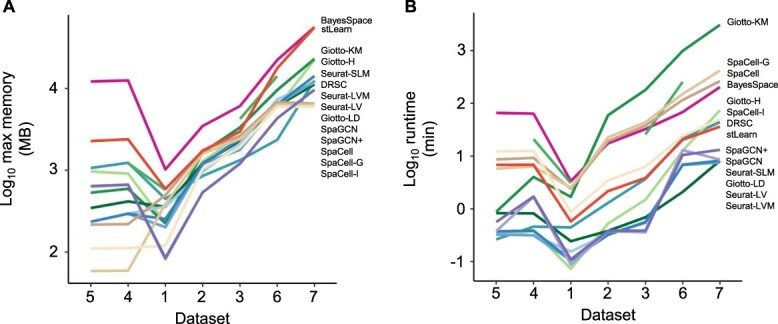
Spatially resolved transcriptomics technologies enable the measurement of transcriptome information while retaining the spatial context at the regional, cellular or sub-cellular level. While previous computational methods have relied on gene expression information alone for clustering single-cell populations, more recent methods have begun to leverage spatial location and histology information to improve cell clustering and cell-type identification. In this study, using seven semi-synthetic datasets with real spatial locations, simulated gene expression and histology images as well as ground truth cell-type labels, we evaluate 15 clustering methods based on clustering accuracy, robustness to data variation and input parameters, computational efficiency, and software usability. Our analysis demonstrates that even though incorporating the additional spatial and histology information leads to increased accuracy in some datasets, it does not consistently improve clustering compared with using only gene expression data. Our results indicate that for the clustering of spatial transcriptomics data, there are still opportunities to enhance the overall accuracy and robustness by improving information extraction and feature selection from spatial and histology data.

Keywords: Clustering; Single-cell genomics; Spatial trasncriptomics.


Figures

Figure 1
Figure 1
Simulated H&E-stained images and true cell-type assignments of Datasets 1–7. (A, C, E, G, I, K, M): Simulated H&E-stained images of Datasets 1 to 7. (B, D, F, H, J, L, N): Cells or spots are shown in actual spatial coordinates and colored by their true labels. Datasets are ordered based on increasing number of cells or spots.
Figure 2
Figure 2
Comparison of clustering accuracy based on seven spatial transcriptomics datasets. (A–G): Mean adjusted Rand index (ARI) scores for Datasets 1–7. The vertical bars indicate one standard deviation above or below the average score (when more than one replicate is available). (H): Ranking of methods based on average ARI scores. (I): Ranking of methods based on standard deviations of ARIs, for Datasets 1, 3 and 4 which have multiple replicates. Methods with higher average ARI or lower standard deviation are ranked better. Methods are ordered by average ranks in the heatmaps, with methods on the top being the best. The entries marked by NA indicate that the method encountered an error for that dataset.
Figure 3
Figure 3
Comparison of average clustering accuracy across replicates given a decreasing percentage of original sequencing depth. (A, C, D): Replicates are directly available based on data presented in Table 1. (B, E, F, G): Since the original dataset only has one replicate, for each percentage, five technical replicates were generated in the downsampling process.
Figure 4
Figure 4
Ranking of methods based on robustness to decreased sequencing depth. Robustness is compared based on the absolute value difference in mean ARI scores when the sequencing depth is reduced to 50% (A) or 10% (B) of the original depth. In both heatmaps, a smaller difference is ranked higher. Entries marked with NA indicate that the corresponding method encountered errors on that dataset.
Figure 5
Figure 5
Comparison of clustering methods based on robustness to clustering parameter. (A–G): Mean ARI of clustering methods given different parameters of cluster number. Change in parameter (the formula image-axis) denotes the difference between the input parameter of cluster number and the true cell type number of a dataset. (H): Ranking of methods according to the mean ARI score across parameter values. Methods with a higher average ARI score across parameter choices are ranked better. Methods are ordered by average ranks across datasets. Entries marked with NA indicate that the method encountered errors on that dataset.
Figure 6
Figure 6
Comparison of clustering methods based on robustness to variation in histology images. (A): Histology images for Dataset 5 that were simulated with an increasing standard deviation. (B–H): Mean ARI of SpaGCN+, SpaCell, SpaCell-I and stLearn given histology images of different levels of variation for Datasets 1–7.
Figure 7
Figure 7
Comparison of clustering methods based on maximum memory usage and runtime. (A): Logformula image of maximum memory measured in megabytes and used by the entire clustering pipeline for each method, including pre-processing. (B): Logformula image of runtime measured in minutes. Datasets are ordered based on cell number formula image gene number. In each panel, methods marked on the right are ordered based on results on Dataset 7. Since Giotto-HM encountered errors on Datasets 2, 5 and 7, its memory usage and runtime are not displayed for these three datasets.

References

    1. Larsson L, Frisén J, Lundeberg J. Spatially resolved transcriptomics adds a new dimension to genomics. Nat Methods 2021;18(1):15–8. - PubMed
    1. Dries R, Chen J, Del Rossi N, et al. Advances in spatial transcriptomic data analysis. Genome Res 2021;31(10):1706–18. - PMC - PubMed
    1. Close JL, Long BR, Zeng H. Spatially resolved transcriptomics in neuroscience. Nat Methods 2021;18(1):23–5. - PubMed
    1. Liao J, Xiaoyan L, Shao X, et al. Uncovering an organ’s molecular architecture at single-cell resolution by spatially resolved transcriptomics. Trends Biotechnol 2021;39(1):43–58. - PubMed
    1. Xia C, Fan J, Emanuel G, et al. Spatial transcriptome profiling by merfish reveals subcellular rna compartmentalization and cell cycle-dependent gene expression. Proc Natl Acad Sci 2019;116(39):19490–9. - PMC - PubMed

Publication types