Observational Study
. 2022 Nov 21;10(1):e200056.
doi: 10.1212/NXI.0000000000200056. Print 2023 Jan.

Sustained Low Relapse Rate With Highly Variable B-Cell Repopulation Dynamics With Extended Rituximab Dosing Intervals in Multiple Sclerosis

Affiliations
Observational Study

Sustained Low Relapse Rate With Highly Variable B-Cell Repopulation Dynamics With Extended Rituximab Dosing Intervals in Multiple Sclerosis

Chiara Starvaggi Cucuzza et al. Neurol Neuroimmunol Neuroinflamm. .

Erratum in

Abstract

Background and objectives: B cell-depleting therapies are highly effective in relapsing-remitting multiple sclerosis (RRMS) but are associated with increased infection risk and blunted humoral vaccination responses. Extension of dosing intervals may mitigate such negative effects, but its consequences on MS disease activity are yet to be ascertained. The objective of this study was to determine clinical and neuroradiologic disease activity, as well as B-cell repopulation dynamics, after implementation of extended rituximab dosing in RRMS.

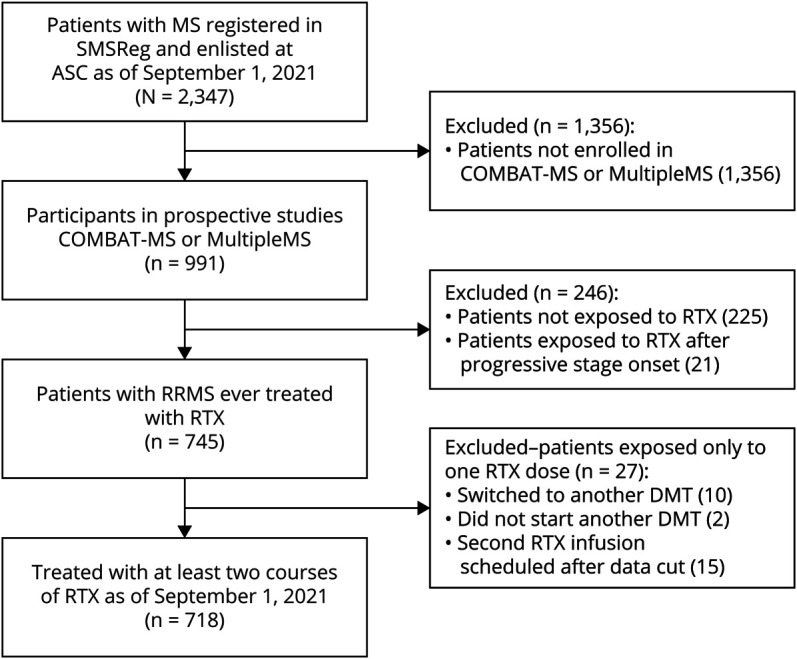
Methods: We conducted a prospective observational study in a specialized-care, single-center setting, including patients with RRMS participating in the COMBAT-MS and MultipleMS observational drug trials, who had received at least 2 courses of rituximab (median follow-up 4.2 years, range 0.1-8.9 years). Using Cox regression, hazard ratios (HRs) of clinical relapse and/or contrast-enhancing lesions on MRI were calculated in relation to time since last dose of rituximab.

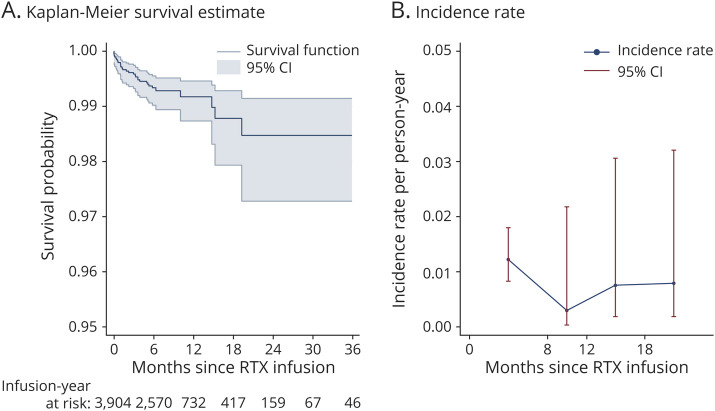
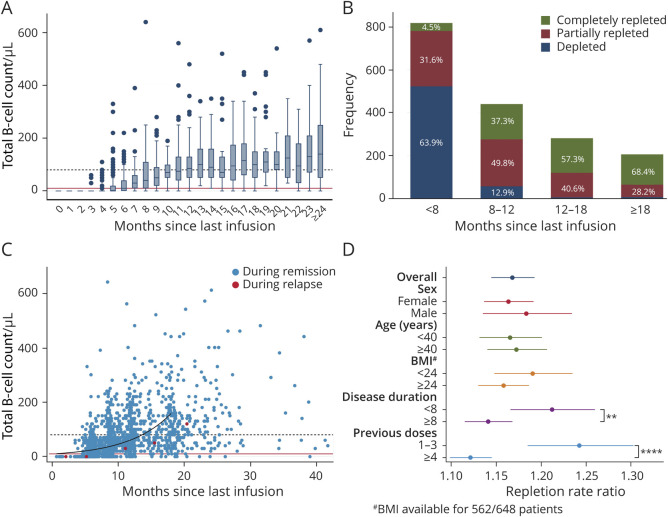
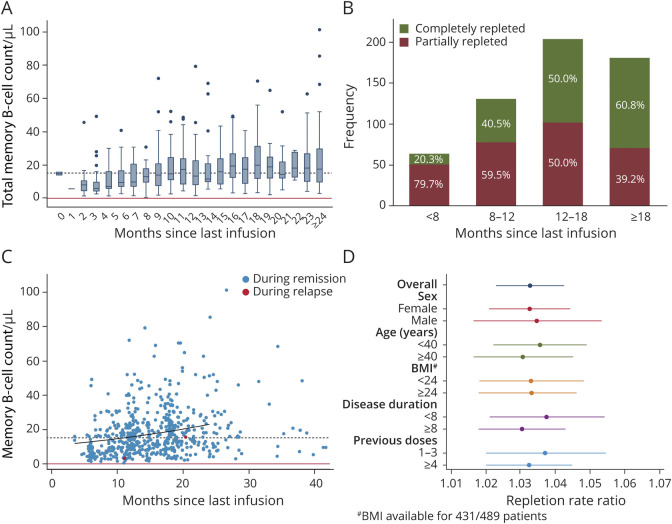
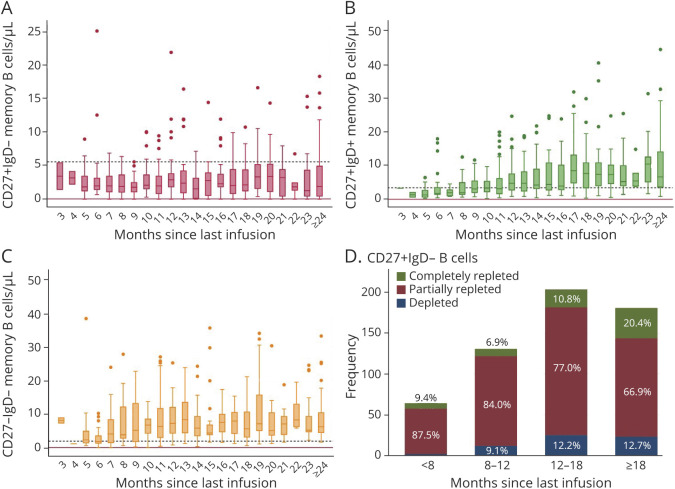
Results: A total of 3,904 dose intervals were accumulated in 718 patients and stratified into 4 intervals: <8, ≥8 to 12, ≥12 to 18, and ≥18 months. We identified 24 relapses of which 20 occurred within 8 months since previous infusion and 4 with intervals over 8 months. HRs for relapse when comparing ≥8 to 12, ≥12 to 18, and ≥18 months with <8 months since last dose were 0.28 (95% CI 0.04-2.10), 0.38 (95% CI 0.05-2.94), and 0.89 (95% CI 0.20-4.04), respectively, and thus nonsignificant. Neuroradiologic outcomes mirrored relapse rates. Dynamics of total B-cell reconstitution varied considerably, but median total B-cell counts reached lower level of normal after 12 months and median memory B-cell counts after 16 months.

Discussion: In this prospective cohort of rituximab-treated patients with RRMS exposed to extended dosing intervals, we could not detect a relation between clinical or neuroradiologic disease activity and time since last infusion. Total B- and memory B-cell repopulation kinetics varied considerably. These findings, relevant for assessing risk-mitigation strategies with anti-CD20 therapies in RRMS, suggest that relapse risk remains low with extended infusion intervals. Further studies are needed to investigate the relation between B-cell repopulation dynamics and adverse event risks associated with B-cell depletion.


Figures

Figure 1
Figure 1. Study Population
Inclusion criteria flowchart. ASC = Academic Specialist Center; DMT = disease-modifying therapy, RRMS = relapsing-remitting MS; RTX = rituximab; SMSReg = Swedish MS Registry.
Figure 2
Figure 2. Risk of Clinical Relapse and/or Contrast-Enhancing Lesion Occurrence in Relation to Time Since Last Rituximab Infusion
(A) Kaplan-Meier curve of event-free time since last rituximab infusion. (B) Incidence rate of clinical relapse and/or CELs at <8 months, ≥8 to 12, ≥12 to 18, and ≥18 months since last rituximab infusion. CEL = contrast-enhancing lesion; RTX = rituximab.
Figure 3
Figure 3. Total B-Cell Repopulation Dynamics in Relation to Time Since Last Rituximab Infusion
(A) Box plot depicting distributions of B-cell count grouping samples into 1-month-time intervals since last rituximab infusion. Continuous red line: B-cell detection limit; dashed black line: LLN. (B) Total number of observations (y axis) with relative frequencies (bar labels) of depleted (<10 cells/μL), partially repleted (≥10–80 cells/μL), and completely repleted (≥80 cells/μL) B-cell counts at <8 months, ≥8 to 12, ≥12 to 18, and ≥18 months since last rituximab infusion. (C) Scatter plot of total B-cell counts in relation to time since last infusion, with samples collected within 1 month from a relapse/contrast-enhancing lesion highlighted in red. The predicted repopulation kinetic up to 18 months since last rituximab infusion according to a negative binomial regression model is depicted by the black curve. Continuous red line: B-cell detection limit; dashed black line: lower limit of normal. (D) Coefficient plot of the repletion rate ratios (RRs) for B-cell repopulation for the overall model and stratified according to sex, age (<40 and ≥40 years of age), BMI (<24 and ≥24 kg/m2), disease duration (<8 and ≥8 years), and number of previous rituximab doses (1–3 and ≥4). Among the analyzed potential effect modifiers, disease duration and number of previous rituximab doses affected B-cell reappearance kinetics (Wald test p < 0.01 for disease duration, **, and p < 0.0001 for rituximab doses, ****). #BMI data were available for 86.7% of the patients, 86.5% of the samples.
Figure 4
Figure 4. Memory B-Cell Repopulation Dynamics in Relation to Time Since Last Rituximab Infusion
(A) Box plot showing distributions of memory B-cell count grouping samples into 1-month time intervals since last rituximab infusion. Continuous red line: memory B-cell detection limit; dashed black line: lower limit of normal. (B) Total number of observations (y axis) with relative frequencies (bar labels) of depleted (<0.05 cells/μL), partially repleted (≥0.05–15.2 cells/μL), and completely repleted (≥15.2 cells/μL) levels of memory B cells at <8 months, ≥8 to 12, ≥12 to 18, and ≥18 months since last rituximab infusion. (C) Scatter plot of memory B-cell counts in relation to time since last infusion, with samples collected within 1 month from a relapse/contrast-enhancing lesion highlighted in red. The repopulation kinetic predicted by a negative binomial regression model up to 24 months since last rituximab infusion is shown by the black curve. Continuous red line: memory B-cell detection limit; dashed black line: lower limit of normal. (D) Coefficient plot of the repletion rate ratios (RRs) for memory B-cell repopulation for the overall model and stratified according to sex, age, BMI, disease duration, and number of previous rituximab doses. None of the models showed any effect of the analyzed covariates on memory B-cell repletion rates. #BMI data were available for 88.1% of the patients, 86.9% of the samples. BMI = body mass index
Figure 5
Figure 5. Memory B Subpopulation Repopulation Dynamics
(A–C) Box plot showing distributions of the 3 subsets of memory B cell: CD27+IgD− (A), CD27+IgD+ or double positive (DP, B), and CD27−IgD− or double negative (DN, C). Samples were grouped into 1-month time intervals since last rituximab infusion. Continuous red line: memory B-cell detection limit (0.05 cells/μL for all subsets); dashed black line: lower limit of normal (5.6 cells/μL for CD27+IgD− cells, 3.44 cells/μL for DP cells and 1.92 cells/μL for DN cells). (D) Total number of observations (y axis) with relative frequencies (bar labels) of depleted (<0.05 cells/μL), partially repleted (≥0.05–5.6 cells/μL), and completely repleted (≥5.6 cells/μL) levels of CD27+IgD− memory B cells at <8 months, ≥8 to 12, ≥12 to 18, and ≥18 months since last rituximab infusion.

References

    1. Walton C, King R, Rechtman L, et al. . Rising prevalence of multiple sclerosis worldwide: insights from the Atlas of MS. Mult Scler. 2020;1226(14):1816-1821. doi: 10.1177/1352458520970841. - DOI - PMC - PubMed
    1. Hauser SL, Waubant E, Arnold DL, et al. . B-cell depletion with rituximab in relapsing-remitting multiple sclerosis. N Engl J Med. 2008;358(7):676-688. doi: 10.1056/NEJMoa0706383 - DOI - PubMed
    1. Hauser SL, Bar-Or A, Comi G, et al. . Ocrelizumab versus interferon beta-1a in relapsing multiple sclerosis. N Engl J Med. 2017;376(3):221-234. doi: 10.1056/NEJMoa1601277 - DOI - PubMed
    1. Hauser SL, Bar-Or A, Cohen JA, et al. . Ofatumumab versus teriflunomide in multiple sclerosis. N Engl J Med. 2020;383(6):546-557. doi: 10.1056/NEJMoa1917246 - DOI - PubMed
    1. Luna G, Alping P, Burman J, et al. . Infection risks among patients with multiple sclerosis treated with fingolimod, natalizumab, rituximab, and injectable therapies. JAMA Neurol. 2020;77(2):184-191. doi: 10.1001/jamaneurol.2019.3365 - DOI - PMC - PubMed

Publication types

MeSH terms