. 2022 Nov 21;13(1):7058.
doi: 10.1038/s41467-022-34191-y.

Depletion of CD206+ M2-like macrophages induces fibro-adipogenic progenitors activation and muscle regeneration

Affiliations

Depletion of CD206+ M2-like macrophages induces fibro-adipogenic progenitors activation and muscle regeneration

Allah Nawaz et al. Nat Commun. .

Abstract

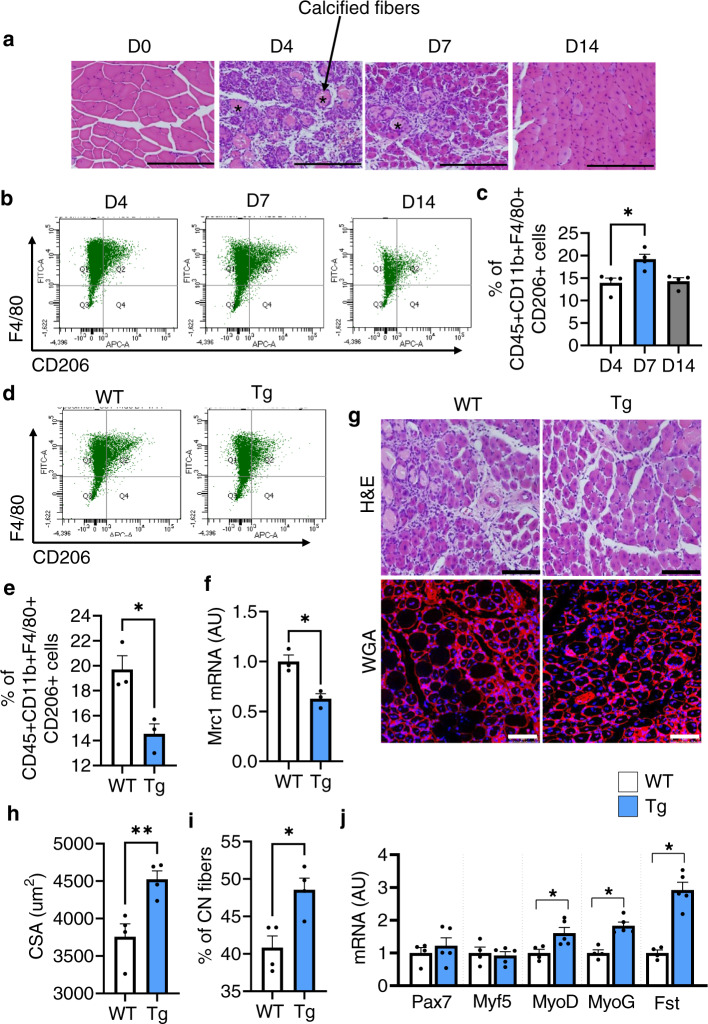
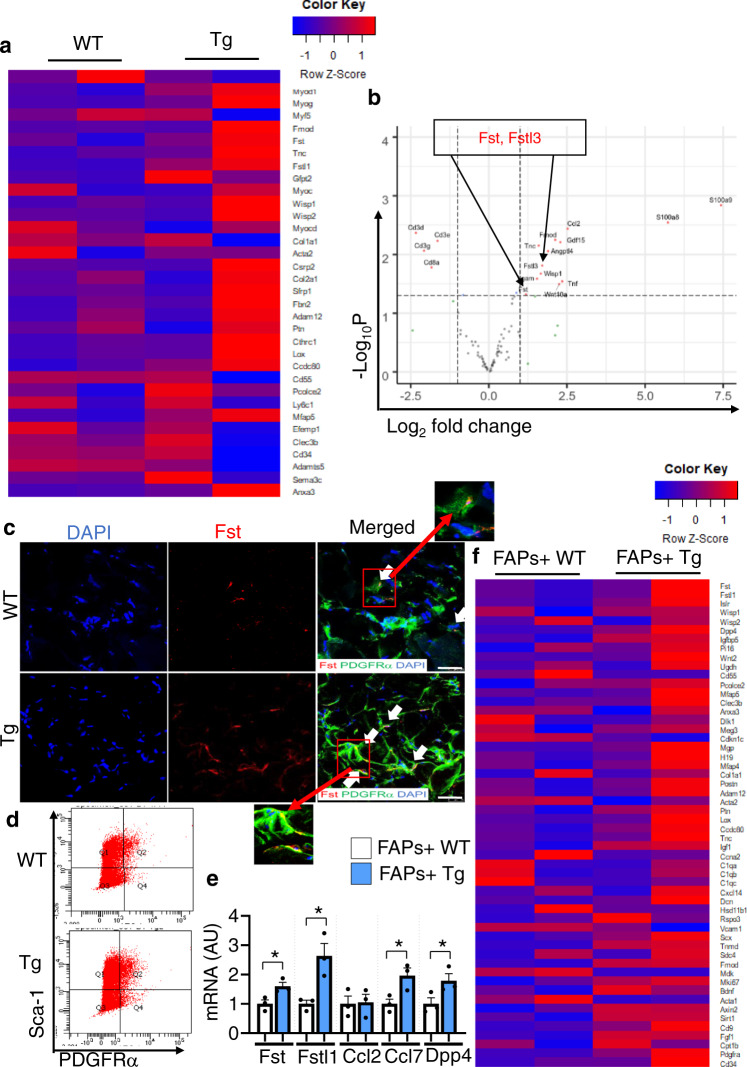
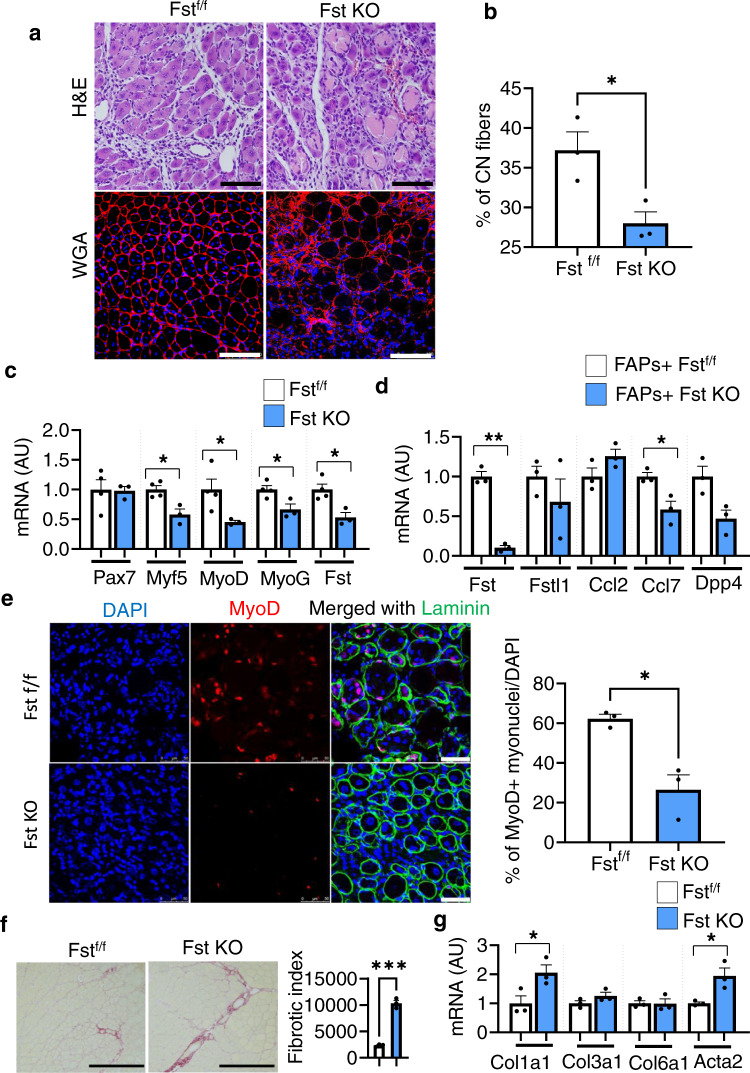
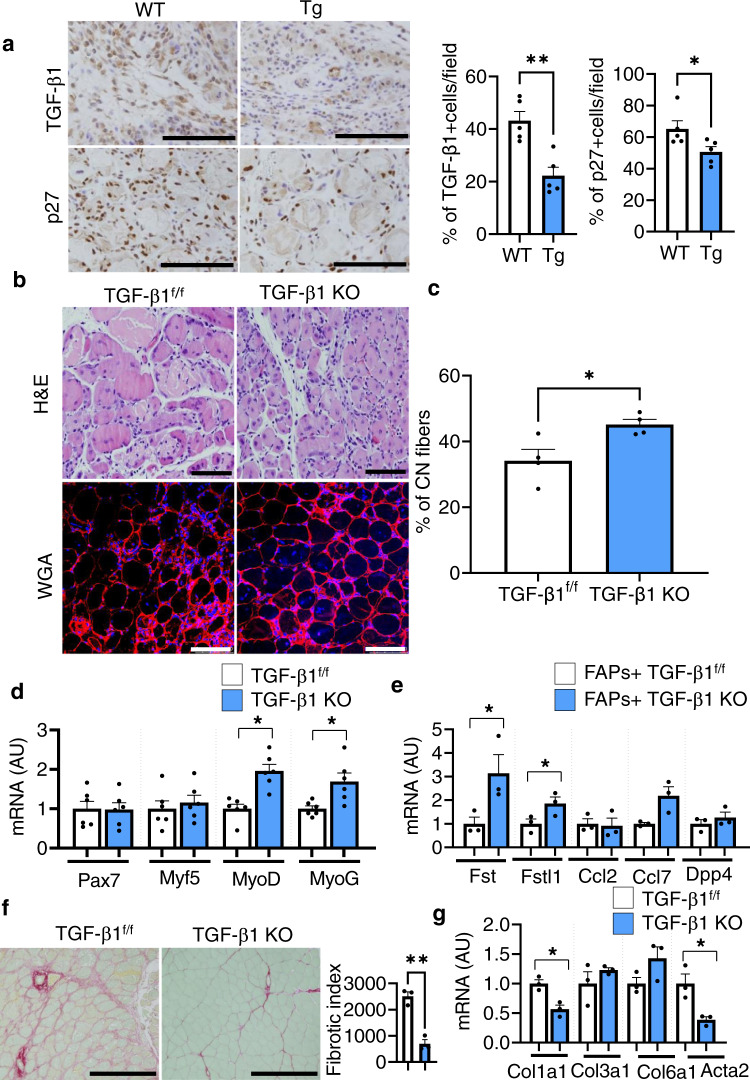
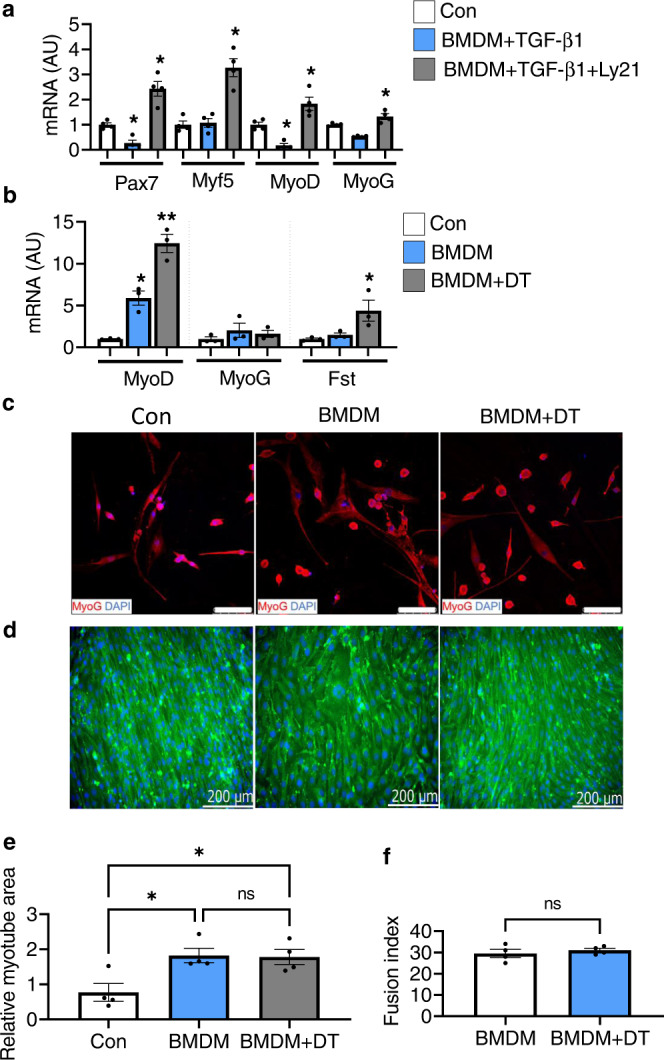
Muscle regeneration requires the coordination of muscle stem cells, mesenchymal fibro-adipogenic progenitors (FAPs), and macrophages. How macrophages regulate the paracrine secretion of FAPs during the recovery process remains elusive. Herein, we systemically investigated the communication between CD206+ M2-like macrophages and FAPs during the recovery process using a transgenic mouse model. Depletion of CD206+ M2-like macrophages or deletion of CD206+ M2-like macrophages-specific TGF-β1 gene induces myogenesis and muscle regeneration. We show that depletion of CD206+ M2-like macrophages activates FAPs and activated FAPs secrete follistatin, a promyogenic factor, thereby boosting the recovery process. Conversely, deletion of the FAP-specific follistatin gene results in impaired muscle stem cell function, enhanced fibrosis, and delayed muscle regeneration. Mechanistically, CD206+ M2-like macrophages inhibit the secretion of FAP-derived follistatin via TGF-β signaling. Here we show that CD206+ M2-like macrophages constitute a microenvironment for FAPs and may regulate the myogenic potential of muscle stem/satellite cells.


Conflict of interest statement

The authors declare no competing interests.

Figures

Fig. 1
Fig. 1. Depletion of CD206+ M2-like MΦ promotes muscle regeneration.
a Hematoxylin and eosin (H&E)-stained TA tissue paraffin sections of muscle obtained from male C57BL/6J mice following acute injury by cardiotoxin (CTX)-administration. Muscles were harvested at 0, 4, 7, and 14 dpi. n = 2 (D14), and 4 (D0, 4, 7). Scale bar, 200 μm. Asterisks (*) denote necrotic area. b Representative flow cytometry analysis of M2-like MΦ (CD45+CD11b+F4/80+CD206+) at 4, 7, and 14 dpi (n = 4 mice per group). c Quantification of CD206+ M2-like MΦ (n = 4 mice per group). d Representative flow cytometry analysis of M2-like MΦ (CD45+CD11b+F4/80+CD206+) and quantification (e) in muscle of WT and Tg mice harvested at 7 dpi (n = 3 mice per group). f Relative mRNA expression of Mrc1 (CD206) gene in muscle of Tg mice, compared with their littermate WT controls, harvested at 7 dpi (n = 3 mice per group). g Histological sections of Gc muscle from Tg mice and WT control mice, harvested at 7 dpi, stained with H&E (n = 3 mice per group) or WGA and DAPI (n = 4 mice per group). Scale bar, 200 μm (H&E) and 75 μm (WGA). h, i Images stained with DAPI and WGA were used to determine the cross-sectional areas (CSA) (in μm2) of centrally nucleated (CN) fibers (h) and % of CN fibers (i) of the Gc muscle of Tg and WT mice (n = 4 mice per group). j Relative mRNA expression of myogenesis-related marker genes in muscle of Tg mice, compared with their littermate WT control mice. n = 4 (WT), and 5 (Tg) mice. Source data are provided as a Source Data file. The data are shown as the means ± SEM. *p < 0.05, and **p < 0.01 were considered significant as determined using the one-way ANOVA followed by Tukey’s post hoc tests (c), and two-tailed Student t-tests (ej). WT wild-type, Tg transgenic, mRNA messenger RNA, AU arbitrary units, % percentage, WGA wheat germ agglutinin, and D day.
Fig. 2
Fig. 2. Depletion of CD206+ M2-like MΦ enhances expression of myogenesis-related marker genes and FAPs-related marker genes.
a Total RNA sequencing (RNA-Seq) analysis of tibialis anterior (TA) of Tg mice and control WT following acute injury. Heatmap of RNA-Seq expression data showing the most significantly altered FAPs-related marker genes in Tg mice, compared with littermate control WT mice (n = 2 mice per group). b Volcano plot analysis highlights the most significant gene alterations in Tg mice versus control WT mice based on false discovery rate threshold (red) [FDR q value < 0.05 and −0.58 > Log2 fold change (FC) > 0.58] and P value threshold (green) [P value < 0.05 and −0.58 > Log2 fold change (FC) > 0.58]. Highlighted in gray are the filtered non-significant changes, as indicated. The red dots represent genes that were significantly upregulated/downregulated in the muscle of Tg mice. The Y-axis denotes the −Log10 P values, while the X-axis shows the Log2 fold change values. The volcano plot was generated using RStudio (n = 2 mice per group). c High resolution confocal imaging of frozen TA sections from Tg mice and WT control mice, stained with anti-PDGFRα and anti-Fst antibodies. Scale bar, 25 μm. Arrows indicate co-localization of PDGFRα and Fst (n = 3 mice per group). Data are representative of at least three independent experiments. d Representative flow cytometry analysis of lineage negative Sca-1/PDGFRα double-positive (FAPs) cells in WT and Tg mice (n = 3 mice per group). Gating strategy is given in Supplementary Fig. 3b. e Relative mRNA expressions of the FACS-isolated FAPs fraction in muscle harvested from WT and Tg mice (n = 3 mice per group). Source data are provided as a Source Data file. The data are shown as the means ± SEM. *p < 0.05, compared with their littermates as determined using the two-tailed Student t-test. f Heatmap representation of differential expression analysis of activated FAPs-related marker genes in isolated FAPs of WT versus Tg mice (n = 2 mice per group).
Fig. 3
Fig. 3. Depletion of CD206+ M2-like MΦ specifically enhances FAP-derived Fst.
a Histological sections of Gc muscle from FAP-derived Fst KO and Fstf/f control mice, harvested at 7 dpi, stained with H&E (upper) or WGA and DAPI (lower) (n = 3 mice per group). Scale bar, 200 μm (H&E) and 100 μm (WGA). b Images stained with DAPI and WGA were used to quantify centrally nucleated (CN) fibers of muscle from FAP-derived Fst KO and Fstf/f control mice. Quantification of CN myofibers (cross-sectional areas (in µm2) of the Gc muscle) (n = 3 mice per group). c Relative mRNA expression of myogenesis-related marker genes in muscle of FAP-derived Fst KO mice, compared with their littermate controls. n = 4 (Fstf/f), and 3 (Fst KO) mice. d Relative mRNA expression of activated FAP-related marker genes in FACS-isolated FAPs of FAP-derived Fst KO mice, compared with their littermate control Fstf/f mice (n = 3 mice per group). e Representative images of frozen sections of muscle from Fst KO mice and their littermate control Fstf/f mice, stained with anti-laminin, and anti-MyoD antibodies. Scale bar, 50 μm. Quantification is given in right panel (n = 3 mice per group). f Representative images of sirius red-stained sections of TA from tamoxifen-treated FAP-derived Fst KO mice compared to tamoxifen-treated Fstf/f control mice. Quantification is given in right panel (n = 3 mice per group). Scale bars, 200 μm. Fibrotic area (red) was analyzed by ImageJ software. Data are representative of three independent experiments. g Relative mRNA expression of fibrosis-related marker genes in the muscle of Fst KO mice, compared with their littermate controls (n = 3 mice per group). Source data are provided as a Source Data file. The data are shown as the means ± SEM. *p < 0.05, **p < 0.01, and ***p < 0.001 were considered significant as determined using the two-tailed Student t-test. Fst follistatin, f/f flox/flox, and KO knockout.
Fig. 4
Fig. 4. Depletion of CD206+ M2-like MΦ reduces TGF-β signaling and improves muscle recovery.
a Representative images of paraffin sections of muscle from Tg mice and their littermate control WT mice following acute injury (7 dpi). Scale bar, 200 μm, 20×. Quantification of TGF-β1+, and p27+cells/field is given in right panel (n = 5 mice per group). b Histological sections of gastrocnemius muscle from CD206+ M2-like MΦ-derived TGF-β1 KO and TGF-β1f/f mice, harvested at 7 dpi, stained with H&E (upper) or WGA and DAPI (lower) (n = 4 mice per group). Scale bar, 200 μm (H&E) and 100 μm (WGA). c Quantification of CN myofibers of the gastrocnemius muscle (n = 4 mice per group). d Relative mRNA expression of myogenesis-related marker genes in the muscle of TGF-β1 KO mice compared to TGF-β1f/f littermate control mice (n = 6 mice per group). e Relative mRNA expression of activated FAP-related marker genes in FACS-isolated FAPs of TGF-β1 KO mice compared to TGF-β1f/f littermate control mice (n = 3 mice per group). f Representative images of sirius red-stained sections of TA from tamoxifen-treated TGF-β1 KO mice compared to tamoxifen-treated TGF-β1f/f control mice. Quantification is given in right panel (n = 3 mice per group). Scale bars, 200 μm. Fibrotic area (red) was analyzed by ImageJ software. Data are representative of at least two independent experiments. g Relative mRNA expression of fibrosis-related marker genes in the muscle of TGF-β1 KO mice, compared with their littermate TGF-β1f/f control mice (n = 3 mice per group). The data are shown as the means ± SEM. *p < 0.05, and **p < 0.01 were considered significant as determined using the two-tailed Student t-test. Source data are provided as a Source Data file. CN centrally nucleated, and TGF-β transforming growth factor-beta.
Fig. 5
Fig. 5. Impact of TGF-β signaling on C2C12 myoblast differentiation.
a Relative mRNA expression levels of myogenesis-related marker genes in C2C12 myoblast co-cultured with M2-induced BMDM treated with recombinant TGF-β1 and TGF-β receptor I/II inhibitor (Ly21) (n = 4 wells per group). Data are shown as the means ± SEM. Statistical significance was determined by one-way ANOVA followed by Tukey’s post hoc tests. *p < 0.05 was considered as significant. b Relative mRNA expression levels of myogenesis-related marker genes. M2-induced BMDM inhibitory effect on primary myoblast differentiation was released by the depletion of CD206+ M2-like MΦ upon diphtheria toxin (DT) treatment to the BMDM obtained from Tg mice (n = 3 wells per group). Data are shown as the means ± SEM. Statistical significance was determined by one-way ANOVA followed by Tukey’s post hoc tests. *p < 0.05, and **p < 0.01 were considered as significant. c Representative images of primary myoblast co-cultured with M2-induced BMDM with or without DT, stained with anti-MyoG antibody (n = 3 wells per group). d Representative images of C2C12 myoblast co-cultured with M2-induced BMDM (obtained from uninjured Tg mice) with or without DT, stained with embryonic myosin heavy chain (eMyH3) antibody, and DAPI (n = 4 wells per group). The images were taken using Keyence microscope. Scale bar 200 μm. e, f Relative myotube area and fusion index were quantified (n = 4 wells per group). Data are expressed as mean ± SEM. Statistical significance for e was determined by one-way ANOVA followed by Tukey’s post hoc tests, and for f was determined using the two-tailed Student t-test (*p < 0.05, and ns non-significant). AU arbitrary units, Con control, BMDM bone marrow-derived macrophages, and Ly21 Ly2109761 (TGF-β receptor I/II inhibitor).

References

    1. Giordani L, et al. High-dimensional single-cell cartography reveals novel skeletal muscle-resident cell populations. Mol. Cell. 2019;74:609–621.e606. doi: 10.1016/j.molcel.2019.02.026. - DOI - PubMed
    1. Joe AW, et al. Muscle injury activates resident fibro/adipogenic progenitors that facilitate myogenesis. Nat. Cell Biol. 2010;12:153–163. doi: 10.1038/ncb2015. - DOI - PMC - PubMed
    1. Uezumi A, et al. Fibrosis and adipogenesis originate from a common mesenchymal progenitor in skeletal muscle. J. Cell Sci. 2011;124:3654–3664. doi: 10.1242/jcs.086629. - DOI - PubMed
    1. Uezumi A, Fukada S, Yamamoto N, Takeda S, Tsuchida K. Mesenchymal progenitors distinct from satellite cells contribute to ectopic fat cell formation in skeletal muscle. Nat. Cell Biol. 2010;12:143–152. doi: 10.1038/ncb2014. - DOI - PubMed
    1. Wosczyna MN, et al. Mesenchymal stromal cells are required for regeneration and homeostatic maintenance of skeletal muscle. Cell Rep. 2019;27:2029–2035.e2025. doi: 10.1016/j.celrep.2019.04.074. - DOI - PMC - PubMed

Publication types