. 2022 Nov 21;13(1):7124.
doi: 10.1038/s41467-022-34653-3.

Regulome analysis in B-acute lymphoblastic leukemia exposes Core Binding Factor addiction as a therapeutic vulnerability

Affiliations

Regulome analysis in B-acute lymphoblastic leukemia exposes Core Binding Factor addiction as a therapeutic vulnerability

Jason P Wray et al. Nat Commun. .

Abstract

The ETV6-RUNX1 onco-fusion arises in utero, initiating a clinically silent pre-leukemic state associated with the development of pediatric B-acute lymphoblastic leukemia (B-ALL). We characterize the ETV6-RUNX1 regulome by integrating chromatin immunoprecipitation- and RNA-sequencing and show that ETV6-RUNX1 functions primarily through competition for RUNX1 binding sites and transcriptional repression. In pre-leukemia, this results in ETV6-RUNX1 antagonization of cell cycle regulation by RUNX1 as evidenced by mass cytometry analysis of B-lineage cells derived from ETV6-RUNX1 knock-in human pluripotent stem cells. In frank leukemia, knockdown of RUNX1 or its co-factor CBFβ results in cell death suggesting sustained requirement for RUNX1 activity which is recapitulated by chemical perturbation using an allosteric CBFβ-inhibitor. Strikingly, we show that RUNX1 addiction extends to other genetic subtypes of pediatric B-ALL and also adult disease. Importantly, inhibition of RUNX1 activity spares normal hematopoiesis. Our results suggest that chemical intervention in the RUNX1 program may provide a therapeutic opportunity in ALL.


Conflict of interest statement

The authors declare no competing interests

Figures
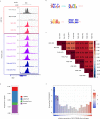
Fig. 1
Fig. 1. Delineating the ETV6-RUNX1 regulome in childhood B-ALL.
a Integrative Genomics Viewer (IGV) screenshot of ETV6-RUNX1 binding at the IER2 locus in an ETV6-RUNX1+ cell line (Reh, upper panel, red dashed line) or patient-derived ETV6-RUNX1+ leukemia samples (bottom panel, blue dashed line). HPA and PAS, two independent ETV6 antibodies; DNaseI, DNaseI hypersensitivity sequencing; control, signal following immunoprecipitation with an IgG antibody. b MEME enrichment of motifs in sites bound by ETV6-RUNX1. c Correlation matrix for normalized signal across all ETV6-RUNX1 binding sites. d Distribution of peaks relative to their nearest genes (see methods for analysis). e ETV6-RUNX1 binding across genes binned according to relative expression in ETV6-RUNX1+ B-ALL as compared to all other subtypes. lfc: log2 Fold Change. One-way Fisher’s exact test revealed significant overrepresentation of ETV6-RUNX1-bound genes in the indicated groups, Benjamini & Hochberg correction for multiple testing applied, only adjusted p values < 0.05 are shown (e). Source data are provided as a Source Data file.
Fig. 2
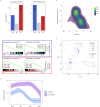
Fig. 2. ETV6-RUNX1 induces transcriptional changes indicative of cell cycle repression in pre-leukemia.
a Bar plot showing percentage of genes associated with an ETV6-RUNX1 binding event for genes significantly up- or down (dn)-regulated or not significant (ns, p > 0.05) upon ETV6-RUNX1 knockdown in Reh or ETV6-RUNX1 expression in proB cells derived from IPSCs. b Dotplot with density contours showing log fold change for ETV6-RUNX1 vs wild-type iPSC-derived proB cells and ETV6-RUNX1 knockdown in Reh. Genes displayed have padj < 0.1 in both datasets. c GSEA for ranked gene lists from ETV6-RUNX1 vs wild-type iPSC-derived proB cells and ETV6-RUNX1 knockdown in Reh. d Principal component analysis using label-retaining cell (LRC) signature genes for wild-type and ETV6-RUNX1 expressing iPSC-derived cell populations. e Plot showing normalized gene expression (mean ± 95% confidence intervals) in wild-type and ETV6-RUNX1 expressing iPSC-derived cell populations for label-retaining cell leading edge genes derived from GSEA (see Supplementary Fig. 2i). One-way Fisher’s exact test revealed significant overrepresentation of ETV6-RUNX1-bound genes in the indicated groups, Benjamini & Hochberg correction for multiple testing applied, only adjusted p values < 0.05 are shown (a). Source data are provided as a Source Data file.
Fig. 3
Fig. 3. Mass cytometry reveals an accumulation of ETV6-RUNX1 expressing progenitor cells in S phase.
a Dotplots of UMAP dimensionality reduction for cell surface markers CD45, CD45RA, CD34, and CD19 in IPSC B-cell differentiations, 10,000 cells each of wild-type and ETV6-RUNX1 knockin are displayed. b Heatmap showing median scaled expression of the indicated markers in manually annotated annotated clusters. See also Supplementary Fig. 3a. c Barplot showing proportion of cells in each population annotated in (a) for parental (MIFF3, 195473 cells), ETV6-RUNX1 knock-in (ER2.1, 415891 cells; ER2.8, 379947 cells) and reverted (D5, 64072 cells) cell lines. d Dotplot for UMAP dimensionality reduction based on cell cycle markers pRb, IdU, CycB1 and pHisH3. Colors represent manually annotated SOM clusters, assigning cells to a cell cycle phase. e Heatmap showing median scaled expression of the indicated markers in the indicated clusters. See also Supplementary Fig. 3b. f Barplots showing proportion of cells in each phase of the cell cycle for each of the cell populations indicated in (a). g Heatmap of Pearson’s Chi-squared standardized residuals showing the relative contribution of the cell cycle phases to the Chi-squared calculation for each population in (f). Pearson’s Chi-squared test revealed that the distribution of cells across populations differed significantly between ETV6-RUNX1 (ER2.1/ER2.8) and wild-type (MIFF3/D5) (Chi-squared = 177910, df = 4, p value < 2.2e−16) (c). Pearson’s Chi-squared test revealed that the distribution of cells across cell cycle phases differed significantly between ETV6-RUNX1 (ER2.1/ER2.8) and wild-type (MIFF3/D5) in each of the populations (CD45: Chi-squared = 10707, df = 4, p value < 2.2e−16; CD45RA: Chi-squared = 700.4, df = 4, p value < 2.2e−16; HSPC: Chi-squared = 68112, df = 4, p value < 2.2e−16; CD19lo: Chi-squared = 14807, df = 4, p value < 2.2e−16; PreB: Chi-squared = 98.129, df = 4, p value < 2.2e−16) (f). Source data are provided as a Source Data file.
Fig. 4
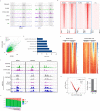
Fig. 4. ETV6-RUNX1 binds DNA through the Runt domain, competing with native RUNX1.
a Integrative Genomics Viewer (IGV) screenshots of RUNX1 and ETV6-RUNX1 binding and DNase1 hypersensitivity (DNaseHS) in NALM-6 at the RUNX1 and SPI1 loci. R139G: loss-of-function point mutation in the Runt domain of ETV6-RUNX1. ΔHLH: deletion of helix-loop-helix pointed domain of ETV6-RUNX1. CTL: V5 ChIP in NALM-6 lacking V5-tagged protein. b Heatmaps showing ChIP-seq signal across all identified RUNX1/ETV6-RUNX1 binding sites in a 3 kb window centered on peak summits. c Dotplot of CPM for RUNX1 vs ETV6-RUNX1 ChIP. Colors show peaks classified as more highly bound by RUNX1 (R1), ETV6-RUNX1 (ER) or similarly bound by both (R1_ER). d Bar plot showing enrichment of GO-terms relating to cell cycle in genes mapped to R1_ER peaks as classified in (c). e Heatmaps showing ChIP-seq signal across all identified RUNX1/ETV6-RUNX1 binding sites in a 3kb window centered on peak summits for FLAG-RUNX1b IP in the presence of competing ETV6-RUNX1 or R139G (left) or V5-ETV6-RUNX1 IP in the presence of competing RUNX1b or Vector control. f IGV screenshots of RUNX1 and ETV6-RUNX1 binding and H3K27ac signal in NALM-6 expressing ETV6-RUNX1 or R139G for three of the most highly differential sites for H3K27ac. g Volcano plot showing H3K27ac differences, as determined by Wald test implemented in DiffBind, comparing ETV6-RUNX1 expressing NALM-6 to R139G controls across RUNX1 and ETV6-RUNX1 binding sites. Barplot shows number of significantly up- and down-regulated peaks. h Proportion of peaks classified as R1, ER or R1_ER (as in (c)) ranked from the most significantly down-regulated to the most significantly up-regulated and divided into 11 bins with equal numbers of peaks. Source data are provided as a Source Data file.
Fig. 5
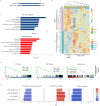
Fig. 5. Defining a core RUNX1 program in B-ALL reveals antagonism between ETV6-RUNX1 and native RUNX1 in cell cycle regulation.
a Schematic showing shRNAs targeting RUNX1 and/or ETV6-RUNX1. b Heatmap showing relative expression of the 25 most significantly up- or down-regulated genes following RUNX1 knockdown across five B-ALL cell lines. c Bar plots showing significantly enriched GO-terms in the “core” up- or downregulated genes. d Plots of GSEA results for the indicated gene sets against a list of genes ranked from the most significantly up- to the most significantly down-regulated following RUNX1 knockdown. e Bar plot showing normalized enrichment scores (NES) for GSEA analysis of the indicated gene sets against ranked lists from ETV6-RUNX1 knock-in iPSC-derived proB cells, ETV6-RUNX1 knockdown and RUNX1 knockdown. * padj < 0.05. Source data are provided as a Source Data file.
Fig. 6
Fig. 6. A balance between CBF complex and ETV6-RUNX1 on the P53-regulated cell cycle-apoptosis axis promotes a silent pre-leukemic state.
a, b Comparison of RUNX1 and ETV6-RUNX1 regulomes to cell cycle meta-analysis. Genes (n = 19148) were binned according to the number of data sets in which they were defined as cell cycle genes. Bar plot shows the percentage of genes associated with a RUNX1 binding event (a) while boxplots show log fold change following RUNX1 or ETV6-RUNX1 knockdown or in ETV6-RUNX1 knock-in iPSC-derived proB cells (b). c Plot of mean log fold change for genes binned according to their p53 score for ETV6-RUNX1-expressing ProB cells, ETV6-RUNX1 knockdown, RUNX1 knockdown, and CBFi (AI-14-91) treatment. Negative p53 scores are associated with cell cycle genes while positive scores are associated with direct p53 targets involved in apoptosis and DNA damage (DD) response. Data are mean ± 90% confidence intervals. d Boxplot of log fold change for genes (n = 18831) grouped into cell cycle (p53 score ≤ −17), apoptosis/DNA damage (DD) (p53 score ≥ 17) or control (−17 < p53 score < 17) for ETV6-RUNX1-expressing ProB cells, ETV6-RUNX1 knockdown, and RUNX1 knockdown. One-way Fisher’s exact test revealed significant overrepresentation of RUNX1-bound genes in the indicated groups, Benjamini & Hochberg correction for multiple testing applied (a). Boxplots display median, inter-quartile range (box), minima and maxima (whiskers). Two-way, unpaired t-test revealed significant differences in Log Fold Change distribution as compared to control group, ns not significant, ****p < 0.0001, ***p < 0.001, **p < 0.01, *p < 0.05, unpaired t-test (b, d). Source data are provided as a Source Data file.
Fig. 7
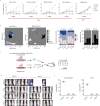
Fig. 7. B-ALL cell lines and primary patient cells are dependent on RUNX1 activity for survival in vitro and in vivo.
a Growth curves for the indicated cell lines over 9 days following transduction with shRNAs targeting RUNX1 or a non-targeting control; n=2 biologically independent samples. b Mass cytometry analysis for the indicated cell lines following transduction with shRNAs targeting RUNX1 (runt: t(12;21): 18259 cells, t(5;21): 823659 cells; 3′UTR: t(12;21): 20802 cells, t(5;21): 582483 cells) or a non-targeting control (t(12;21): 12777 cells, t(5;21): 1084188 cells). UMAP projections based on cell cycle and viability/apoptosis markers. Colors represent manually annotated SOM clusters. Bar plots show proportion of live cells in the indicated cell cycle phases and the proportion of dead/apoptotic cells. c Schematic of competitive engraftment experiments. NALM-6 cells transduced with shRNAs (GFP+) and stably expressing a luciferase/RFP reporter were mixed 1:1 with non-transduced (GFP) cells and injected into NSG mice. Mice were imaged weekly for luciferase activity and culled for end-point analysis (4 weeks) of leukemic engraftment. d Bioluminescence imaging at 2 and 4 weeks (end point) after injection of samples transduced with shRNAs targeting RUNX1 or control shRNA (see c). e Plots showing end point analysis of leukemic engraftment of two patient samples with indicated cytogenetics transduced with non-targeting or RUNX1-shRNAs. Human (CD19+), gated on human CD45+ cells, were assessed for the proportion of shRNA-transduced (GFP+) vs wild-type GFP- cells (Supplementary Fig. 7c). Data presented as mean ± SD, n = 3 biologically independent samples. Two-sided, 5-sample test for given proportions revealed that cell cycle distribution in RUNX1 knock-down samples differed significantly from control in t(12;21) (runt: Chi-squared = 2165.9, df = 5, p < 2.2e−16; 3′UTR: Chi-squared = 1699.1, df = 5, p < 2.2e−16) and t(5;21) (runt: Chi-squared = 3037.9, df = 5, p < 2.2e−16; 3’UTR: Chi-squared = 67,642, df = 5, p < 2.2e−16) (b). Two-tailed, unpaired t-test revealed a significant reduction in engraftment following RUNX1 knock-down, ****p < 0.0001, ***p < 0.001 (e). Source data are provided as a Source Data file.
Fig. 8
Fig. 8. An allosteric CBF-inhibitor mimics RUNX1 depletion suggesting a targeted treatment for B-ALL.
a Growth curves for the indicated cell lines following transduction with CBFb- or non-targeting shRNA. Data presented as mean ± SD, n = 3 biologically independent samples. b Ventral and dorsal bioluminescence, at weeks 2 and 4 (end point), of mice engrafted with shGFP+Luc+ and competitor GFPLuc NALM-6 cells. Control: non-targeting shRNA; CBFb - CBFb-targeting shRNA. c Endpoint analysis of competitive engraftment (% GFP+ within human CD45+CD19+) of indicated patient samples transduced with CBFb- or non-targeting shRNA. Data presented as mean ± SD, n = 3 biologically independent samples. d Heatmap and average profiles of ChIP-seq signal across RUNX1 and ETV6-RUNX1 binding sites in a 3 kb window centered on peak summits from control (DMSO) or CBFi (AI-14-91) treated Reh following immunoprecipitation with RUNX1, ETV6 or control (IgG) antibodies. GSEA plots for indicated Hallmark gene sets (e) and label-retaining cell (LRC) signature (f) against genes ranked from most significantly up- to most significantly down-regulated following CBFb knockdown. g Heatmap showing cell death (relative Celltox Green) in response to increasing concentrations of AI-14-91 (CBFi) in the indicated cell lines after 72 h. h Mass cytometry analysis for B-ALL cell lines, t(12;21) (control: 72782 cells, CBFi: 71610 cells), t(1;19) (control: 292097 cells, CBFi: 143778 cells) and t(4;11) (control: 192338 cells, CBFi: 274718 cells) treated with 15uM CBFi (AI-14-91) or DMSO (control) for 48 h. UMAP projections based on cell cycle and viability/apoptosis markers, colors represent manually annotated SOM clusters. Barplots show proportion of live cells in the indicated cell cycle phases and the proportion of dead/apoptotic cells. Two-tailed, unpaired t-test revealed a significant reduction in engraftment following CBFb knock-down, ****p < 0.0001 (c). Two sided, 5-sample test for given proportions revealed that cell cycle distribution in AI-14-91 samples differed significantly from control in t(12;21) (Chi-squared = 29551, df = 5, p < 2.2e−16), t(1;19) (Chi-squared = 142822, df = 5, p < 2.2e−16), and t(4;11) (Chi-squared = 99804, df = 5, p < 2.2e−16) (h). Source data are provided as a Source Data file.

References

    1. Hunger SP, Mullighan CG. Acute lymphoblastic leukemia in children. N. Engl. J. Med. 2015;373:1541–1552. doi: 10.1056/NEJMra1400972. - DOI - PubMed
    1. Greenbaum U, et al. Chimeric antigen receptor T-cell therapy toxicities. Br. J. Clin. Pharmacol. 2021;87:2414–2424. doi: 10.1111/bcp.14403. - DOI - PubMed
    1. Greaves M. A causal mechanism for childhood acute lymphoblastic leukaemia. Nat. Rev. Cancer. 2018;18:471–484. doi: 10.1038/s41568-018-0015-6. - DOI - PMC - PubMed
    1. Greaves MF, Wiemels J. Origins of chromosome translocations in childhood leukaemia. Nat. Rev. Cancer. 2003;3:639–649. doi: 10.1038/nrc1164. - DOI - PubMed
    1. Schäfer D, et al. Five percent of healthy newborns have an ETV6-RUNX1 fusion as revealed by DNA-based GIPFEL screening. Blood. 2018;131:821–826. doi: 10.1182/blood-2017-09-808402. - DOI - PMC - PubMed

Publication types

Substances