. 2022 Nov 21;13(1):7024.
doi: 10.1038/s41467-022-34422-2.

Multi-omics signatures of the human early life exposome

Affiliations

Multi-omics signatures of the human early life exposome

Léa Maitre et al. Nat Commun. .

Abstract

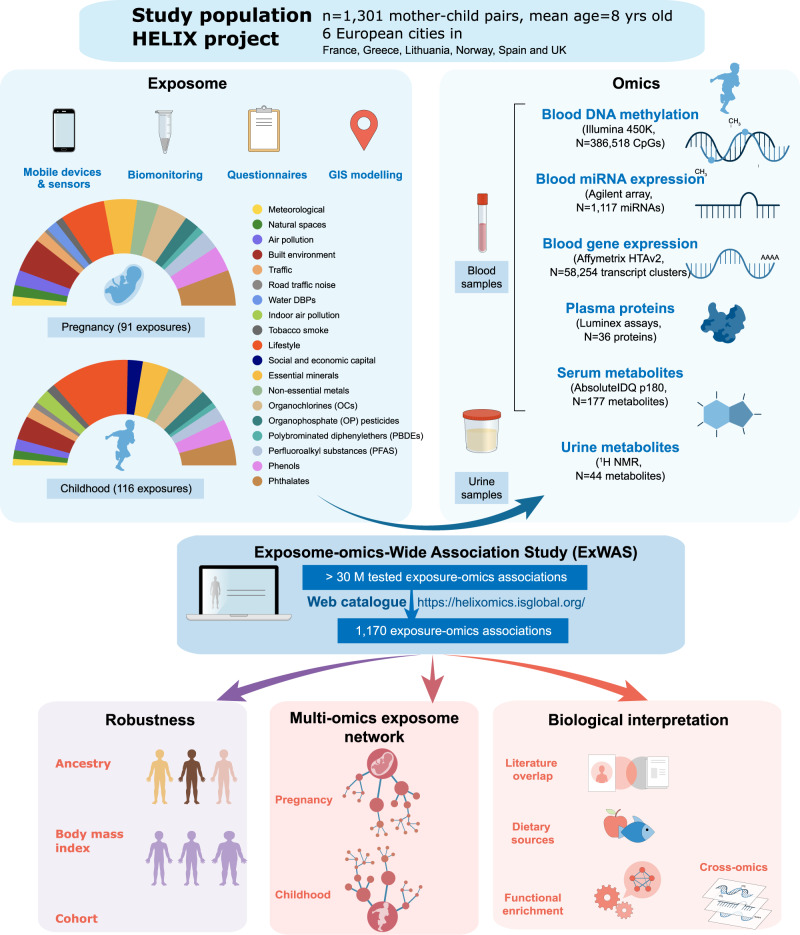
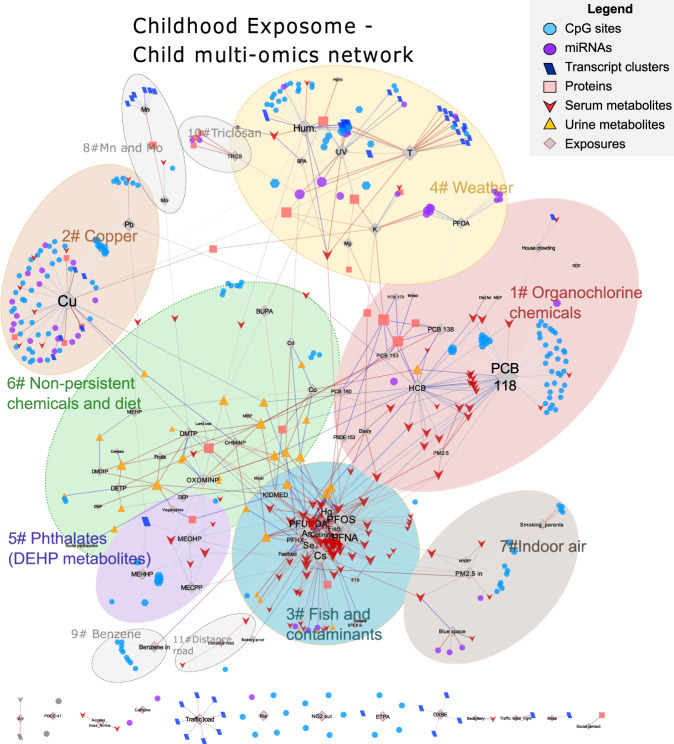
Environmental exposures during early life play a critical role in life-course health, yet the molecular phenotypes underlying environmental effects on health are poorly understood. In the Human Early Life Exposome (HELIX) project, a multi-centre cohort of 1301 mother-child pairs, we associate individual exposomes consisting of >100 chemical, outdoor, social and lifestyle exposures assessed in pregnancy and childhood, with multi-omics profiles (methylome, transcriptome, proteins and metabolites) in childhood. We identify 1170 associations, 249 in pregnancy and 921 in childhood, which reveal potential biological responses and sources of exposure. Pregnancy exposures, including maternal smoking, cadmium and molybdenum, are predominantly associated with child DNA methylation changes. In contrast, childhood exposures are associated with features across all omics layers, most frequently the serum metabolome, revealing signatures for diet, toxic chemical compounds, essential trace elements, and weather conditions, among others. Our comprehensive and unique resource of all associations ( https://helixomics.isglobal.org/ ) will serve to guide future investigation into the biological imprints of the early life exposome.


Conflict of interest statement

The authors declare no competing interests.

Figures

Fig. 1
Fig. 1. An overview of the early-life exposome and multi-omics signature study.
One thousand three hundred and one mother–child pairs from the HELIX project participated in the study. The early-life exposome was assessed in pregnancy and childhood through the use of different methods. The pie charts represent the proportion of exposures assessed per exposure family. Molecular traits in the child were measured using six different omics platforms using blood (blood cells, serum or plasma) or urine. Then, an Exposome-omics-Wide Association Study (ExWAS) was conducted, modelling exposure-omics one by one and adjusting for confounders. All summarized results can be found in https://helixomics.isglobal.org/. In all, 1170 exposure–omics associations passed multiple testing correction threshold. After checking the robustness of these associations to ancestry, BMI and cohort, they were visualized through multi-omics exposure networks. Finally, we did biological interpretation including overlap with the literature, identification of dietary sources, functional enrichment analyses and cross-biological matrix and cross-omics comparisons.
Fig. 2
Fig. 2. Results of the Exposome-omics-Wide Association Study (ExWAS) for the pregnancy and childhood exposomes.
A Summary of the associations between the pregnancy exposome and multi-omics measured in 1301 children: Miami plot (1); pie charts showing the proportion of associations with the different molecular layers (2); and top 10 pregnancy exposures (3). B Summary of the childhood exposome-child omics associations: Miami plot (1); pie charts showing the proportion of associations with the different molecular layers (2); and top 10 childhood exposures (3). In Miami plots, each point corresponds to an exposure-omics association; the y-axes show the −log10 p values multiplied by the direction of the association (sign of the regression coefficient); and the x-axis groups exposures along the 19 exposure families and each vertical line represents a separate exposure with some jitter added to avoid overlapping points. In the Manhattan (dots), pie-chart and histogram, colours indicate the molecular layer.
Fig. 3
Fig. 3. Robustness of main exposome-omics associations.
Comparison of effect sizes of the 1170 exposome-omics associations of the main model, that includes all children (N = 1301) and is adjusted for child’s zBMI and ancestry, vs. effect sizes of alternative models. Each triangle represents an association. The x-axis represents the effect size of the exposure on the omics feature in the main model, while the y-axis represents the effect size in the alternative model. The percentage change in effect size between models is calculated as indicated in the Supplementary Information. A Alternative model included all covariates but was restricted to European ancestry children (N = 1171). No major differences were observed. B Alternative model included all children and was unadjusted for child’s zBMI. Exposure-omics associations with a percent change between models above 100% are coloured in red, and include proteins and child lipophilic chemical pollutants, as listed in the table. C Forest-plots showing the fixed- and random-effects inverse variance weighted meta-analyses of illustrative exposure–omics associations: maternal Cd levels and child DNA methylation at CpG cg19089201 (MYO1G gene) (n = 1173), with consistent effects across cohorts; child Cu levels and child CRP levels in plasma (n = 1170), with consistent effects across cohorts; maternal Mo levels and child DNA methylation at CpG cg08379738 (DENND1C gene) (n = 1173), driven by one of the cohorts (BiB); humidity in childhood (1 month before sampling) and child serum serotonin levels (n = 1198), driven by one of the cohorts (MoBA). Each cohort is represented by a point estimate, bounded by the 95% confidence interval (CI) for the effect and the cohort weight as a grey square. The 95% CI from the fixed and random effects meta-analysis are shown as diamonds. The effect size is reported as a log2 fold change (log2FC) of the omics, or difference in methylation levels, for interquartile range (IQR) of continuous exposure variables.
Fig. 4
Fig. 4. Network map of the multi-omics signatures of the pregnancy exposome.
Network visualization of the pregnancy exposome-omics-wide association study (ExWAS). An exposure and a molecular feature were connected if their association was statistically significant (blue if positively and red if negatively). Only connected components with at least two molecular features were displayed. Nodes of the network are depicted with a different colour/shape depending if they are exposures or features of a particular molecular layer (see legend in the figure). Three main connected components were annotated, which varied greatly by their size, their number of exposures and the type of omics composing them. The summary table with the cluster characteristics are in Table 1 and a full table with the node attributes can be found in Supplementary Data 5A.
Fig. 5
Fig. 5. Network map of the multi-omics signatures of the childhood exposome.
Network visualization of the childhood Exposome-omics-Wide Association Study (ExWAS). Nodes of the network are depicted with a different colour/shape depending if they are exposures or features of a particular molecular layer (see legend in the figure). An exposure and a molecular feature were connected with an edge if their association was statistically significant (blue if positively and red if negatively). Only connected components with at least two molecular features were displayed. An exposure and a molecular feature were connected if their association was statistically significant, and only connected components with at least two molecular features were displayed. The childhood exposome network was diverse in terms of omics features represented and the level of interconnection, with the biggest connected component containing 90% of all nodes. Within this network, 11 clusters were identified using an unsupervised structural cluster analysis (see Supplementary Information), and were annotated in the figure. The summary table with the cluster characteristics are in Table 1 and the full table with the node attributes can be found in Supplementary Data 5B.
Fig. 6
Fig. 6. Biological interpretation of the exposome-omics associations through literature overlap and functional enrichment.
A Overlap of CpGs associated with the pregnancy exposome (columns) with CpGs associated with traits/exposures in the EWAS catalogue (rows). B Functional enrichment analyses of the pregnancy exposome (columns) for Gene Ontology (GO) terms (rows). C Overlap of CpGs associated with the childhood exposome (columns) with CpGs associated with traits/exposures in the EWAS catalogue (rows). D Functional enrichment analyses of the childhood exposome (columns) for GO terms (rows). Exposure variables, traits/exposures of the EWAS catalogue, and GO terms are ordered according to a hierarchical clustering. For the overlap with the EWAS catalogue, colour indicates the number of overlapping CpGs. For the functional enrichment analyses, colour indicates the –log10 adjusted p value of the enrichment. To facilitate visualization, we eliminated related GO terms and –log10 adjusted p values >10 are coded as 10.
Fig. 7
Fig. 7. Metabolite signatures of the childhood exposome and dietary sources.
A Cluster childhood#3 includes the significant associations between fish and several contaminants (As, Hg, PFOS) and serum metabolites (mainly glycerophospholipids). B Cluster childhood#6 includes the significant associations between diet (vegetables, fruit, cereals) and organophosphate (OP) pesticides with urinary metabolites. For A, B, nodes of the network are depicted with a different colour/shape depending if they are exposures or features of a particular molecular layer (see legend in the figure). An exposure and a molecular feature were connected with an edge if their association was statistically significant (blue if positively and red if negatively). C Tripartite plots based on the presence of associations between metabolites-exposure in HELIX samples (on the left) and metabolites-dietary intake based on the ExposomeExplorer database (http://exposome-explorer.iarc.fr/) (on the right). Serum and urinary metabolites are shown in red and yellow, respectively, and exposures in blue (fish and contaminants), red (organochlorine chemicals) or green (non-persistent chemicals and diet) according to the cluster they belong to.

References

    1. Lim SS, et al. A comparative risk assessment of burden of disease and injury attributable to 67 risk factors and risk factor clusters in 21 regions, 1990-2010: a systematic analysis for the Global Burden of Disease Study 2010. Lancet. 2012;380:2224–2260. doi: 10.1016/S0140-6736(12)61766-8. - DOI - PMC - PubMed
    1. Rappaport SM, Smith MT. Epidemiology. Environment and disease risks. Science. 2010;330:460–461. doi: 10.1126/science.1192603. - DOI - PMC - PubMed
    1. Wild CP. Complementing the genome with an ‘exposome’: the outstanding challenge of environmental exposure measurement in molecular epidemiology. Cancer Epidemiol. Biomark. Prev. 2005;14:1847–1850. doi: 10.1158/1055-9965.EPI-05-0456. - DOI - PubMed
    1. Vermeulen R, Schymanski EL, Barabási A-L, Miller GW. The exposome and health: where chemistry meets biology. Science. 2020;367:392 LP–392396. doi: 10.1126/science.aay3164. - DOI - PMC - PubMed
    1. Niedzwiecki MM, et al. The exposome: molecules to populations. Annu. Rev. Pharmacol. Toxicol. 2019;59:107–127. doi: 10.1146/annurev-pharmtox-010818-021315. - DOI - PubMed

Publication types