. 2022 Nov;3(11):1351-1366.
doi: 10.1038/s43018-022-00456-0. Epub 2022 Nov 21.

Radiotherapy in combination with CD47 blockade elicits a macrophage-mediated abscopal effect

Affiliations

Radiotherapy in combination with CD47 blockade elicits a macrophage-mediated abscopal effect

Yoko Nishiga et al. Nat Cancer. 2022 Nov.

Abstract

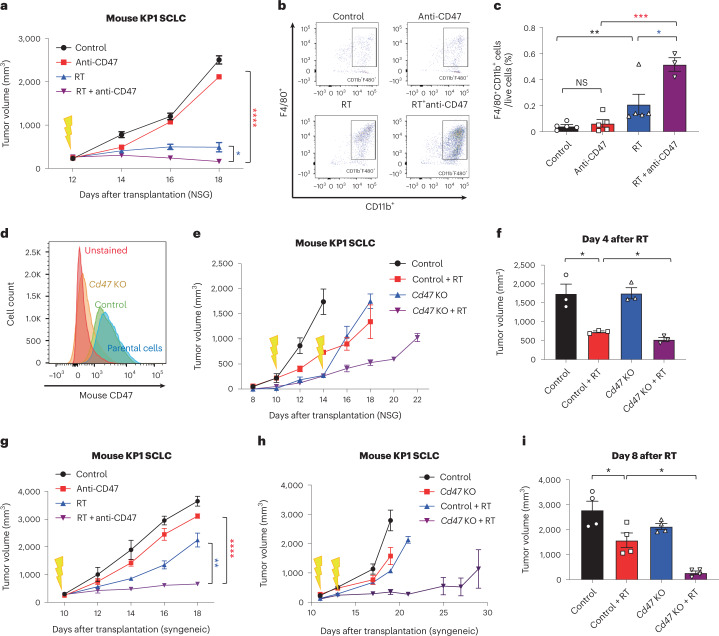
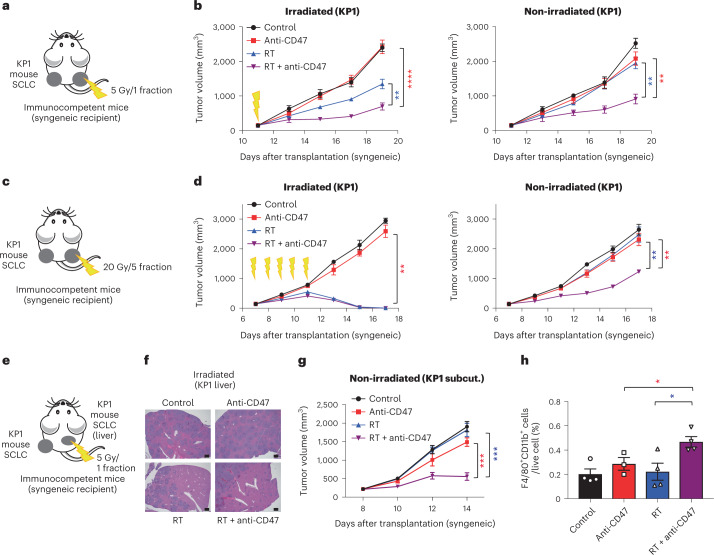
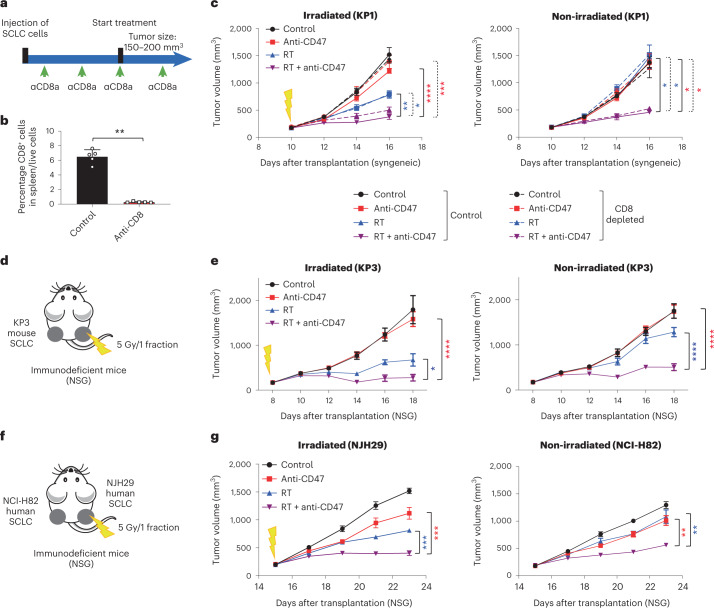
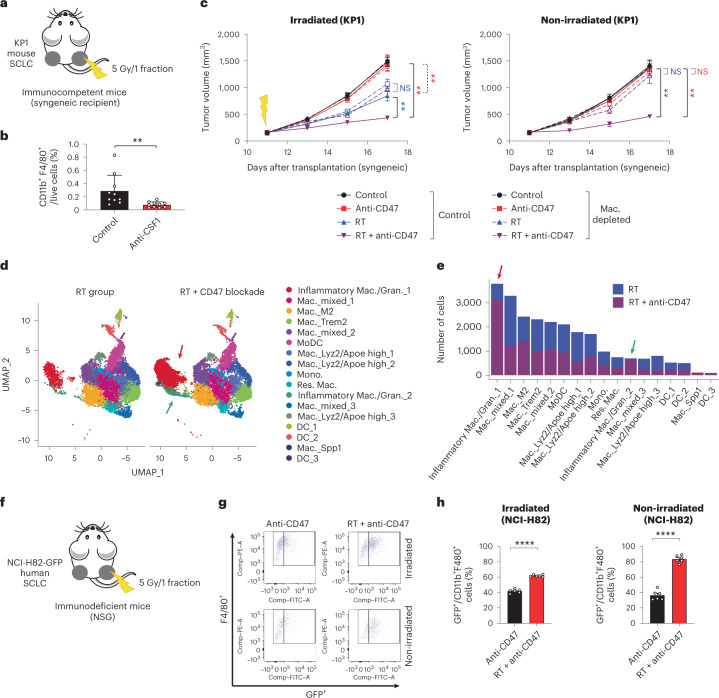
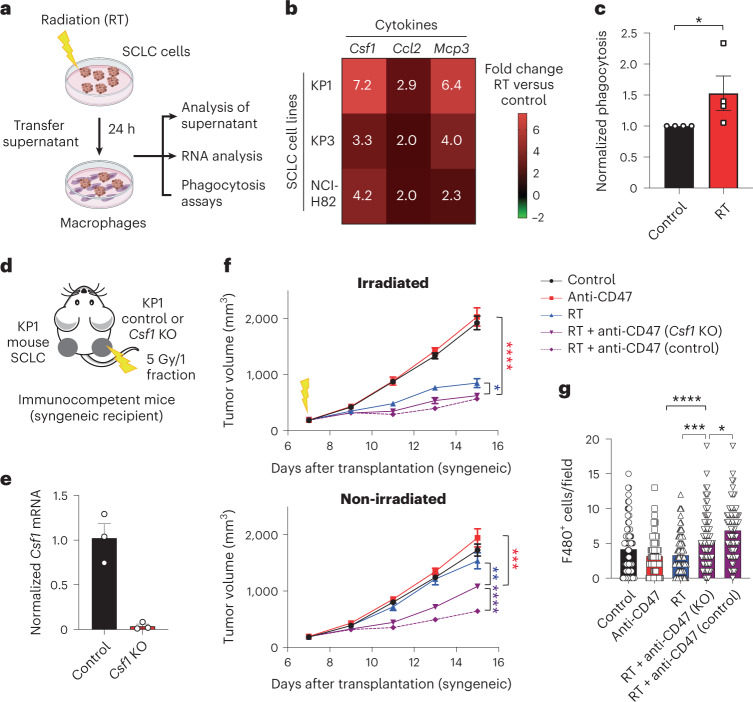
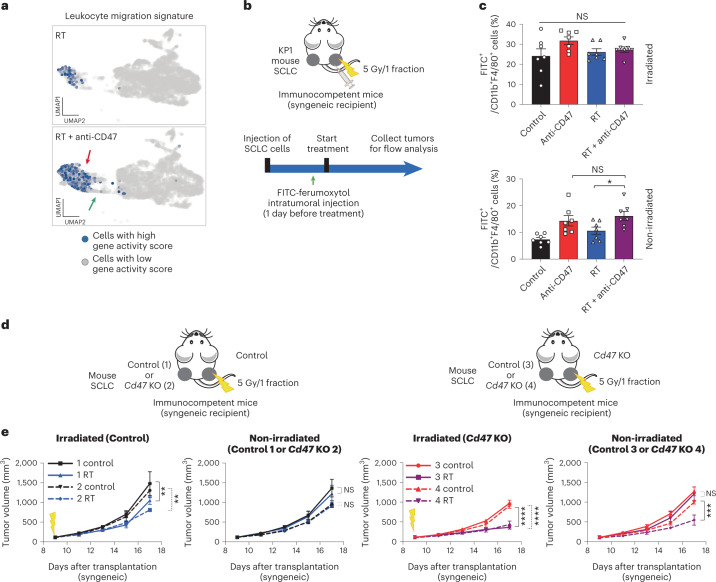
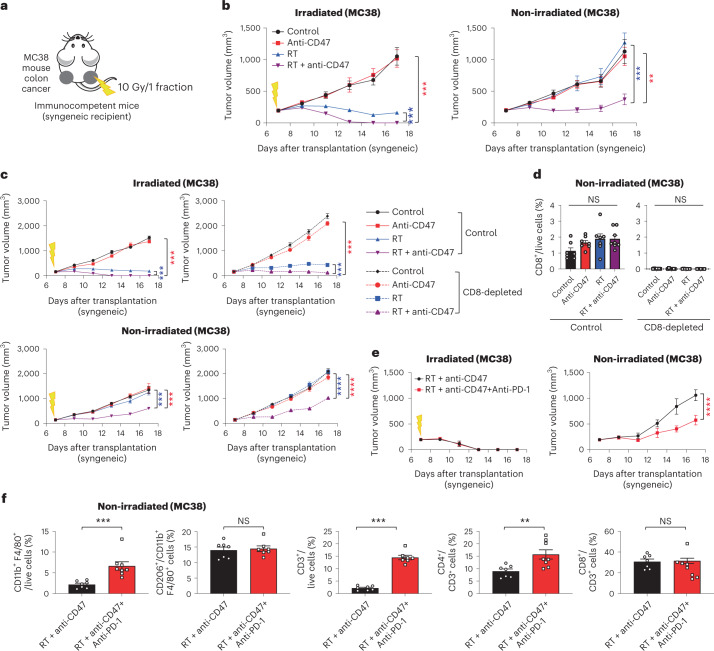
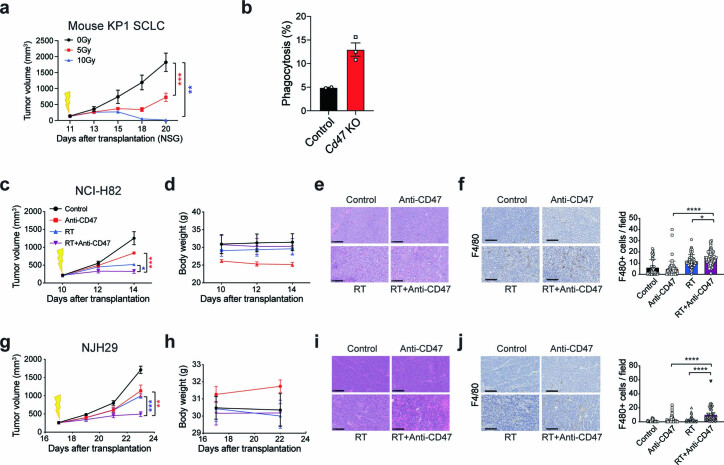
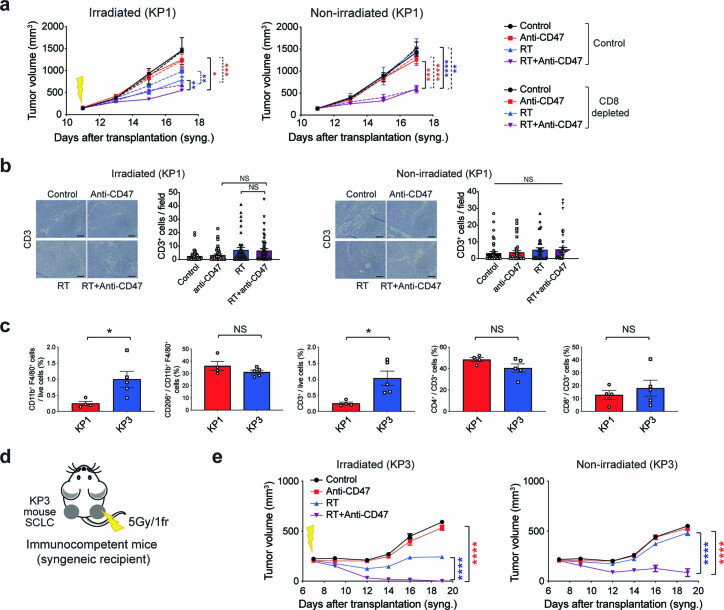
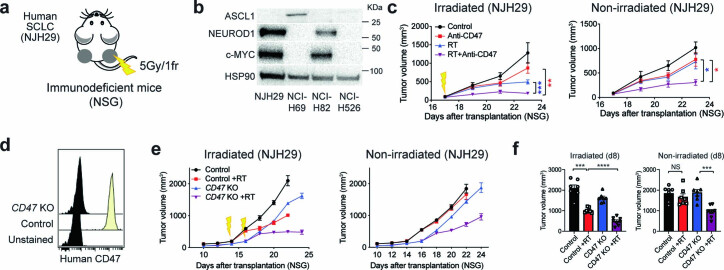
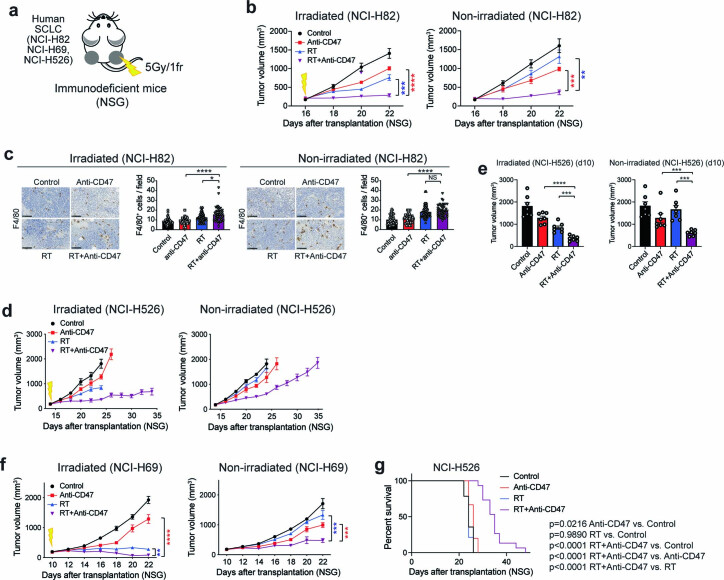
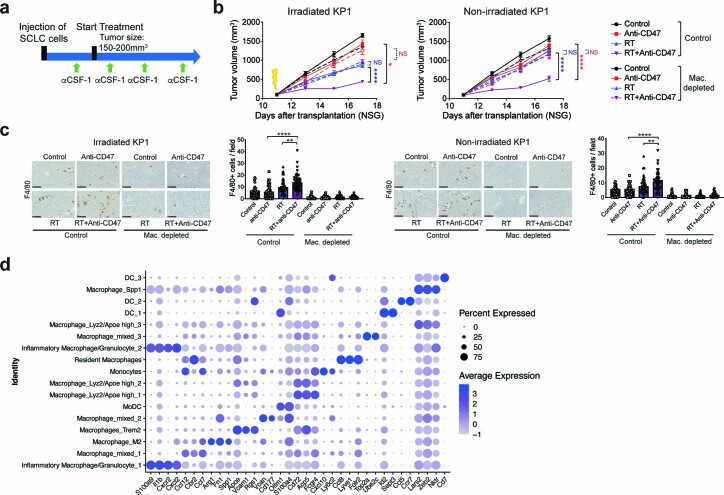
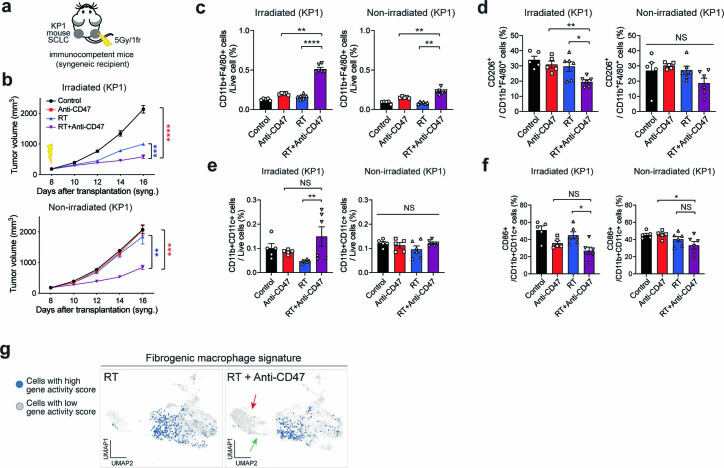
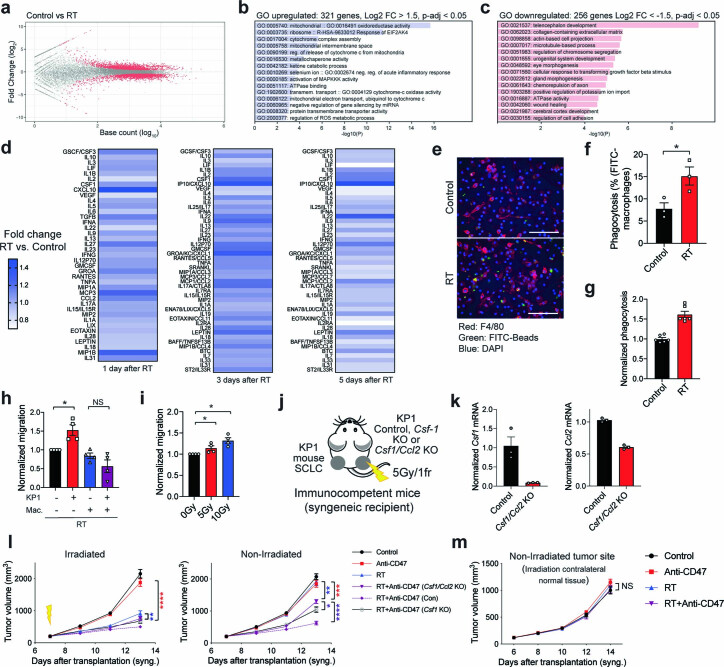
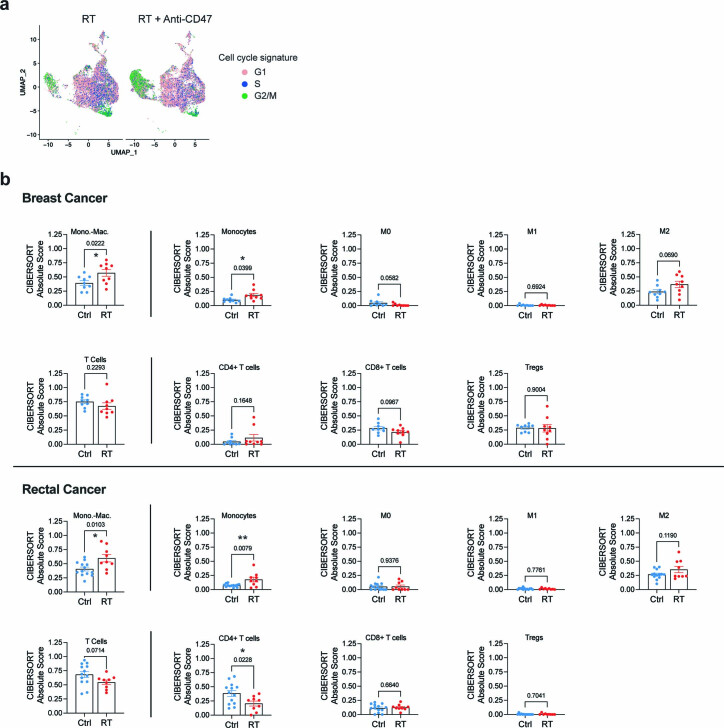
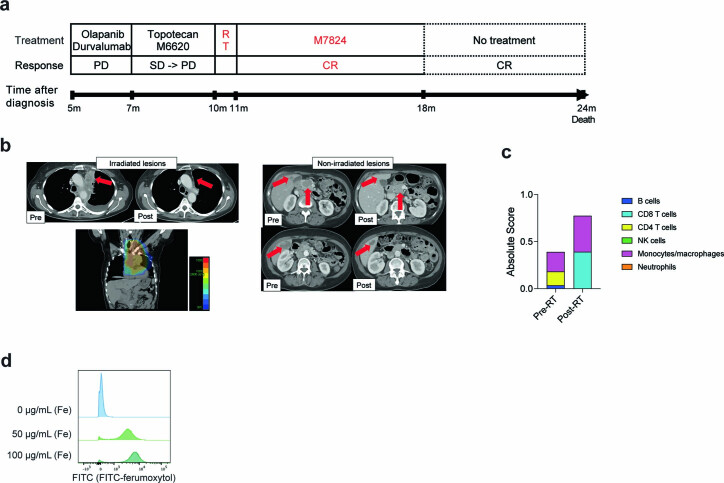
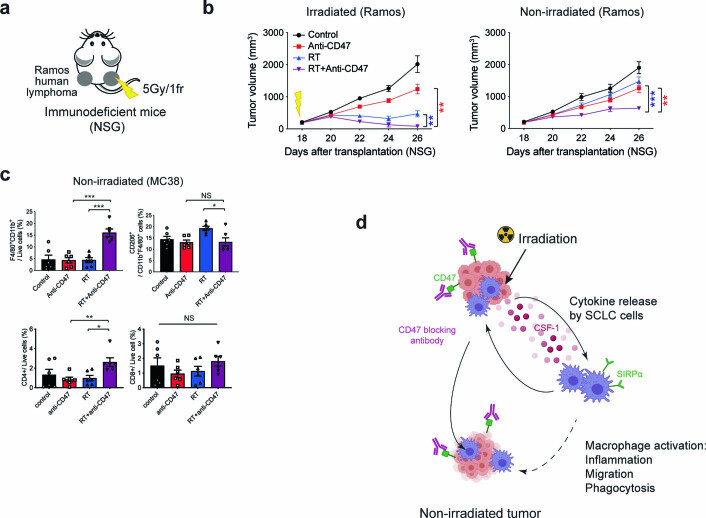
Radiation therapy is a mainstay of cancer treatment but does not always lead to complete tumor regression. Here we combine radiotherapy with blockade of the 'don't-eat-me' cell-surface molecule CD47 in small cell lung cancer (SCLC), a highly metastatic form of lung cancer. CD47 blockade potently enhances the local antitumor effects of radiotherapy in preclinical models of SCLC. Notably, CD47 blockade also stimulates off-target 'abscopal' effects inhibiting non-irradiated SCLC tumors in mice receiving radiation. These abscopal effects are independent of T cells but require macrophages that migrate into non-irradiated tumor sites in response to inflammatory signals produced by radiation and are locally activated by CD47 blockade to phagocytose cancer cells. Similar abscopal antitumor effects were observed in other cancer models treated with radiation and CD47 blockade. The systemic activation of antitumor macrophages following radiotherapy and CD47 blockade may be particularly important in patients with cancer who suffer from metastatic disease.


Conflict of interest statement

J.S. and I.L.W. licensed a patent to Forty Seven/Gilead on the use of CD47-blocking strategies in SCLC. J.S. has equity in and is an advisor for, DISCO Pharmaceuticals. I.L.W. is a director, stockholder and consultant in Forty Seven, a public company that was involved in CD47-based immunotherapy of cancer but was acquired by Gilead. At the time of this submission, I.L.W. has no formal relationship with Gilead. I.L.W. is a co-founder, Director and consultant for Bitterroot Bio, a company working on atherosclerosis from the anti-CD47 angle. I.L.W. is also a co-founder, Director and consultant for PHeast, a company testing new ‘don’t eat me’ signals with more limited cancer type distributions, including CD24. I.L.W. is co-founding 48, a company establishing antibody cocktails to prepare blood-forming stem cell recipients, both autologous and allogeneic, for hematopoietic stem cell engraftment without any radiation or chemotherapy. None of these companies fund the Weissman laboratory. I.L.W. is also on the scientific advisory board of Appia, a CAR-iNK company for cancer therapies. Y.N., E.E.G. and J.S. filed a patent based on these data (PCT/US2021/046548). A.T. reports research funding to the institution from the following entities: EMD Serono Research & Development Institute; AstraZeneca; Tarveda Therapeutics; Immunomedics and Prolynx. The authors declare no other competing interests.

Figures

Fig. 1
Fig. 1. CD47 blockade enhances local tumor inhibition following irradiation of SCLC tumors.
a, Growth curves of KP1 SCLC allografts in immunodeficient NSG mice with the indicated treatments. n = 4 (RT + anti-CD47) or n = 5 (control, anti-CD47 and RT) mice. ****P < 0.0001, *P = 0.0159. b, Tumor-infiltrating macrophages (CD11b+F4/80+) identified by flow cytometry from tumors collected in a. c, Quantification of tumor-infiltrating macrophages from b. Data are representative of n = 2 independent experiments. n = 3 (RT + anti-CD47) or n = 5 (control, anti-CD47 and RT) tumors. **P = 0.0079, *P = 0.0320, ****P = 0.0002. d, CD47 expression for KP1 or KP1 Cd47 knockout cells by flow cytometry. e, Growth curves of KP1 control and Cd47 knockout allografts in NSG mice. f, Quantification of tumor volume 4 d after radiation. n = 1 experiment with n = 3 tumors per condition. *P = 0.0170, *P = 0.0279. g, Growth curves of KP1 SCLC allografts in B6129SF1 immunocompetent recipient mice with the indicated treatments. n = 1 experiment with n = 3 (RT + anti-CD47) or n = 4 (control, anti-CD47 and RT) tumors. h, Growth curves of KP1 control and Cd47 knockout SCLC allografts in immunocompetent syngeneic mice. Tumors were irradiated at two different time points to account for the slower growth of Cd47 knockout cells. i. Quantification of tumor volume 8 d after radiation. n = 1 experiment with n = 4 tumors. *P = 0.0286, *P = 0.0390. Two-tailed Student’s t-tests following two-way analysis of variance (ANOVA) were performed in a (P < 0.0001) and g (P < 0.0001). Two-tailed Student’s t-tests following one-way ANOVA were performed in c (P = 0.001), f (P = 0.0006) and i (P < 0.0001). Error bars represent s.e.m. *P < 0.05, **P < 0.01, ***P < 0.001, ****P < 0.0001. Source data
Fig. 2
Fig. 2. The combination of radiotherapy and CD47 blockade leads to abscopal effects in preclinical mouse models of SCLC.
a, Mouse KP1 SCLC cells were engrafted into both flanks of B6129SF1 immunocompetent syngeneic mice and only right-side tumors were irradiated. b, Growth curves of KP1 SCLC allografts as in a with the indicated treatments (irradiated tumors on left, non-irradiated tumors on right). n = 1 experiment with n = 4 (RT) or n = 5 (control, anti-CD47 and RT + anti-CD47) mice. Irradiated tumors, ****P < 0.0001, **P = 0.0061; non-irradiated tumors, **P = 0.0012, **P = 0.0020. c, Mouse KP1 SCLC cells were engrafted into both flanks of B6129SF1 immunocompetent syngeneic mice. Right-side tumors received 20 Gy in five fractions. d, Growth curves of KP1 SCLC allografts with the indicated treatments in irradiated and non-irradiated control tumors. n = 1 experiment with n = 5 mice (two tumors per mouse). Irradiated tumors, **P = 0.0079; non-irradiated tumors, **P = 0.0079, **P = 0.0079. e, KP1 cells were both intravenously injected and engrafted into the right side of flank of B6129SF1 mice. The cells that were injected intravenously formed liver metastases. Only these liver metastases were irradiated. f, Representative image of liver sections stained with hematoxylin and eosin (H&E). Scale bar, 500 µm. n = 1 experiment with n = 5 mice. g, Growth curves of non-irradiated KP1 SCLC subcutaneous (subcut.) allografts. n = 1 experiment with n = 5 mice. ***P = 0.0003, ***P = 0.0003. h, Quantification of tumor-infiltrating macrophages (CD11b+F4/80+) identified by flow cytometry from subcutaneous non-irradiated tumors collected in e. n = 1 experiment with n = 3 (anti-CD47) or n = 4 (control, RT and RT + anti-CD47) tumors. *P = 0.0440, *P = 0.0251. Two-tailed Student’s t-tests following two-way ANOVA were performed in b (irradiated tumors, P < 0.0001; non-irradiated tumors, P = 0.0003), d (irradiated tumors, P < 0.0001; non-irradiated tumors, P < 0.0001) and g (P < 0.0001). Two-tailed Student’s t-tests following one-way ANOVA were performed in h (P = 0.016). Error bars represent s.e.m. *P < 0.05, **P < 0.01, ***P < 0.001, ****P < 0.0001. Source data
Fig. 3
Fig. 3. The abscopal effects induced by the combination of radiotherapy and CD47 blockade are independent of T cells.
a, Mouse KP1 SCLC cells were engrafted into both flanks of B6129SF1 immunocompetent syngeneic mice and only right-side tumors were irradiated. Schematic of the depletion of CD8+ T cells following anti-CD8 antibody treatment. b, Analysis of splenic T cells by flow cytometry as in c. n = 1 experiment with n = 5 tumors. **P = 0.0079. c, Growth curves of KP1 SCLC allografts with the indicated treatments. n = 1 experiment with n = 5 mice except RT + anti-CD47/control and RT + anti-CD47/CD8 depletion (n = 4 mice). See independent experiment in Extended Data Fig. 2a. Irradiated tumors, ****P < 0.0001; ***P = 0.007, **P = 0.0016, *P = 0.0109; non-irradiated tumors, *P = 0.0159, *P = 0.0159, *P = 0.0159, *P = 0.0159. d, As in a with mouse KP3 cells engrafted into both flanks of NSG immunodeficient mice. e, Growth curves of KP3 allografts as in d with the indicated treatments. n = 1 experiment with n = 6 (control, anti-CD47 and RT) or n = 7 (RT + anti-CD47) tumors. Irradiated tumors, ****P < 0.0001, *P = 0.0229; non-irradiated tumors, ****P < 0.0001. f, As in a with human NCI-H82 and NJH29 SCLC cells were engrafted into NSG immunocompromised mice and only NJH29 tumors were irradiated. g, Growth curves of SCLC xenografts as in f with the indicated treatments. n = 1 experiment with n = 5 mice. Irradiated tumors, ***P = 0.0002, ***P = 0.0001; non-irradiated tumors, **P = 0.0079, **P = 0.0079. Two-tailed unpaired Student’s t-tests were performed in b. Two-tailed Student’s t-tests following two-way ANOVA were performed in c (irradiated tumors, P < 0.0001; non-irradiated tumors, P < 0.0001), e (irradiated tumors, P < 0.0001; non-irradiated tumors, P < 0.0001) and g (irradiated tumors, P < 0.0001; non-irradiated tumors, P < 0.0001). Error bars represent s.e.m. *P < 0.05, **P < 0.01, ***P < 0.001, ****P < 0.0001. Source data
Fig. 4
Fig. 4. Inflammatory macrophages mediate abscopal effects induced by radiotherapy and CD47 blockade.
a, Mouse KP1 SCLC cells were engrafted into both flanks of B6129SF1 immunocompetent syngeneic mice and only right-side tumors were irradiated. b, Macrophages were depleted using an anti-CSF1 antibody, as quantified by flow cytometry (CD11b+F4/80+ cells) from the tumors of mice in the control group with or without anti-CSF1 antibody on day 17. n = 1 experiment with n = 5 mice (two tumors per mouse), P = 0.0010. c, Growth curves of KP1 SCLC allografts as in a,b with the indicated treatments. n = 1 experiment with n = 5 mice (two tumors per mouse). Irradiated tumors, **P = 0.0079, **P = 0.0011, **P = 0.0038; non-irradiated tumors, **P = 0.0079, **P = 0.0079. NS, not significant; Mac., macrophages. d, Uniform Manifold Approximation and Projection (UMAP) dimension 1 and 2 plots of viable CD45+ cells in non-irradiated KP1 tumors in NSG mice in the RT and RT/CD47-blockade treatment groups. Cell clusters are colored by cell populations. Colored arrows point to two groups of inflammatory macrophages whose numbers increase in non-irradiated tumors in the RT/CD47-blockade treatment group. e, Number of cells in each subpopulation identified in the scRNA-seq analysis in the two treatment groups. f, Human NCI-H82 cells stably expressing green fluorescent protein (GFP) were engrafted into both flanks of NSG mice and only right-side tumors were irradiated. g, Example of a flow cytometry analysis of CD11b+F4/80+ macrophages also positive for GFP (indicative of phagocytosis) in the two treatments were irradiated. Schematic of the depletion on CD11b+ cells. h, Quantification of g. Phagocytosis was measured 6 d after treatment start as the percentage of CD11b+F4/80+ macrophages that are also GFP+. n = 1 experiment with n = 6 mice. ****P < 0.0001. Two-tailed Student’s t-tests following two-way ANOVA were performed in c (irradiated tumors, P < 0.0001; non-irradiated tumors, P < 0.0001). Two-tailed Student’s t-tests were performed in b and h. Error bars represent s.e.m. *P < 0.05, **P < 0.01, ***P < 0.001, ****P < 0.0001. Source data
Fig. 5
Fig. 5. Inflammatory macrophages respond to CSF1 produced by irradiated SCLC cells to mediate abscopal responses.
a, Schematic of the analysis of the response of SCLC cells to RT in culture. b, Heat map of relative mRNA levels for Csf1, Ccl2 and Mcp3 in irradiated KP1 and KP3 mouse SCLC cells and NCI-H82 human SCLC cells compared to non-irradiated control cells. n = 2 independent experiments (average values are shown). c, Flow cytometry analysis of in vitro phagocytosis assays with bone-marrow-derived macrophages and KP1 cells fluorescently labeled with calcein AM. n = 4 independent experiments shown as the average of technical triplicates. *P = 0.0286. d, Mouse KP1 control or Csf1 knockout (KO) SCLC cells were engrafted into the right flank of B6129SF1 immunocompetent syngeneic mice, with control KP1 cells on the left flank. Only the right side of tumors was irradiated. e, Relative mRNA level by quantitative PCR with reverse transcription (RT–qPCR) for Csf1 in KP1 control and Csf1 knockout cells. n = 3 technical replicates. f, Growth curves of KP1 allografts as in d at the irradiated and non-irradiated sites. n = 1 experiment with n = 8 mice. Irradiated tumors, ****P < 0.0001, *P = 0.0289; non-irradiated tumors, ***P = 0.0003, **P = 0.0081, ****P < 0.0001. g, Histological quantification of macrophage infiltration in non-irradiated KP1 control and Csf1 knockout tumors by immunostaining for F4/80 as in f. Each symbol represents one field quantified. n = 1 experiment with n = 7 (anti-CD47) or n = 8 (control, RT and RT + anti-CD47 (Csf1 KO) and RT + anti-CD47 (control)) mice. ****P < 0.0001, ***P = 0.0002, *P = 0.0177. Two-tailed unpaired Student’s t-tests were performed in c. Two-tailed Student’s t-tests following two-way ANOVA were performed in f (irradiated tumors, P < 0.0001; non-irradiated tumors, P < 0.0001). Two-tailed Student’s t-tests following one-way ANOVA were performed in g (P < 0.0001). Error bars represent s.e.m. *P < 0.05, **P < 0.01, ***P < 0.001, ****P < 0.0001. Source data
Fig. 6
Fig. 6. The abscopal effect is mediated by macrophages activated by CD47 blockade at the non-irradiated site.
a, Representation of a gene signature associated with leukocyte migration in the scRNA-seq dataset. b, Schematic of in vivo macrophage migration assays using FITC-ferumoxytol, an iron oxide nanoparticle compound that is preferentially phagocytosed by tumor-associated macrophages. c, FITC-ferumoxytol was injected to right-side KP1 tumors as in b 24 h before the start of the treatment (RT or RT + anti-CD47). Shown is the quantification of CD11b+F4/80+ macrophages that are also FITC+ 5 d after the start of treatment. n = 1 experiment with n = 7 mice. *P = 0.0249. d, Mouse KP1 control and Cd47 knockout SCLC cells were engrafted in the indicated combinations into both flanks of B6129SF1 immunocompetent syngeneic mice and only right-side tumors were irradiated; 1–2, wild-type tumors were irradiated; and 3–4, Cd47 knockout tumors were irradiated. e, Growth curves of KP1 SCLC allografts as in d with the indicated treatments. n = 1 experiment with n = 5 (two control, two RT and three RT), n = 6 (one RT, three control, four control and four RT) or n = 7 (one control) mice. Irradiated (control), **P = 0.0083, **P = 0.0030; irradiated (Cd47 KO), ****P < 0.0001; non-irradiated tumors, ***P = 0.0001. Two-tailed Student’s t-tests following one-way ANOVA were performed in c (irradiated tumors, P = 0.1332; non-irradiated tumors, P = 0.0017). Error bars represent s.e.m. *P < 0.05. Two-tailed Student’s t-tests following two-way ANOVA were performed in e (irradiated tumors, P < 0.0001; non-irradiated tumors, P < 0.0001; irradiated tumors, P < 0.0001; non-irradiated tumors, P < 0.000). Error bars represent s.e.m. *P < 0.05, **P < 0.01, ***P < 0.001, ****P < 0.0001. Source data
Fig. 7
Fig. 7. Activation of T cells by PD-1 blockade enhances abscopal effects upon radiation therapy and CD47 blockade in a colon cancer model.
a, Mouse colon cancer MC38 cells were engrafted into both flanks of C57Bl/6 immunocompetent syngeneic mice and only right-sided tumors were irradiated. b, Growth curves of MC38 allografts with the indicated treatments in irradiated and non-irradiated tumors. n = 1 experiment with n = 6 (control, anti-CD47 and RT) or n = 7 (RT + anti-CD47) mice. Irradiated tumors, ***P = 0.0006, ***P = 0.0006; non-irradiated tumors, **P = 0.0015, ***P = 0.0002. c, As in a with MC38 allografts in C57BL/6 mice except that CD8+ T cells were depleted with anti-CD8 antibody treatment. n = 1 experiment with n = 7 mice except RT + anti-CD47 (n = 8 mice). Irradiated tumors (control), ***P = 0.0002, ***P = 0.0002; irradiated tumors (CD8-depleted), ***P = 0.0006, ***P = 0.0006; non-irradiated tumors (control), ***P = 0.0003, ***P = 0.0003; non-irradiated tumors (CD8-depleted), ****P < 0.0001. d, Quantification of tumor-infiltrating CD8+ T cells in non-irradiated tumors from f. n = 1 experiment with n = 7 mice except RT + anti-CD47 (n = 8 mice). e, Growth curves of MC38 allografts with the indicated treatments in irradiated and non-irradiated tumors. n = 1 experiment with n = 7 (RT + anti-CD47) or n = 8 (RT + anti-CD47 + anti-PD-1) mice (two tumors per mouse). ****P < 0.0001. f, Quantification of tumor-infiltrating macrophages, M2-like macrophages, total T cells, CD4+ T cells and CD8+ T cells in non-irradiated tumors from e by flow cytometry. n = 1 experiment with n = 7 (RT + anti-CD47) or 8 (RT + anti-CD47 + anti-PD-1) mice. ***P = 0.0003, ***P = 0.0006, **P = 0.0078. Two-tailed Student’s t-tests following two-way ANOVA were performed in b (irradiated tumors, P < 0.0001; non-irradiated tumors, P < 0.0001), c (irradiated tumors, P < 0.0001; non-irradiated tumors, P < 0.0001) and e (irradiated tumors, P = 0.7841; non-irradiated tumors, P < 0.0001). Two-tailed Student’s t-tests following one-way ANOVA were performed in d (control, P = 0.0908; CD8-depleted, P = 0.4161). Two-tailed Student’s t-tests were performed for f. Error bars represent s.e.m. *P < 0.05, **P < 0.01, ***P < 0.001, ****P < 0.0001. Source data
Extended Data Fig. 1
Extended Data Fig. 1. CD47 blockade enhances local antitumor effects following radiation in murine and human SCLC models.
a. Growth curves of KP1 SCLC allografts in NSG mice irradiated with 0, 5, or 10 Gy. N = 1 experiment with n = 5 tumors for each condition. ***p = 0.003, **p = 0.0079. b. In vitro phagocytosis assay performed with mouse bone marrow-derived macrophages (BMDMs) and KP1 mouse SCLC control and Cd47 knockout cells. N = 1 experiment with triplicates of the primary cultures. cf. Experiments with NCI-H82 SCLC xenografts in NSG mice. c. Growth curves with the indicated treatments. N = 1 experiment with n = 4 mice. ***p = 0.0002, *p = 0.0225. d. Body weight of mice. e. Representative H&E (hematoxylin and eosin) of NCI-H82 tumor sections. f. Histological analysis of macrophage infiltration in SCLC xenografts. Specimens were stained for the macrophage marker, F4/80 (left) and the signal was quantified (right). Scale bar, 100 µm. N = 1 experiment with n = 4 tumors. ****p < 0.0001, *p = 0.0136. g–j. Same as (cf) for NJH29 SCLC xenografts. N = 1 experiment with n = 4 (Control, RT) or n = 5 (Anti-CD47, RT + Anti-CD47) mice. g. **p = 0.0054, ***p = 0.0009. j. ****p < 0.0001. Two-tailed unpaired t-tests were performed in (b) with primary BMDMs. Two-tailed t-tests following two-way ANOVA were performed in (a) (p < 0.0001), (c) (p = 0.0004) and (g) (p = 0.0007). Two-tailed t-tests following one-way ANOVA were performed in (f) (p < 0.0001) and (j) (p < 0.0001). Error bars represent SEM. *p < 0.05, **p < 0.01, ***p < 0.001, ****p < 0.0001. Source data
Extended Data Fig. 2
Extended Data Fig. 2. Abscopal effects upon radiation therapy and CD47 blockade in the KP1 mouse model of SCLC are independent of T cells.
a. Growth curves of KP1 SCLC allografts with the indicated treatments in irradiated and non-irradiated tumors. N = 1 experiment with n = 5 mice. Independent experiment shown in Fig. 3c. Irradiated tumors: *p = 0.0159, ***p = 0.0001, **p = 0.0079, **p = 0.0023, non-irradiated tumors: ***p = 0.0003, ****p < 0.0001, **p = 0.0079. b. Histological analysis and quantification of T-cell infiltration as in Fig. 3c by immunostaining for CD3. Sections were counterstained with hematoxylin. Each symbol represents one field quantified. Scale bar, 100 µm. N = 1 experiment with n = 5 mice except RT + anti-CD47/Control and RT + Anti-CD47/CD8 depletion (n = 4 mice). c. Populations of macrophages and T cells (antibodies indicated) quantified by flow cytometry in the KP1 and KP3 mouse allograft models in B6129SF1 hosts. N = 1 experiment with n = 4 (KP1) or n = 5 (KP3) mice. *p = 0.0317, *p = 0.0159. d. KP3 SCLC cells were engrafted into both flanks of B6129SF1 immunocompetent syngeneic mice and only right-side tumors were irradiated. e. Growth curves of KP3 allografts with the indicated treatments in irradiated and non-irradiated control tumors. N = 1 experiment with n = 7 (Anti-CD47) or n = 8 (Control), or n = 9 (RT and RT + Anti-CD47) mice (2 tumors per mouse). 5/9 mice had complete remission at both sides in the combination treatment arm. ****p < 0.0001. Two-tailed t-tests were performed in (c). Two-tailed t-tests following one-way ANOVA were performed in (b) (irradiated tumors: p = 0.0054, non-irradiated tumors: p = 0.30). Two-tailed t-tests following two-way ANOVA were performed in (a) (irradiated tumors: p < 0.0001, non-irradiated tumors: p < 0.0001) and (e) (irradiated tumors: p < 0.0001, non-irradiated tumors: p < 0.0001). Error bars represent SEM. *p < 0.05, **p < 0.01, ***p < 0.001, ****p < 0.0001. Source data
Extended Data Fig. 3
Extended Data Fig. 3. T-cell independent abscopal effects upon radiation therapy and CD47 blockade in the NJH29 SCLC model.
a. Human SCLC cells (NJH29) were engrafted into both flanks of NSG mice and only right-side tumors were irradiated. b. Immunoblot analysis for ASCL1, NEUROD1, c-MYC. HSP90 is a loading control. N = 1 experiment. c, e. Growth curves of xenografts with the indicated treatments. c. NJH29: N = 1 experiment with n = 5 mice per condition. Irradiated tumors: **p = 0.0022, ***p = 0.0008, non-irradiated tumors: *p = 0.0113, *p = 0.0241. d. CD47 expression by flow cytometry in NJH29 control and CD47 knockouts. e. NJH29: N = 1 experiment with n = 5 mice. NSG mice were engrafted with either two control tumors or two knockout tumors. f. Quantification of tumor volume 8 days after radiation in irradiated and non-irradiated control tumors in (e). N = 1 experiment with n = 5 mice. Irradiated tumors: ***p = 0.0006, ****p < 0.0001, non-irradiated tumors: ***p = 0.0002. Two-tailed t-tests following two-way ANOVA were performed in (c) (irradiated tumors: p = 0.0015, non-irradiated tumors: p = 0.0055). Two-tailed t-tests following one-way ANOVA were performed in (f) (irradiated tumors: p < 0.0001, non-irradiated tumors: p = 0.0001). Source data
Extended Data Fig. 4
Extended Data Fig. 4. T-cell independent abscopal effects upon radiation therapy and CD47 blockade in human SCLC models.
a. Human SCLC cells were engrafted into both flanks of NSG mice and only right-side tumors were irradiated. b, d, f, Growth curves of xenografts with the indicated treatments. b. NCI-H82: N = 1 experiment with n = 4 (Control, Anti-CD47) or 5 (RT, RT + Anti-CD47) mice. Irradiated tumors: ****p < 0.0001, ***p = 0.0007, non-irradiated tumors: ***p = 0.0002, **p = 0.0010. c. Histological analysis and quantification of macrophages tumors as in (b) by immunostaining for F4/80. Sections were counterstained with hematoxylin. Each symbol represents one field quantified. Scale bar, 100 µm. Irradiated tumors: *p = 0.0282, ****p < 0.0001, non-irradiated tumors: ****p < 0.0001. d. NCI-H526: N = 1 experiment with n = 7 mice per condition. e. Quantification of tumor volume 10 days after radiation in irradiated and non-irradiated control tumors in (d). N = 1 experiment with n = 7 mice per condition. Irradiated tumors: ****p < 0.0001, ***p = 0.0002, non-irradiated tumors: ***0.0006, ***p = 0.0006. f. NCI-H69: N = 1 experiment with n = 7 (Control, Anti-CD47, RT) or 8 (RT + Anti-CD47) mice per condition. Irradiated tumors: ****p < 0.0001, **p = 0.0064, non-irradiated tumors: ***p = 0.0004, ***p = 0.0002. g. Survival curves of NCI-H526 xenografts with the indicated treatments: N = 1 experiment with n = 14 (Control, RT) or n = 15 (Anti-CD47, RT + Anti-CD47) mice. Two-tailed t-tests following two-way ANOVA were performed in (b) (irradiated tumors: p < 0.0001, non-irradiated tumors: p < 0.0001), and (f) (irradiated tumors: p < 0.0001, non-irradiated tumors: p < 0.0001). Two-tailed t-tests following one-way ANOVA were performed in (c) (irradiated tumors: p < 0.0001, non-irradiated tumors: p < 0.0001) and (d) (irradiated tumors: p < 0.0001, non-irradiated tumors: p = 0.0002). Survival curves were compared using the Log-rank test in (g). Error bars represent SEM. *p < 0.05, **p < 0.01, ***p < 0.001, ****p < 0.0001. Source data
Extended Data Fig. 5
Extended Data Fig. 5. Abscopal effects of combination of radiation and CD47 blockade are mediated by macrophages in SCLC.
a Macrophages were depleted with anti-CSF1 antibody treatment as indicated. b. Mouse KP1 SCLC cells were engrafted into both flanks of NSG mice and only right-side tumors were irradiated. Growth curves of KP1 SCLC allografts with the indicated treatments. N = 1 experiment with n = 5 tumors. Irradiated tumors: *p = 0.0398, ****p < 0.0001, non-irradiated tumors: ****p < 0.0001. c. Histological analysis and quantification of macrophages infiltrating irradiated and non-irradiated tumors from Fig. 4c by immunostaining for F4/80. Sections were counterstained with hematoxylin. Each symbol represents one field quantified. Scale bar, 100 µm. N = 1 experiment with n = 5 mice. Irradiated tumors: ****p < 0.0001, **p = 0.0033, non-irradiated tumors: ****p < 0.0001, **p = 0.0045. d. Expression of representative genes for subpopulations of CD45 + hematopoietic cells in SCLC tumors from the scRNA-seq analysis as in Fig. 4d. The % of cells expressing the genes is indicated by the size of the circle. Two-tailed t-tests following one-way ANOVA were performed in (c) (irradiated tumors: p < 0.0001, non-irradiated tumors: p < 0.0001). Two-tailed t-tests following two-way ANOVA were performed in (b) (irradiated tumors: p < 0.0001, non-irradiated tumors: p < 0.0001). Error bars represent SEM. *p < 0.05, **p < 0.01, ***p < 0.001, ****p < 0.0001. Source data
Extended Data Fig. 6
Extended Data Fig. 6. Abscopal effects of combination of radiation and CD47 blockade are associated with tumor-infiltrating macrophages.
a. Mouse KP1 SCLC cells were engrafted into both flanks of B6129SF1 immunocompetent syngeneic mice and only right-side tumors were irradiated. b. Growth curves are shown for the indicated treatments in irradiated and non-irradiated control tumors. N = 1 experiment with n = 5 (Control and Anti-CD47) or n = 6 (RT and RT + Anti-CD47) mice. Irradiated tumors: ****p < 0.0001, ***p = 0.0003, non-irradiated tumors: ***p = 0.0001, **p = 0.0023. c–f, Quantification of tumor-infiltrating macrophages (c), M2-like macrophages (d), dendritic cells (e), and CD86 + activated dendritic cells (f) in irradiated and non-irradiated tumors from (a) using the indicated markers from flow analysis. N = 1 experiment with n = 5 (Control and Anti-CD47) or 6 (RT and RT + Anti-CD47) mice. c, irradiated tumors: **p = 0.0043, ****p < 0.0001, non-irradiated tumors: **p = 0.0043, **p = 0.0022, d, irradiated tumors: **p = 0.0017, *p = 0.0148, e, irradiated tumors: **p = 0.0043, f, irradiated tumors: *p = 0.0115, non-irradiated tumors: *p = 0.0412. g. Representation of a gene signature associated with fibrosis and SCLC relapse in macrophages in the scRNA-seq dataset. Two-tailed t-tests following two-way ANOVA were performed in (b) (irradiated tumors: p < 0.0001, non-irradiated tumors: p < 0.0001). Two-tailed t-tests following one-way ANOVA were performed in (c) (irradiated tumors: p < 0.0001, non-irradiated tumors: p < 0.0001), (d) (irradiated tumors: p = 0.0025, non-irradiated tumors: p = 0.1154), (e) (irradiated tumors: p = 0.0392, non-irradiated tumors: p = 0.2427), and (f) (irradiated tumors: p = 0.0031, non-irradiated tumors: p = 0.0432). Error bars represent SEM. *p < 0.05, **p < 0.01, ***p < 0.001, ****p < 0.0001. Source data
Extended Data Fig. 7
Extended Data Fig. 7. Irradiation of SCLC cells in culture results in the secretion of inflammatory cytokines and enhances the phagocytosis and the migration ability of macrophages.
a. SCLC cells were collected 24 hours after irradiation (N = 1 experiment with 2 controls and 3 irradiated samples) and analyzed by bulk RNA sequencing (RNA-seq). Differentially expressed genes were obtained using DESeq2 using IHW for p value correction. Genes in red in the MA plot have a p-adjusted value < 0.05. b. GO of upregulated genes. c. GO of downregulated genes. See also Supplementary Tables 3, 4. d. Cytokine array with conditioned medium harvested from irradiated and control KP1 mouse SCLC cells. N = 1 experiment for each time point (the average of technical triplicates is shown). A different array was used for day 1 versus days 3 and 5. See also Supplementary Table 5. e. Representative immunofluorescence image of an in vitro phagocytosis assay with mouse bone marrow-derived macrophages (BMDMs) marked by F4/80 (red) and beads conjugated with FITC (green). The supernatant of irradiated KP1 cells was compared to non-irradiated cells. DAPI stains the DNA in blue. Scale bar, 100 μm. f. Quantification of (e). N = 1 experiment with triplicates. p = 0.0381. g. Flow cytometry analysis of an in vitro phagocytosis assay with BMDMs and KP3 mouse SCLC cells labeled with Calcein AM. N = 1 experiment with 6 technical replicates. h. Normalized migration ability of irradiated and control BMDMs (Mac.) cultured with conditioned medium of irradiated or control KP1 cells. N = 4 independent experiments with 2–3 replicates per experiment. *p = 0.0286. i. Normalized migration ability of BMDMs cultured with conditioned medium of irradiated (two doses) and control KP1 cells. N = 4 independent experiments with triplicates. *p = 0.0286, *p = 0.0286. j. Mouse KP1 control, Csf1 knockout (KO) (see Fig. 5d–g), or Csf1/Ccl2 KO SCLC cells were engrafted into the right flank of recipient mice, with control KP1 cells on the left flank. Only right-side of tumors were irradiated. k. Relative mRNA level by RT–qPCR for Csf1 and Ccl2 in Control and Csf1/Ccl2 KO cells (n = 3 technical replicates). l. Growth curves of KP1 allografts as in (j) at the irradiated and non-irradiated sites. N = 1 experiment with n = 7 (RT + Anti-CD47 (Con) and RT + Anti-CD47 (Csf1 KO)), 8 (Anti-CD47), or 9 (Control, RT, and RT + Anti-CD47 (Csf1/Ccl2 KO) mice. Irradiated tumors: ****p < 0.0001, **p = 0.0049, non-irradiated tumors: ***p = 0.0006, **p = 0.0013, *p = 0.0281, ****p < 0.0001. m. KP1 cells were engrafted into the left flank of recipient mice. Only right-side of flanks (no tumors) were irradiated. Growth curves of KP1 allografts at the non-irradiated site. N = 1 experiment with n = 6 (Control, Anti-CD47) or n = 7 (RT, RT + Anti-CD47) mice. Two-tailed unpaired t-tests were performed on technical replicates in (f) and (g) with primary BMDM cultures. Two-tailed t-tests following one-way ANOVA were performed in (h) (p = 0.0006) and (i) (p = 0.0038). Two-tailed t-tests following two-way ANOVA were performed in (l) ((irradiated tumors: p < 0.0001, non-irradiated tumors: p < 0.0001) and (m) (p = 0.3077). Error bars represent SEM. *p < 0.05, **p < 0.01, ***p < 0.001, ****p < 0.0001. Source data
Extended Data Fig. 8
Extended Data Fig. 8. Increased numbers of monocytes/macrophages in response to irradiation in breast and rectal cancer.
a. Signature for the cell cycle status of CD45 + hematopoietic cells in the scRNA-seq datasets as in Fig. 4d. b. Absolute abundance of monocytes-macrophages, monocytes, M0, M1, and M2 macrophages, T cells, CD4+, CD8+, and regulatory T cells based on CIBERSORTx enumeration in human breast cancer and rectal cancer. n = 9 (Ctrl, RT) in breast cancer. n = 13 (Ctrl) and n = 9 (RT) in rectal cancer. Two-tailed parametric paired (breast cancer study) or unpaired (rectal cancer study) t-tests were performed in b and the actual values are indicated in addition to the asterisks. *p<0.05, **p<0.01. Error bars represent SEM. Source data
Extended Data Fig. 9
Extended Data Fig. 9. Possible abscopal response in a patient with SCLC associated with an increase in monocytes/macrophages, as well as CD8+ T cells.
a. Timeline showing treatment and responses of mediastinal lymph nodes to treatment. The patient was a 59-year old female diagnosed with SCLC. She was initially treated with chemotherapy followed by olaparib and durvalumab (NCT02484404) and topotecan and berzosertib (NCT02487095). To relieve the symptoms caused by mediastinal lymph nodes, the patient was treated with radiotherapy (3000 cGy/10 fractions) and then treated with M7824 (for 7 months), a bifunctional fusion protein targeting PD-L1 and TGF-beta signaling. This patient died 12 months after radiotherapy due to aspiration pneumonia. b. CT images of pre- and 3 months post- radiotherapy and CT simulation image for radiotherapy planning. Although M7824 targets not only PD-1/PD-L1 but also TGF-beta signaling and is reported potent antitumor effects in some cancer types, M7824 did not show improved antitumor efficacy compared with historical results of immune checkpoint inhibitors in SCLC (NCT03554473). c. Absolute abundance of B cells, CD8+ T cells, CD4+ T cells, NK cells, monocytes/macrophages, and neutrophils based on CIBERSORT enumeration in cervical lymph node metastasis of pre- and post-radiotherapy. d. Representative flow cytometry analysis of J774A.1 mouse macrophage cells in culture 24 hours after adding FITC-ferumoxytol (Fe) to the culture medium at different concentrations. Experiment shown as a positive control of FITC-ferumoxytol phagocytosis by macrophages. Source data
Extended Data Fig. 10
Extended Data Fig. 10. T-cell independent abscopal effects upon radiation therapy and CD47 blockade in cancer models.
a. Human Ramos lymphoma cells were engrafted into both flanks of NSG immunodeficient mice and only right-side tumors were irradiated. b. Growth curves of Ramos xenografts. N = 1 experiment with n = 6 mice. Irradiated tumors: **p = 0.0022, **p = 0.0047, non-irradiated tumors: **p = 0.0021, ***p = 0.0002. c. MC38 allografts in C57Bl/6 mice were treated with the indicated treatments (as in Fig. 7a,b) and tumor-infiltrating macrophages (F4/80 + CD11b+), CD206 + M2-like macrophages, CD4+ T cells and CD8 + T cells were quantified by immunostaining. N = 1 experiment with n = 6 tumors. CD11b + F4/80+: ***p = 0.0001, ***p = 0.0001, CD206+: *p = 0.0158, CD4+: **p = 0.057, *p = 0.0110. d. Proposed model for macrophage-mediated abscopal effects. Irradiation of tumors results in the secretion of inflammatory molecules such as CSF1 and other cytokines that can activate macrophages. Blockade of CD47 further activate the migratory and phagocytic activity of macrophages. CD47 blockade is critical at both the irradiated and non-irradiated tumor sites but not required systemically. Activated macrophages can migrate from the irradiated site to the non-irradiated site, and possibly also directly from the circulation. Not shown in the model, T cells can cooperate with macrophages to enhance antitumor responses. Two-tailed t-tests following two-way ANOVA were performed in (b) (irradiated tumors: p < 0.0001, non-irradiated tumors: p < 0.0001). Two-tailed t-tests following one-way ANOVA were performed in (c) (CD11b + F4/80+: p < 0.0001, CD206+: p = 0.0121, CD4+: p = 0.0217, CD8+: p = 0.4010) Error bars represent SEM. *p < 0.05, **p < 0.01, ***p < 0.001, ****p < 0.0001. Source data

References

    1. Jaffray DA. Image-guided radiotherapy: from current concept to future perspectives. Nat. Rev. Clin. Oncol. 2012;9:688–699. doi: 10.1038/nrclinonc.2012.194. - DOI - PubMed
    1. Lomax ME, Folkes LK, O’Neill P. Biological consequences of radiation-induced DNA damage: relevance to radiotherapy. Clin. Oncol. 2013;25:578–585. doi: 10.1016/j.clon.2013.06.007. - DOI - PubMed
    1. Baumann M, et al. Radiation oncology in the era of precision medicine. Nat. Rev. Cancer. 2016;16:234–249. doi: 10.1038/nrc.2016.18. - DOI - PubMed
    1. Sharabi AB, Lim M, DeWeese TL, Drake CG. Radiation and checkpoint blockade immunotherapy: radiosensitisation and potential mechanisms of synergy. Lancet Oncol. 2015;16:e498–e509. doi: 10.1016/S1470-2045(15)00007-8. - DOI - PubMed
    1. Weichselbaum RR, Liang H, Deng L, Fu YX. Radiotherapy and immunotherapy: a beneficial liaison? Nat. Rev. Clin. Oncol. 2017;14:365–379. doi: 10.1038/nrclinonc.2016.211. - DOI - PubMed

Publication types