. 2023 Feb;30(2):226-232.
doi: 10.1038/s41594-022-00865-w. Epub 2022 Nov 21.

Structures of transcription preinitiation complex engaged with the +1 nucleosome

Affiliations

Structures of transcription preinitiation complex engaged with the +1 nucleosome

Haibo Wang et al. Nat Struct Mol Biol. 2023 Feb.

Abstract

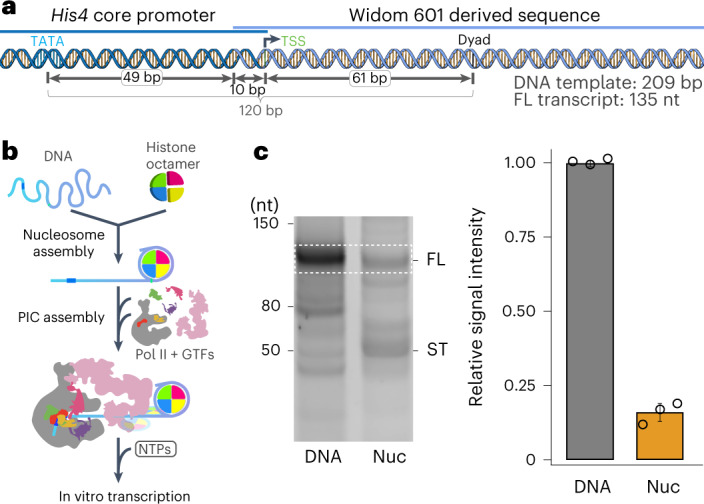
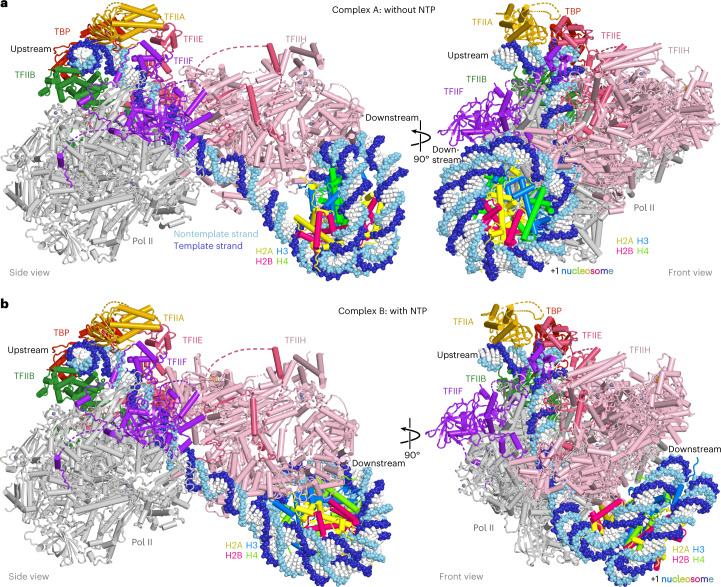
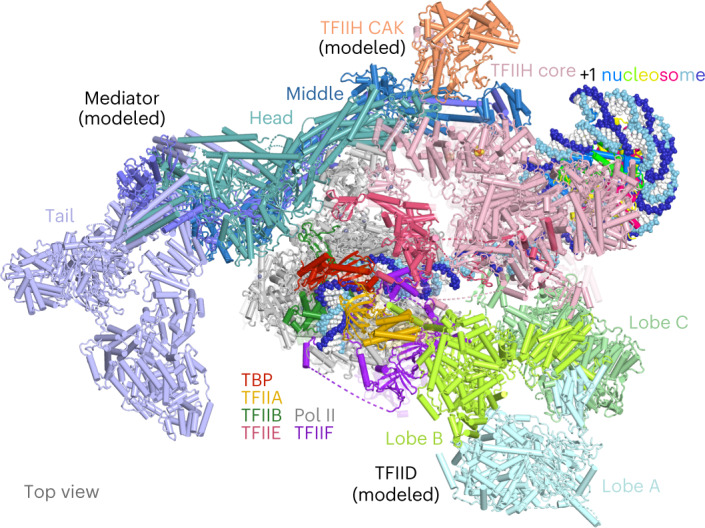
The preinitiation complex (PIC) assembles on promoters of protein-coding genes to position RNA polymerase II (Pol II) for transcription initiation. Previous structural studies revealed the PIC on different promoters, but did not address how the PIC assembles within chromatin. In the yeast Saccharomyces cerevisiae, PIC assembly occurs adjacent to the +1 nucleosome that is located downstream of the core promoter. Here we present cryo-EM structures of the yeast PIC bound to promoter DNA and the +1 nucleosome located at three different positions. The general transcription factor TFIIH engages with the incoming downstream nucleosome and its translocase subunit Ssl2 (XPB in human TFIIH) drives the rotation of the +1 nucleosome leading to partial detachment of nucleosomal DNA and intimate interactions between TFIIH and the nucleosome. The structures provide insights into how transcription initiation can be influenced by the +1 nucleosome and may explain why the transcription start site is often located roughly 60 base pairs upstream of the dyad of the +1 nucleosome in yeast.


Conflict of interest statement

The authors declare no competing interests.

Figures

Fig. 1
Fig. 1. Reconstituted, functional PIC–nucleosome complex.
a, Schematic of template DNA. The distances between the TATA box, TSS and nucleosome dyad are indicated. The expected lengths of template and transcript are noted at the bottom right. b, Schematic of in vitro transcription assay. For details, see the Methods. c, The +1 nucleosome impairs promoter-dependent transcription in vitro. Assays were performed with template DNA without (DNA) or with +1 nucleosome (Nuc). Representative original scan of the urea–PAGE analysis that yielded results presented on the right. RNA transcripts were analyzed by urea-denaturing PAGE and the full-length product was quantified (dashed rectangle). Experiments were performed at least three times. Bars correspond to the mean of three independent experiments; error bars represent the s.d. FL, full-length transcript; ST, shorter transcripts. Source data
Fig. 2
Fig. 2. Structures of PIC–nucleosome complexes A and B.
a, Two views of a ribbon model of complex A with template and nontemplate DNA shown as dark and light blue spheres, respectively. b, Two views of a ribbon model of complex B with template and nontemplate DNA shown as dark and light blue spheres, respectively.
Fig. 3
Fig. 3. Movement of the +1 nucleosome upon NTP addition.
a, Rotation of the +1 nucleosome as observed by comparison of complex A (light colors, without NTPs) and complex B (full colors, with NTPs). b, Detachment of promoter-proximal, terminal nucleosomal DNA from the histone octamer. Terminal nucleosomal DNA is displaced by roughly 20° and 60° in complexes A and B, respectively, with respect to the canonical nucleosomal DNA path (orange). The nucleosome dyad is indicated in black.
Fig. 4
Fig. 4. TFIIH–nucleosome contacts.
a, TFIIH–nucleosome interface in complex A. Tfb2 residues K495, K506 and R507, and Tfb5 residues R3, R5 and K6 from the dimerization domain contact DNA around the nucleosome dyad. Except for K495 in Tfb2, these TFIIH residues are conserved in human TFIIH. b, TFIIH–nucleosome interface in complex B. Four TFIIH subunits that are implicated in nucleosome contacts are shown in different colors. The view is related to the front view in Fig. 2a. The first contact may involve Ssl2 residue D103 and H3 residue R52. The second contact may involve Tfb2 residue K262 and the acidic patch on histones H2A and H2B. The third contact may involve Ssl1 residues K414, K417 and K420 that contact DNA around the nucleosome dyad. The fourth contact may involve Tfb4 residue R104 and histone H4 residue D24. Except for R104 in Tfb4 and K414 and K417 in Ssl1, these TFIIH residues are conserved in human TFIIH.
Fig. 5
Fig. 5. Evidence for a preferred orientation of the +1 nucleosome.
a, Schematic of template DNA for complexes A/B and C. The distances between the TATA box and nucleosome dyad are indicated. b, Structure of PIC–nucleosome complex C compared to complex B. The left panel shows the front view of complex C and B. The right panel shows the similar orientation of the +1 nucleosome in each complex aligned on TFIIH.
Fig. 6
Fig. 6. Rbp6 NTT occupies the active center cleft of Pol II.
a, Close-up views of Pol II active center in complex A. Pol II subunits are colored and labeled individually. Rpb6 NTT residues are shown as sticks and labeled as indicated. Electrostatic interactions and hydrogen bonds are shown as yellow dotted lines. b, Superposition of the core PIC containing the Rpb6 NTT with the structure of an ITC (PDB 4BBS) shows that binding of the NTT is incompatible with nucleic acid binding during transcription. The template strand, nontemplate strand and RNA transcript in the ITC structure are indicated.
Fig. 7
Fig. 7. Mediator and TFIID can be accommodated on PIC–nucleosome structure.
Mediator and TFIID were placed onto the complex B PIC–nucleosome structure by superimposing the Mediator- and TFIID-containing human PIC structure (PDB 7ENC) aligned on Pol II.
Extended Data Fig. 1
Extended Data Fig. 1. Transcription assay using His4 promoter DNA.
a. Reconstitution of nucleosome with His4 promoter DNAs. Template DNAs (DNA) and reconstituted nucleosomes (Nuc) were analyzed by 1% agarose gel. M: single strand RNA marker with size for each band on the right. b. The +1 nucleosome impairs promoter-dependent transcription in vitro. Assays were performed with template DNA without (DNA) or with +1 nucleosome (Nuc). RNA transcripts were analyzed by urea-denaturing PAGE and the full-length product was quantified (dashed rectangle). This experiment was repeated 3 times independently with similar results. Bars correspond to the mean of three independent experiments; error bars represent the s.d. Source data
Extended Data Fig. 2
Extended Data Fig. 2. Cryo-EM structure determination and analysis of PIC-nucleosome complex A.
a. Exemplary cryo-EM micrograph. A scale bar is provided. In total 26,764 micrographs were collected with similar results. b. Particle sorting and classification tree. Regions corresponding to Pol II, general transcription factors (GTFs) and template DNA are colored as in Fig. 2a, histones are colored in light yellow. Maps deposited to EMDB are indicated with grey background and outlined in black. The subpopulation of TBP-nucleosome complex is not described in this study since a similar TBP-NCP structure has been published before. c. Representative 2D class averages of sorted particles used for final reconstruction.
Extended Data Fig. 3
Extended Data Fig. 3. Cryo-EM structure determination and analysis of PIC-nucleosome complex B.
a. Exemplary cryo-EM micrograph. A scale bar is provided. In total 31,286 micrographs were collected with similar results. b. Particle sorting and classification tree. Regions corresponding to Pol II, general transcription factors (GTFs) and template DNA are colored as in Fig. 2b, histones are colored in light yellow. Maps deposited to EMDB are indicated with grey background and outlined in black. The subpopulation of TBP-nucleosome complex is not described in this study since a similar TBP-NCP structure has been published before. c. Representative 2D class averages of sorted particles used for final reconstruction.
Extended Data Fig. 4
Extended Data Fig. 4. Quality of cryo-EM reconstructions of complexes A and B.
a. PIC-nucleosome complex A and B reconstructions colored according to local resolution for the core PIC (left), TFIIH (middle) and the +1 nucleosome (right). The color bars from blue to red indicate the local resolution range in Å. Angular distribution diagrams for particles in the final reconstructions are shown on the right. Color shading from blue to yellow correlates with the number of particles at a specific orientation as indicated. b. Fourier shell correlation (FSC) between the half maps of the reconstruction. The average resolution is estimated at the FSC 0.143 cut-off criterion (dashed line). c. Electron densities (blue mesh) for various parts as indicated. d. Model-to-map FSC correlation between the final model and reconstruction. The depicted correlation curves were calculated from the FSC between the derived model and the reconstruction. The resolutions at the FSC 0.5 cut-off criterion (dashed line) are denoted.
Extended Data Fig. 5
Extended Data Fig. 5. Structural changes in the PIC-nucleosome complexes.
a. Superimposition of PIC-nucleosome complex A and B on previous PIC complex (PDB code: 7O73). b. Superimposition of PIC-nucleosome complex A and B aligned on Pol II. The red dashed box encloses the DNA around initially melting region. The black arrows indicate the directions of movement of the DNA towards the active center of Pol II.
Extended Data Fig. 6
Extended Data Fig. 6. Cryo-EM structure determination and analysis of PIC-nucleosome complex C.
a. Exemplary cryo-EM micrograph. A scale bar is provided. In total 15,515 micrographs were collected with similar results. b. Particle sorting and classification tree. Regions corresponding to Pol II, general transcription factors (GTFs) and template DNA are colored as in Fig. 2a, histones are colored in light yellow. Maps deposited to EMDB are indicated with grey background and outlined in black. The subpopulation of TBP-nucleosome complex is not described in this study since a similar TBP-NCP structure has been published before. c. Representative 2D class averages of sorted particles used for final reconstruction.
Extended Data Fig. 7
Extended Data Fig. 7. Rbp6 NTT occupies the active center cleft of Pol II.
a. Crosslinks between Rpb6 NTT and other Pol II subunits. The close-up view shows three observed EDC crosslinks (black dashed lines). b. Sequence alignment of Rpb6 orthologs. The NTT regions are boxed. Acidic residues of Rpb6 NTT that are involved in interaction with the Pol II cleft are indicated in bold.
Extended Data Fig. 8
Extended Data Fig. 8. Comparison of structural elements occupying the cleft of Pol I, II, and III.
a. Pol I and Pol III contain elements that can occupy the active center cleft at a location corresponding to that observed for the Rpb6 NTT in Pol II (Extended Data Fig. 4). These elements are referred to as the expander or DNA-mimicking loop of A190 in yeast Pol I (PDB code: 4C3H), and as the C-terminal tail of RPC7 (C31 in yeast) in human Pol III (PDB code: 7D59). b. Superposition of cleft elements in Pol I, Pol II and Pol III. The bridge helix and the catalytic magnesium ion in the active site are indicated.
Extended Data Fig. 9
Extended Data Fig. 9. Mediator and TFIID are compatible with the PIC-nucleosome structure.
a. Yeast core Mediator (cMed) was placed onto our PIC-nucleosome structure by superimposing the core PIC in the yeast cMed-PIC structure (PDB code: 5OQM). b. TFIID was placed onto the PIC-nucleosome structure by superimposing the core PIC in the human TFIID-containing PIC structure (PDB code: 7EGB) since no yeast TFIID-containing PIC structure is available. The unmodelled double bromodomain of TAF1 and the PHD finger domain of TAF3 are depicted as ovals. The unmodelled histone tails in the structure are depicted as threads with histone modifications symbolized as spheres.
Extended Data Fig. 10
Extended Data Fig. 10. Model for TSS scanning.
a. The PIC-nucleosome complex structure presented here corresponds to the state before scanning starts (pre-scanning state). The Pol II active center and the TSS are indicated. The lower panel shows a schematic representation. Distances between the TATA box and selected DNA elements are denoted. b. Model of the PIC-nucleosome complex in the post-scanning state. The modelled structure was generated using structures of the yeast PIC with open DNA (PDB code: 7O75) and of Pol II with a partially unraveled nucleosome (PDB code: 6A5T). The partially unraveled nucleosome with 5 turns of nucleosomal DNA detached from the histone octamer position was aligned with the PIC-nucleosome structure based on DNA and manually adjusted to avoid clashes between the nucleosome and TFIIH.

References

    1. He Y, et al. Near-atomic resolution visualization of human transcription promoter opening. Nature. 2016;533:359–365. doi: 10.1038/nature17970. - DOI - PMC - PubMed
    1. Plaschka C, et al. Transcription initiation complex structures elucidate DNA opening. Nature. 2016;533:353–358. doi: 10.1038/nature17990. - DOI - PubMed
    1. Robinson PJ, et al. Structure of a complete Mediator-RNA polymerase II pre-initiation complex. Cell. 2016;166:1411–1422 e1416. doi: 10.1016/j.cell.2016.08.050. - DOI - PMC - PubMed
    1. Schilbach S, et al. Structures of transcription pre-initiation complex with TFIIH and Mediator. Nature. 2017;551:204–209. doi: 10.1038/nature24282. - DOI - PMC - PubMed
    1. Aibara S, Schilbach S, Cramer P. Structures of mammalian RNA polymerase II pre-initiation complexes. Nature. 2021 doi: 10.1038/s41586-021-03554-8. - DOI - PubMed

Publication types

MeSH terms