. 2022 Dec;7(12):2054-2067.
doi: 10.1038/s41564-022-01263-0. Epub 2022 Nov 21.

A large-scale genomic snapshot of Klebsiella spp. isolates in Northern Italy reveals limited transmission between clinical and non-clinical settings

Affiliations

A large-scale genomic snapshot of Klebsiella spp. isolates in Northern Italy reveals limited transmission between clinical and non-clinical settings

Harry A Thorpe et al. Nat Microbiol. 2022 Dec.

Abstract

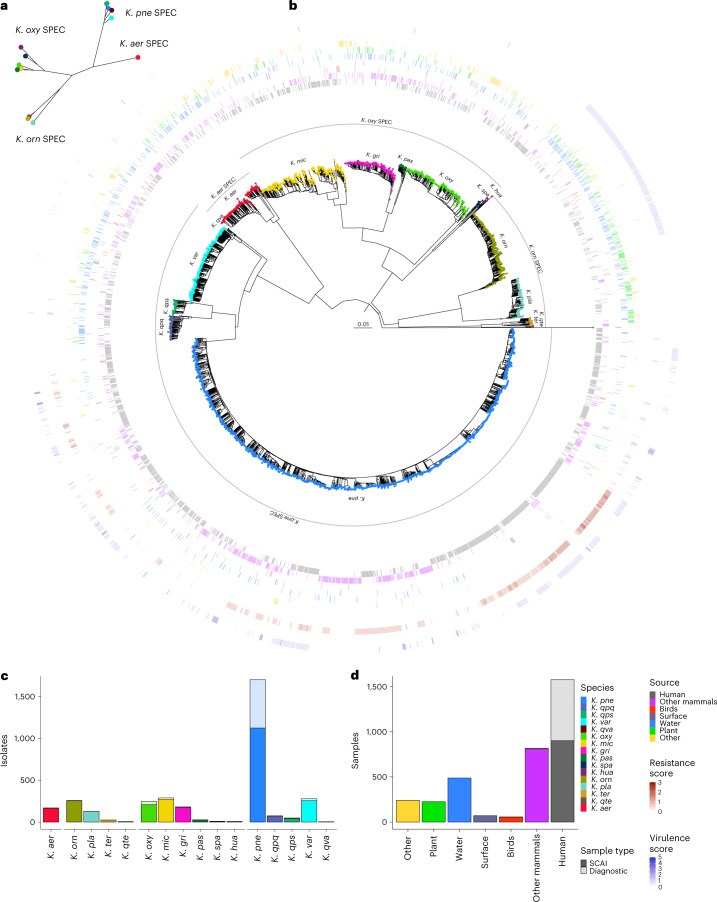
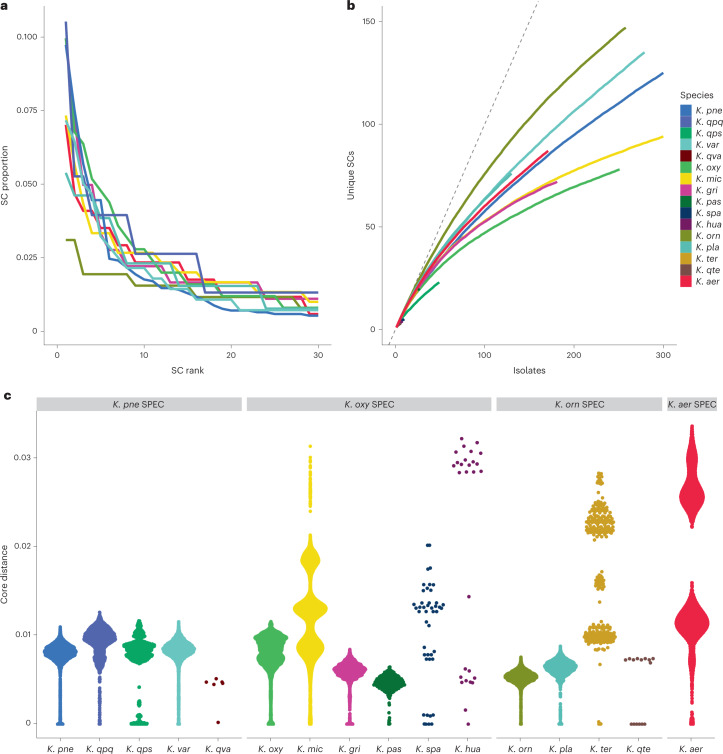
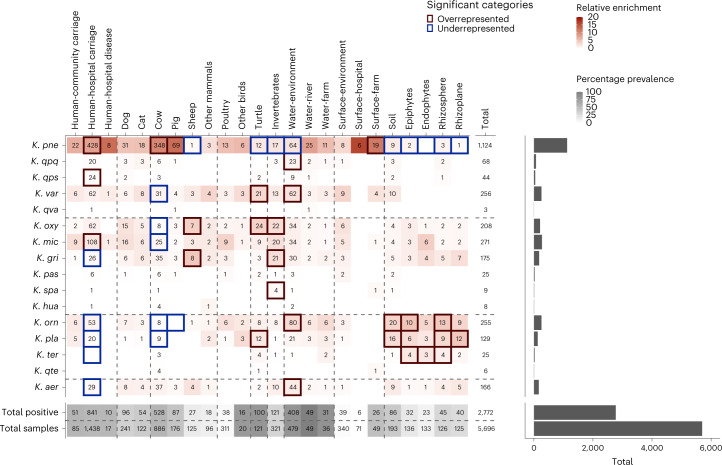
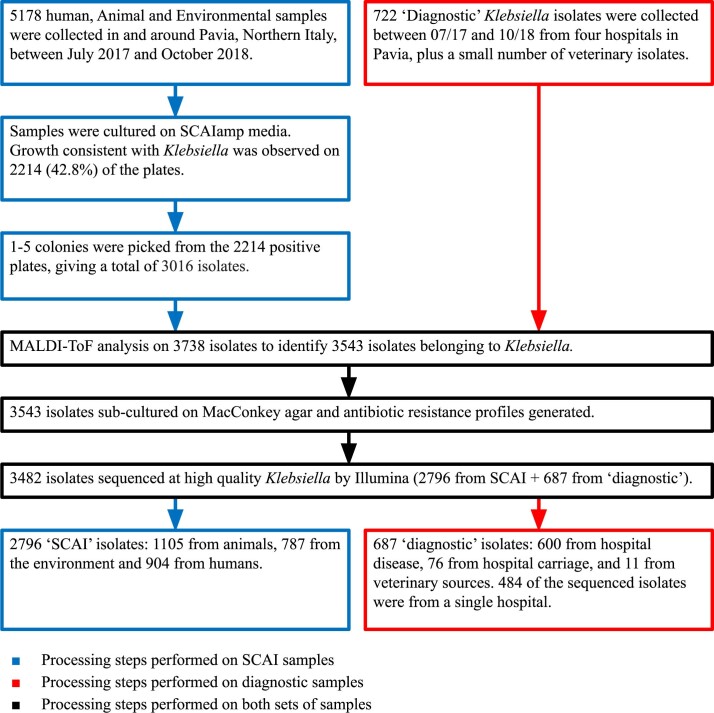
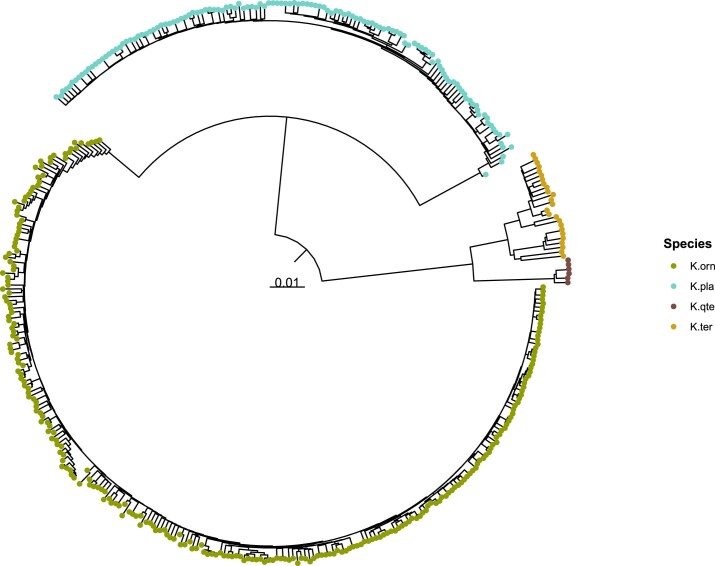
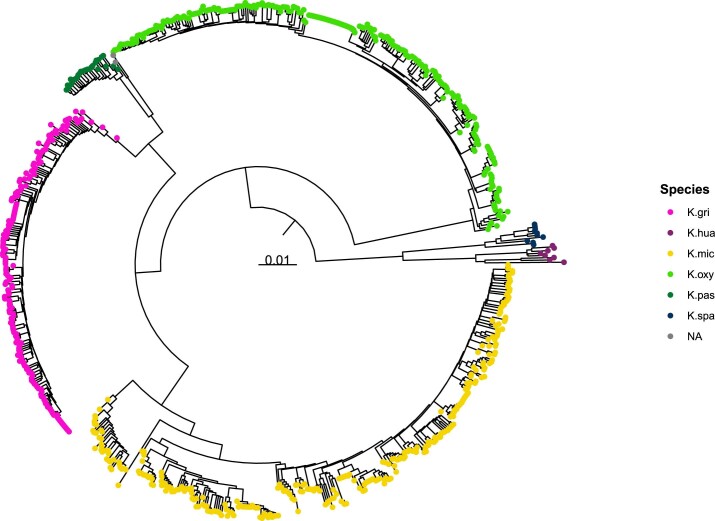
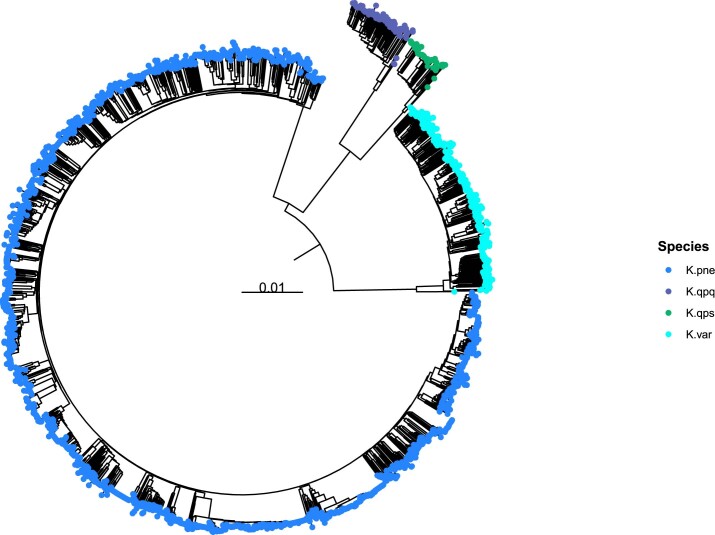
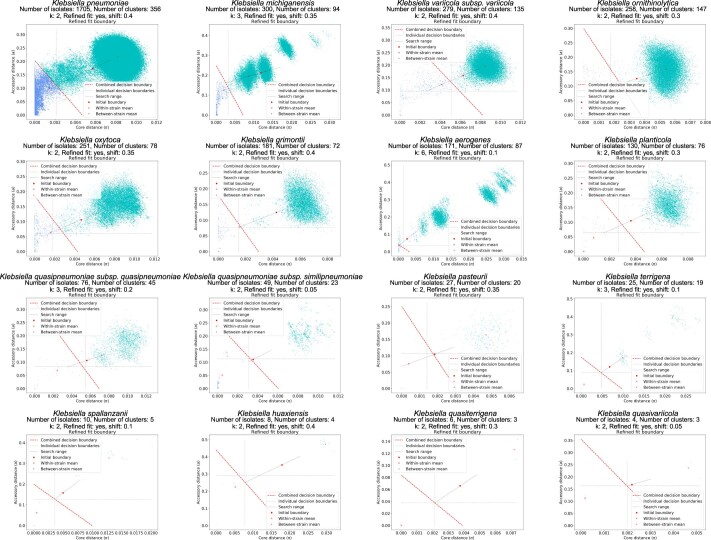
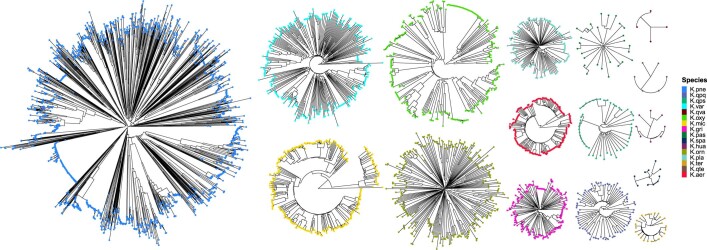
The Klebsiella group, found in humans, livestock, plants, soil, water and wild animals, is genetically and ecologically diverse. Many species are opportunistic pathogens and can harbour diverse classes of antimicrobial resistance genes. Healthcare-associated Klebsiella pneumoniae clones that are non-susceptible to carbapenems can spread rapidly, representing a high public health burden. Here we report an analysis of 3,482 genome sequences representing 15 Klebsiella species sampled over a 17-month period from a wide range of clinical, community, animal and environmental settings in and around the Italian city of Pavia. Northern Italy is a hotspot for hospital-acquired carbapenem non-susceptible Klebsiella and thus a pertinent setting to examine the overlap between isolates in clinical and non-clinical settings. We found no genotypic or phenotypic evidence for non-susceptibility to carbapenems outside the clinical environment. Although we noted occasional transmission between clinical and non-clinical settings, our data point to a limited role of animal and environmental reservoirs in the human acquisition of Klebsiella spp. We also provide a detailed genus-wide view of genomic diversity and population structure, including the identification of new groups.


Conflict of interest statement

The authors declare no competing interests.

Figures

Fig. 1
Fig. 1. Summary of the sampling effort.
a, Geographical summary of the whole sampling area. b, More detail of the region around the city of Pavia as highlighted by the red box in a. The size of each point indicates the number of samples and the colours represent the source. c, Timeline of the sampling effort broken down by source. Further details are hidden to preserve anonymity.
Fig. 2
Fig. 2. Phylogenetic tree with metadata and sample and source distributions.
a, Maximum-likelihood phylogenetic tree constructed from core genes, coloured by species, with the SPECs shown. Only one isolate from each species is shown as this tree is intended to show the distances between species. b, Neighbour-joining phylogenetic tree constructed from pairwise Mash distances between all isolates, coloured by species, with the SPECs shown. The metadata rings show sources (inner rings) and resistance and virulence scores (outer rings). c, Bar plot showing the number of sequenced samples from each species. The dark bars show samples from SCAI media and the transparent ones show diagnostic samples. d, Bar plot showing the number of sequenced samples from each high-level source. The dark bars show samples from SCAI media and the transparent ones show diagnostic samples. With the following exceptions, the three-letter species abbreviations used are explained in the main text: Klebsiella quasipneumoniae subsp. similipneumoniae (K. qps); Klebsiella planticola (K. pla).
Fig. 3
Fig. 3. Clonality and population structure.
a, Composition of the eight most common species as determined by SC frequencies. For each species, the isolates were grouped by SC and the SCs were ranked by their frequencies as a proportion of the dataset (top 30 SCs shown). b, The number of unique SCs as isolates were sampled. Accumulation curves were produced by randomizing the order of the isolates and counting the SCs, and then repeating this 100 times (mean values plotted). The dashed grey line indicates the x = y line. c, Distribution of pairwise core genome distances for each species. The distances were estimated using PopPunk and the points were arranged in the x direction by density to show their distributions.
Fig. 4
Fig. 4. The distribution of species according to source.
Only Klebsiella samples from the SCAI dataset (n = 2,795) are shown and 23 of these samples were removed either because they were from very poorly sampled sources (21) or could not be confidently assigned to a species (2). The rows represent species delimited according to SPECs and the columns represent sources delimited according to source categories. The grey shaded rows at the bottom of the table give the total number of positive samples for the corresponding source, and below, the total number of samples for that source. The grey shading reflects the percentage prevalence from each source. The number of positive samples are shown for each species from each source and a blank cell indicates zero positive samples. The red shading shows the relative enrichment of each species from each source, given the overall prevalence from that source and assuming a null hypothesis whereby all species would be equally likely to be observed from any given source. The dark red and blue borders show those categories where the number of samples is significantly higher or lower than expected, respectively, as determined by a permutation test. The bar plot to the right shows the number of samples from each species and the total sampling effort.
Fig. 5
Fig. 5. Distribution of resistance and virulence genes according to species and source.
a, Resistance genes were identified and grouped into levels 0–3 by Kleborate. b, Virulence genes were identified and grouped into levels 0–5 by Kleborate. The area of the circles is proportional to the number of isolates and the text shows the number of isolates. The shading shows the proportion of isolates from a given species and source, which correspond to a given resistance or virulence level.
Fig. 6
Fig. 6. Transmission heatmaps and networks.
a,b, Heatmaps showing the number of transmission events between each pair of sources, as determined by SNP thresholds of 1 (a) and 10 (b). The shading is proportional to the number of events and does not account for the number of samples from each source. c,d, Transmission networks showing the number of transmission events between each pair of sources, using the same data as in the heatmaps in a (c) and b (d), except that within-source events are not shown. The nodes represent the sources and the area of the node is proportional to the number of samples from that source. The edges show the number of transmission events and the thickness of the edge is proportional to the number of events between the two sources.
Extended Data Fig. 1
Extended Data Fig. 1. Summary of the sampling and subsequent methodology.
Flowchart showing the number of initial samples taken, and the number of remaining samples after each processing step.
Extended Data Fig. 2
Extended Data Fig. 2. K.orn SPEC phylogeny.
Circular phylogenetic tree for K. ornithinolytica and related species within the species complex K.orn SPEC. The tree was generated from Mash distances using the neighbour-joining method.
Extended Data Fig. 3
Extended Data Fig. 3. K.oxy SPEC phylogeny.
Circular phylogenetic tree for K. oxytoca and related species within the species complex K.oxy SPEC. The tree was generated from Mash distances using the neighbour-joining method.
Extended Data Fig. 4
Extended Data Fig. 4. K.pne SPEC phylogeny.
Circular phylogenetic tree for K. pneumoniae and related species within the species complex K.pne SPEC. The tree was generated from Mash distances using the neighbour-joining method.
Extended Data Fig. 5
Extended Data Fig. 5. Lineage assignment with PopPunk.
PopPunk was used to divide each species into sequence clusters (SCs). For each species, the number of components to fit in the mixture model (k) was chosen based on the scatter plot of core and accessory distances. The model was then fit, and the boundary refined using an iterative process of moving the boundary and reassessing the network features. In all cases the core boundary was used to define the clusters. The number of isolates, number of SCs, model K, and core distance boundaries are shown for each species.
Extended Data Fig. 6
Extended Data Fig. 6. Phylogenies of individual species.
Core genome phylogenetic trees for each species were generated using the neighbour-joining method.
Extended Data Fig. 7
Extended Data Fig. 7. The distribution of resistance genes according to species and source.
Detailed breakdown of the distribution of all resistance gene classes identified by Kleborate by species and source. The area of the circles is proportional to the number of isolates, and the text shows the number of isolates. The shading shows the proportion of isolates from a given species and source which harbour at least one gene from that class.
Extended Data Fig. 8
Extended Data Fig. 8. Alignment of blaVIM plasmids.
Alignment of the MN783743 and CP034084 reference plasmids with the contigs identified in our data as carrying the blaVIM gene in IncA/C plasmids. Arrows represent the blaVIM gene (turquoise), conjugal transfer system (green), resistance genes (red), mobile elements (yellow), hypothetical proteins (plum), replication protein repA (orange), integrases (dark blue) and the mercury resistance operon (pink). The three bracketed SPARK_315 SCAI carriage isolates were obtained from the same faecal sample from an outpatient in Hospital 1 (H1). The plasmid was found in two hospitals (H1 and H2). Two of these (SPARK_315_C1 and SPARK_315_C2) were members of the same clonal lineage (SC152_ST2418), whilst SPARK_315_C3 was an unrelated isolate related to the hypervirulent lineage ST23 (SC299_ST23-2LV). The plasmids are however essentially identical within all three isolates (which is identical to CP034084), indicating within-patient transfer. SPARK_355_C1 is a diagnostic carriage sample from a rectal swab from a different inpatient in Hospital 1 corresponding to lineage K.pne_SC66_ST253 and also contains the same VIM plasmid. SPARK_1466_C1 also contains a very similar plasmid. This isolate corresponds to a different lineage (K.pne_SC195_ST606) and is a diagnostic isolate from a urine sample from inpatient in Hospital 2. SPARK_1816_C1 is a K.mic diagnostic isolate (SC14) from a rectal swab from inpatient in Hospital 1 and contains also contains this plasmid. Finally, SPARK_1652_C1 is a K.gri diagnostic isolate (SC44), also from a urine sample from an outpatient in hospital 1. This isolate contains the same plasmid, but with a deletion near the resistance cassette.
Extended Data Fig. 9
Extended Data Fig. 9. Comparison of iuc3-containing contigs from K.pne.
Comparison of short-read contigs from K.pne isolates from pigs harbouring iuc3 in this study. The ST and position of iuc3 are shown. Contigs were compared with the Artemis Comparison Tool (ACT); sections of similarity of >500 bp are shown.
Extended Data Fig. 10
Extended Data Fig. 10. Transmission clusters.
Networks were used to identify transmission clusters using multiple SNP thresholds. To ensure that the estimates were conservative, only one event was counted for each pair of sources that satisfied the threshold in each component of the network. These events are denoted by the red edges. Only one SC is shown as an example of the method.

Similar articles

Cited by

References

    1. Tacconelli E, et al. Discovery, research, and development of new antibiotics: the WHO priority list of antibiotic-resistant bacteria and tuberculosis. Lancet Infect. Dis. 2018;18:318–327. doi: 10.1016/S1473-3099(17)30753-3. - DOI - PubMed
    1. Knothe H, Shah P, Krcmery V, Antal M, Mitsuhashi S. Transferable resistance to cefotaxime, cefoxitin, cefamandole and cefuroxime in clinical isolates of Klebsiella pneumoniae and Serratia marcescens. Infection. 1983;11:315–317. doi: 10.1007/BF01641355. - DOI - PubMed
    1. Yigit H, et al. Novel carbapenem-hydrolyzing β-lactamase, KPC-1, from a carbapenem-resistant strain of Klebsiella pneumoniae. Antimicrob. Agents Chemother. 2001;45:1151–1161. doi: 10.1128/AAC.45.4.1151-1161.2001. - DOI - PMC - PubMed
    1. Wilson H, Török ME. Extended-spectrum β-lactamase-producing and carbapenemase-producing Enterobacteriaceae. Microb. Genom. 2018;4:e000197. - PMC - PubMed
    1. David S, et al. Epidemic of carbapenem-resistant Klebsiella pneumoniae in Europe is driven by nosocomial spread. Nat. Microbiol. 2019;4:1919–1929. doi: 10.1038/s41564-019-0492-8. - DOI - PMC - PubMed

Publication types