. 2022 Dec;23(12):1714-1725.
doi: 10.1038/s41590-022-01349-1. Epub 2022 Nov 21.

Mucosal-associated invariant T cells restrict reactive oxidative damage and preserve meningeal barrier integrity and cognitive function

Affiliations

Mucosal-associated invariant T cells restrict reactive oxidative damage and preserve meningeal barrier integrity and cognitive function

Yuanyue Zhang et al. Nat Immunol. 2022 Dec.

Abstract

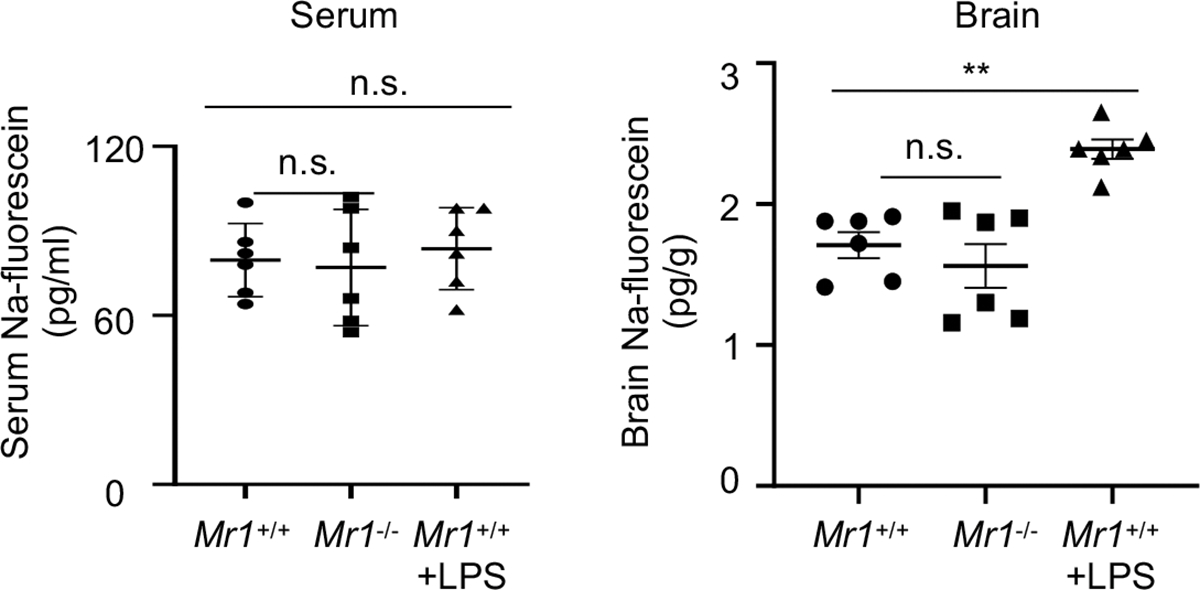
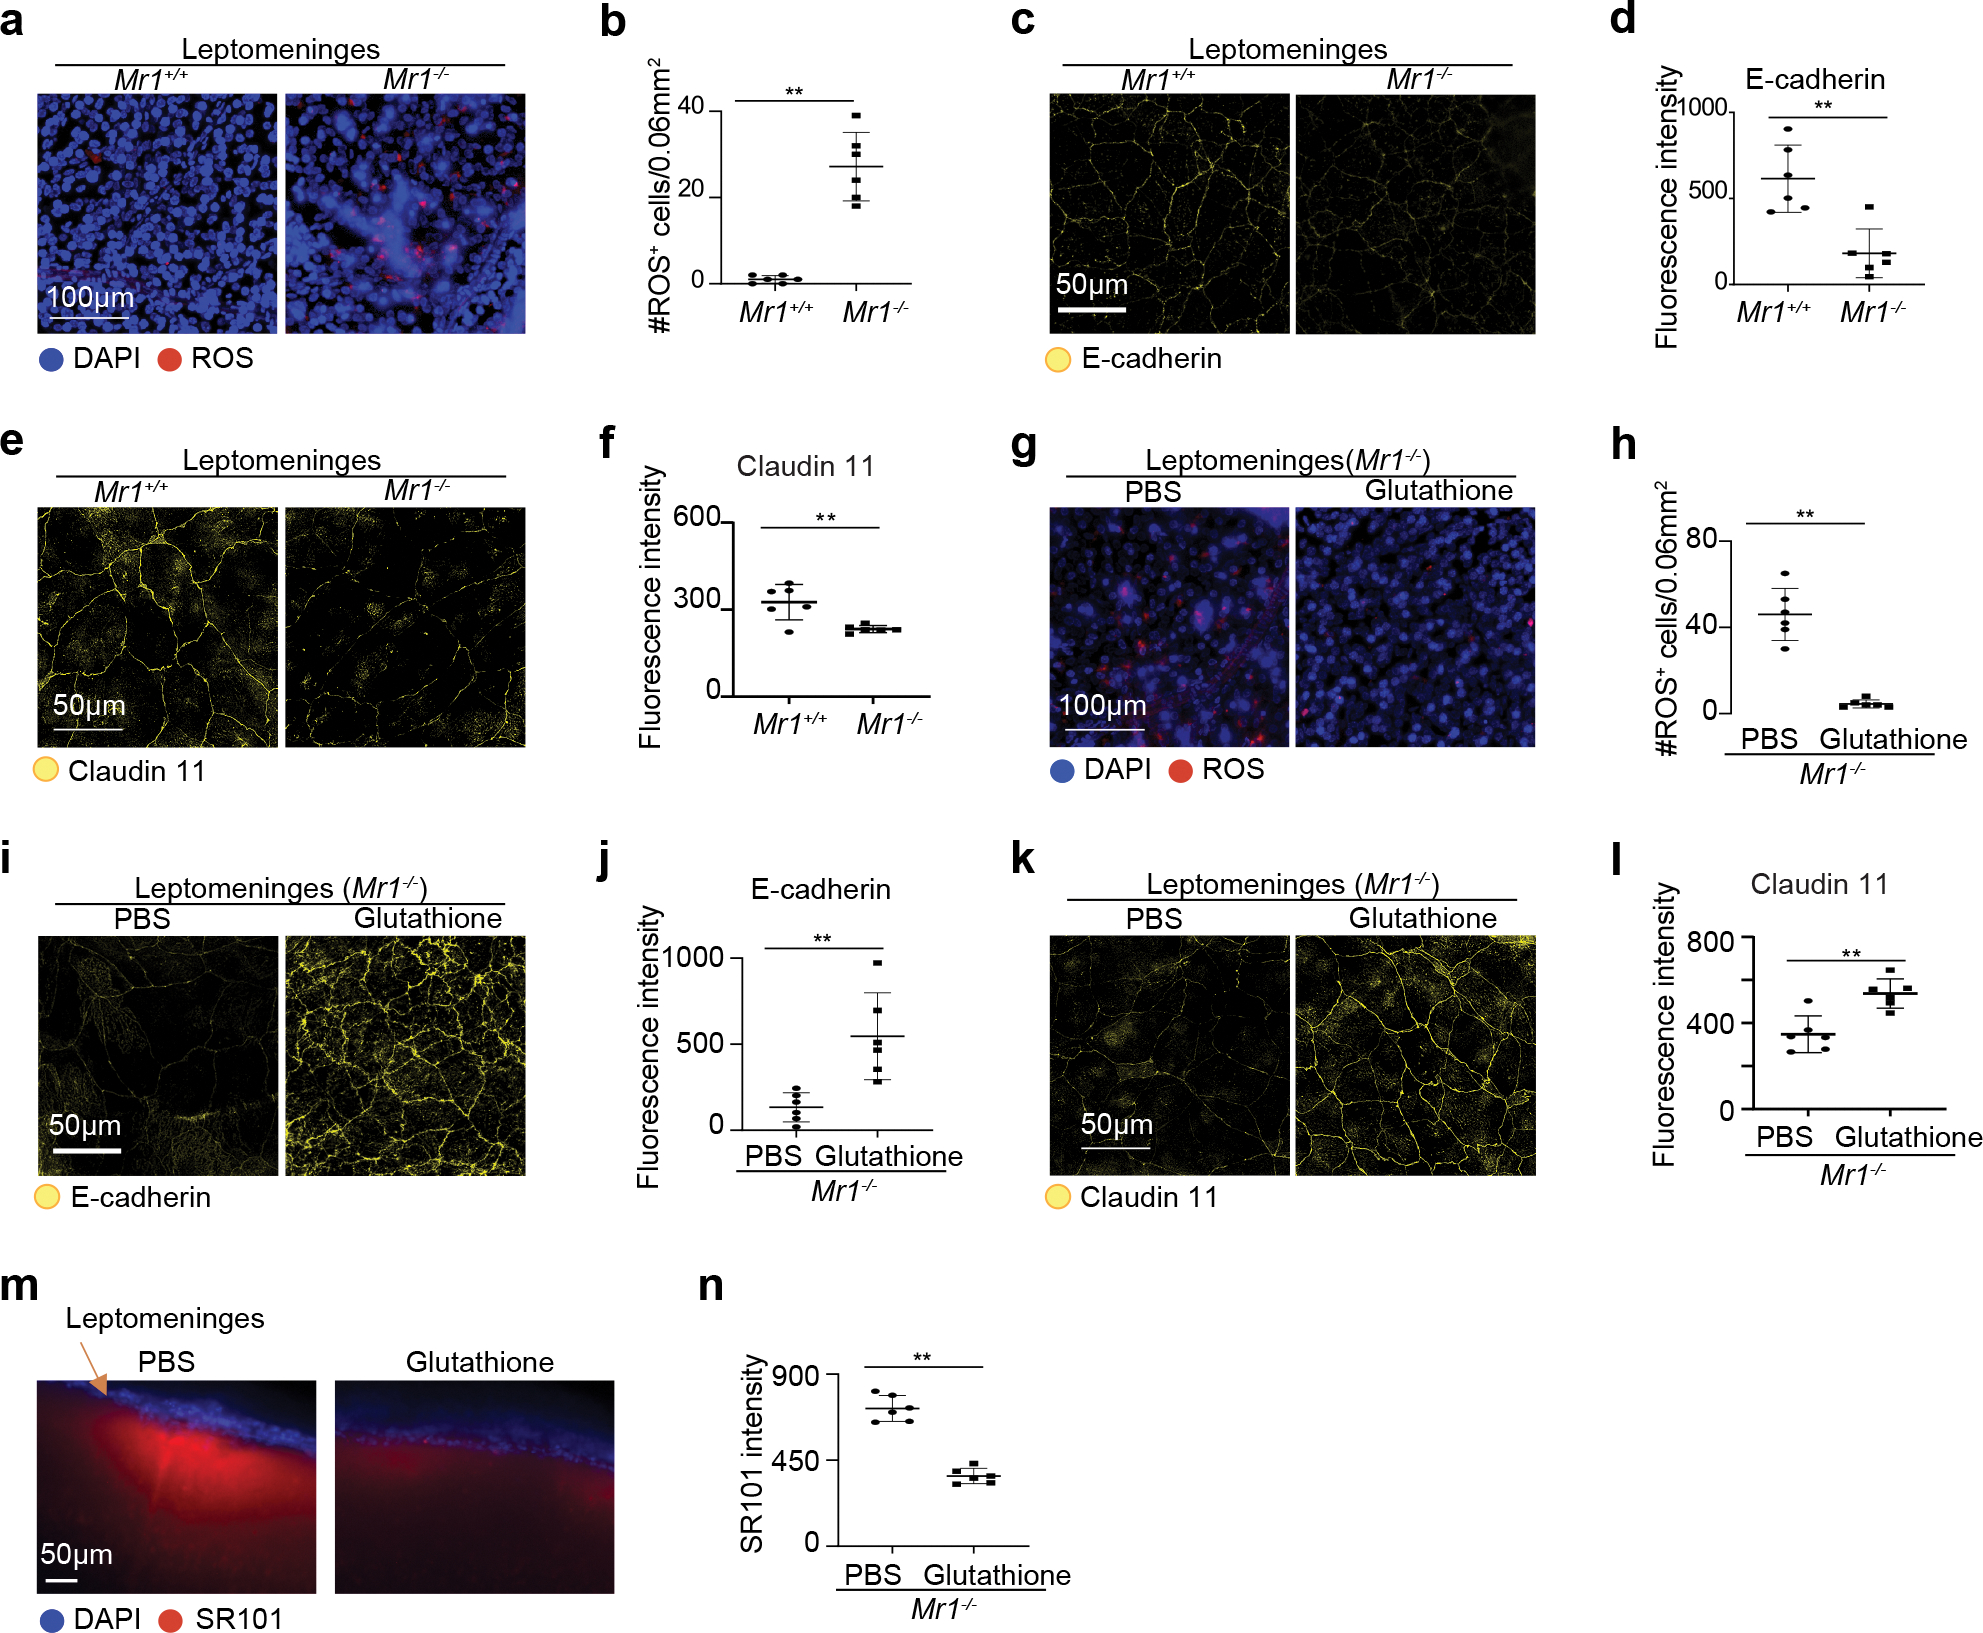
Increasing evidence indicates close interaction between immune cells and the brain, revising the traditional view of the immune privilege of the brain. However, the specific mechanisms by which immune cells promote normal neural function are not entirely understood. Mucosal-associated invariant T cells (MAIT cells) are a unique type of innate-like T cell with molecular and functional properties that remain to be better characterized. In the present study, we report that MAIT cells are present in the meninges and express high levels of antioxidant molecules. MAIT cell deficiency in mice results in the accumulation of reactive oxidative species in the meninges, leading to reduced expression of junctional protein and meningeal barrier leakage. The presence of MAIT cells restricts neuroinflammation in the brain and preserves learning and memory. Together, our work reveals a new functional role for MAIT cells in the meninges and suggests that meningeal immune cells can help maintain normal neural function by preserving meningeal barrier homeostasis and integrity.


Conflict of interest statement

Competing Interests

The authors declare no competing interests.

Figures

Extended Data Figure 1.
Extended Data Figure 1.. Expression of transcription factors by meningeal MAIT cells.
Feature plots depicting expression for the indicated genes by scRNA-seq analysis with meningeal MAIT cells and CD4 and CD8 T cells in 7-month-old Mr1+/+ and Mr1−/− mice. Data are from 6 mice pooled per group.
Extended Data Figure 2.
Extended Data Figure 2.. Validation of adoptive transfer of MAIT cells.
a, Representative flow cytometry profiles depict gating strategies to sort donor MAIT cells for adoptive transfer experiments. Meningeal tissue was pooled, with tissue from 5 mice in 1ml of Liberase digestion buffer. Digested tissue from up to 60 mice was pooled per sample, followed by staining with MR1 tetramers and surface antibodies to identify MAIT cells. Events of around 8% of the sample (equivalent to around 5 mice) were collected in the representative flow cytometry profiles. CD3 and TCRβ antibodies were not included for purification of MAIT cells for adoptive transfer. Donor MAIT cells were identified as CD45+ Thy1.2hiIL-18RhiMR1-tetramer+cells. b, Representative profiles of MAIT cells in the meninges of 7-month-old Mr1−/− mice that received adoptive transfer of PBS or MAIT cells. Plots were pre-gated on CD45+CD11bB220NK1.1 Thy1.2+ cells. c, Numbers of meningeal MAIT cells per mouse in the meninges and in the small intestinal laminal propria (SILP) of recipient mice at the indicated time points after adoptive transfer. d, Percentages of MAIT cells in the total T cell subset in the dura/arachnoid meningeal tissue obtained from inner calvaria and in the leptomeninges of recipient mice at 6 months post adoptive transfer. Error bars = Mean ± SE. Data are from 3 independent experiments, 2–5 recipient mice pooled in one sample for each experiment (b-d). Each data point indicates one independent experiment (c, d).
Extended Data Figure 3.
Extended Data Figure 3.. MAIT cells repress ROS accumulation and preserve expression of junctional molecules in dura/arachnoid meningeal tissue isolated from inner calvaria.
a, Representative profile of Reactive Oxygen Species (ROS) in the dura/arachnoid meningeal tissue obtained from the inner calvaria of 7-month-old Mr1+/+ and Mr1−/− mice with intra-cisterna magna administration of CellROX Green Reagent. b, Numbers of ROS positive cells in the meningeal tissue. c, Representative imaging profile of ROS in the dura/arachnoid meningeal tissue of 7-month-old Mr1−/− mice that received adoptive transfer of PBS or MAIT cells. d, Numbers of ROS+ cells in the meningeal tissue in Mr1−/− mice that received adoptive transfer of PBS or MAIT cells. e, Representative imaging profile depicting expression of CD31 and E-cadherin in dura/arachnoid meningeal tissue in 7-month-old Mr1+/+ and Mr1−/− mice, with i.c.m. injection of fluorescence conjugated CD31 and E-cadherin antibodies. f, Fluorescence intensity of E-cadherin in the meninges of Mr1+/+ and Mr1−/− mice. g, Representative imaging profile depicting expression of CD31 and E-cadherin in dura/arachnoid meningeal tissue in 7-month-old Mr1−/− mice that received adoptive transfer of PBS or MAIT cells. h, Fluorescence intensity of E-cadherin in the meninges of Mr1−/− mice that received adoptive transfer of PBS or MAIT cells. i, Representative profile of ROS detection in meninges of Mr1−/− mice treated with Glutathione or PBS control. j, Numbers of ROS positive cells in 7-month-old Mr1−/− mice treated with Glutathione or PBS control. k, Representative imaging profile depicting expression of CD31 and E-cadherin in dura/arachnoid meningeal tissue in 7-month-old Mr1−/− mice treated with Glutathione or PBS control. l, Fluorescence intensity of E-cadherin in dura/arachnoid meningeal tissue in Mr1−/− mice treated with Glutathione or PBS control. Error bars = Mean ± SE. Data are from 6 mice per group, representative of 2 independent experiments. **P < 0.01 using two-sided Student’s t-test; exact P values are provided in the source data.
Extended Data Figure 4.
Extended Data Figure 4.. Mr1−/− mice do not exhibit significant defects in BBB integrity.
Na-fluorescein concentrations in the serum and brain of 7-month-old mice with intraperitoneal administration of Na-fluorescein. Error bars = Mean ± SE; Data are from 6 mice per group, 2 independent experiments. **P < 0.01, n.s = not statistically significant (P > 0.05) using two-sided ANOVA with Dunnett’s correction; exact P values are provided in the source data.
Extended Data Figure 5.
Extended Data Figure 5.. Myeloid cells and astrocytes in the hippocampus of Mr1−/− mice.
a, UMAP analysis for the entire population of live cells isolated from the hippocampus of 7-month-old Mr1+/+ and Mr1−/− mice. b, Representative flow cytometry profiles for monocytes and neutrophils in the hippocampus of 7-month-old Mr1+/+ and Mr1−/− mice. Lungs from wild-type mice were used as a positive control for gating monocytes and neutrophils. c, Numbers of monocytes and neutrophils in the hippocampus of 7-month-old Mr1+/+ and Mr1−/− mice. d, Representative profile of immunofluorescence staining of GFAP in the HP DG region of 7-month-old Mr1+/+ and Mr1−/− mice. e, Numbers of astrocytes (GFAP+ cells) in the HP DG regions. f, UMAP analysis of astrocytes in the hippocampus of 7-month-old Mr1+/+ and Mr1−/− mice. scRNA-seq was performed with FACS-sorted live cells in the hippocampus. Gating strategy to sort live cells for scRNA-seq is shown in Supplementary Figure 2. UMAP profiles for total live cells in the hippocampus are provide in a. The data subset for microglia was created using the “subset” function of Seurat. g, Feature plots depict expression of Il33 and Gfap in astrocytes. h, Genes highly expressed by each astrocyte subset. i. Proportions of each astrocyte subset in Mr1+/+ and Mr1−/− mice. j, Differentially expressed genes (DEG) in the total astrocyte population and in each astrocyte subset, between Mr1+/+ and Mr1−/− mice. k, Feature plots depict expression of Uba52 in astrocytes. Error bars = Mean ± SE. Data are from 6 mice per group, pooled from two independent experiments (b-e), or are from 6 mice pooled per group (a, f-k). *P < 0.05, **P < 0.01, n.s = not statistically significant (P > 0.05) using two-sided Student’s t-test (c, e), or two-sided Wilcoxon rank sum test (k); exact P values are provided in the source data (c, e) or Supplementary Table 11.
Extended Data Figure 6.
Extended Data Figure 6.. Behavior tests results of Mr1−/− mice and control wild-type mice.
a, Total distance travelled, and percentages of time spent in the central zone, the corner, and the peripheral zone in Open Field test, by 7-month-old Mr1+/+ and Mr1−/− mice. b, Percentages of time spent in the closed arm in Elevated Plus Maze test, by 7-month-old Mr1+/+ and Mr1−/− mice. c, Percentages of time spent in the novel arms in Y-maze test, by 7-month-old Mr1−/− mice that received adoptive transfer of control CD4/CD8 T cells or PBS control. d, Escape latency in the 4 day training period of Water Maze test, by 7-month-old Mr1−/− mice that received adoptive transfer of control CD4/CD8 T cells or PBS control. e, Entries to the target zone, latency to the target zone, and Percentage of time spent in the target quadrant, in day 5 probe trial of Water Maze Test, by 7-month-old Mr1−/− mice that received adoptive transfer of control CD4/CD8 T cells or PBS control. f, Fluorescence intensities of E-cadherin in the leptomeninges of 7-month-old Mr1−/− mice that received adoptive transfer of control CD4/CD8 T cells or PBS control. g, Fluorescence intensities of E-cadherin in the leptomeninges of 7-month-old Mr1−/− mice that received adoptive transfer of MAIT T cells or PBS control. h, Percentages of time spent in the novel (N) and familiar (F) arms in Y-maze test, by young 5-week-old Mr1+/+ and Mr1−/− mice. i, Escape latency in Water Maze 4-day training, by 5-week-old Mr1+/+ and Mr1−/− mice. Error bars = Mean ± SE. Data are from 9 mice per group, representative of 2 independent experiments (a-e) or are from 5 mice per group, representative of 2 independent experiments (f, g), or are from 10 mice per group, representative of 2 independent experiments (h.i.). *P < 0.05, n.s = not statistically significant (P > 0.05) using two-sided Student’s t-test; exact P values are provided in the source data.
Figure 1.
Figure 1.. MAIT cells are present in the meninges.
a, Representative flow cytometry plots of MAIT cells in the meninges and choroid plexus (CP) of C57BL/6 mice of different ages. Plots were pre-gated on CD45+CD11bB220NK1.1 Thy1.2+ cells. Gating strategy is shown in Supplementary Figure 1a. b, Numbers of MAIT cells at different regions of the brain in mice of different ages. 6w, 6 weeks; 7m, 7 months; 18m, 18 months. c, Representative flow cytometry plots of MAIT cells in the meninges of 7-month-old Mr1+/+ and Mr1−/− mice. d, Numbers of MAIT cells in the meninges of 7-month-old Mr1+/+ and Mr1−/− mice. e, Representative histogram plots depict expression of the indicated genes in meningeal MAIT cells (CD3+ MR1-tetramer+) and non-MAIT T cells (CD3+ MR1-tetramer). f, Representative flow cytometry plots of MAIT cells in the dura/arachnoid meningeal tissue isolated from the inner calvaria, or in the leptomeninges. g, Frequencies of MAIT cells in the dura/arachnoid meningeal tissue isolated from the inner calvaria, or in the leptomeninges. Error bars = Mean ± SE. Data are from 6 mice per group, pooled from 2 independent experiments (a,b), or from 10 mice per group, pooled from 2 independent experiments (c,d), or from 4 mice pooled per sample per experiment, representative of 3 independent experiment (e), or from 6 samples per group, 2 mice pooled per sample, pooled from 2 independent experiments (g). *P < 0.05, **P < 0.01 using two-sided ANOVA (b) or two-sided Student’s t-test (d, g); exact P values are provided in the source data.
Figure 2.
Figure 2.. MAIT cells express genes encoding secreted antioxidant molecules.
a, MAIT cells, CD4+ T cells, CD8+ T cells were sorted from meninges of 7-month-old C57BL/6 mice, and mixed at 1:4:4 ratio. UMAP plots of scRNA-seq analysis. Gating strategy to sort meningeal MAIT cells and CD4 and CD8 T cells is shown in Supplementary Figure 1. b, Ingenuity Pathway Analysis for the Free Radical Scavenging gene network. c, Feature plots depicting expression of the indicated genes. d, Violent plots depicting expression of the indicated genes. e, Dot plots depicting the percentage of cells expressed, and the expressional level of the indicated genes. f, UMAP analysis for previously published scRNA-seq with MAIT cells sorted from different organs. g, Feature plots depicting expression of Selenop and Tfh1 in MAIT cells sorted from different organs. h, Violent plots depicting expression of Selenop and Tfh1 in MAIT cells sorted from different organs. Data are from 6 mice pooled per group (a-g). **P < 0.01 using a two-sided Wilcoxon rank sum test; exact P values are provided in the Supplementary Table 1.
Figure 3.
Figure 3.. MAIT cells have high levels of reactive oxidative species (ROS), and expression of anti-oxidant molecules is required for optimal survival and growth of MAIT cells.
a, Representative flow cytometry profile depicting ROS levels in meningeal MAIT cells, γδT cells, CD4+ T cells, and CD8+ T cells, detected by CellROX reagents. b, Mean fluorescence intensity (MFI) of ROS levels detected by CellROX reagents. c, mRNA levels of anti-oxidant genes Selenop and Fth1 in sorted meningeal MAIT cells, γδT cells, CD4+ T cells, and CD8+ T cells. Data were normalized to Gapdh. d, Sorted MAIT cells were cultured for 5 days in the presence of IL-7 alone, or IL-7, IL-12 and IL-18. Growth was calculated as number of cells after 5 days of culture, per cell input. e, mRNA levels of Selenop, Fth1, and Ifng in cells cultured with IL-7 alone, or IL-7, IL-12 and IL-18. f, mRNA levels of Selenop, Fth1, and cytokine genes in cells cultured in the presence of plate-bound anti-CD3 and anti-CD28 for 48 hours. g, Sorted MAIT cells were cultured with IL-7, IL-12 and IL-18, and double transduced with lenti-CRISPRv2-GFP-gRNA1 and lenti-CRISPRv2-hCD25-gRNA2 gene knockout vectors targeting Selenop or non-target control (NTC). GFP+hCD25+ cells were sorted and cultured for 5 additional days, following by Q-PCR analysis for examination of gene expression. h, Growth was calculated as number of cells appeared in culture per cell input over 5 days of culture, for MAIT cells transduced with lenti-CRISPRv2 vectors targeting Selenop or NTC controls. i, Representative profiles of Annexin V for MAIT cells transduced with lenti-CRISPRv2 vectors targeting Selenop or NTC controls, after 5 days of culture. j, Percentages of Annexin V+ cells for cultured MAIT cells transduced with lenti-CRISPRv2 vectors targeting Selenop or NTC controls, after 5 days of culture. Error bars = Mean ± SE. Q-PCR data were normalized to Gapdh, and relative mRNA levels (fold changes) were calculated for each individual gene (c, e, f, g). Data are from 6 mice per group, representative of 2 independent experiments (a, b), or are from three independent experiments, 10 mice (c) or 20 mice (d-f) pooled per experiment, or are from 4 independent experiments, 30 mice pooled per group per experiment (g-j). *P < 0.05, **P < 0.01 using two-sided ANOVA with Dunnett’s correction (b, c) or two-sided ANOVA with Turkey’s correction (f) or two-sided Student’s t-test (d, e, g, h, j); exact P values are provided in the source data.
Figure 4.
Figure 4.. MAIT cells help preserve meningeal barrier integrity.
a, Coronal brain vibratome sections were obtained from 7-month-old Mr1+/+ and Mr1−/− mice with transcranial administration of SR101. Representative imaging of sections at 300μM to 600μM lateral to bregma. DAPI staining indicated dead cells at leptomeninges. b, Quantification of fluorescence intensity of SR101 at 50μM below the leptomeningeal cells in the brain vibratome sections of 7-month-old mice. c, Coronal brain vibratome sections were obtained from 5-week-old Mr1+/+ and Mr1−/− mice with transcranial administration of SR101. Representative imaging of sections at 300μM to 600μM lateral to bregma. d, Quantification of fluorescence intensity of SR101 at 50μM below the leptomeningeal cells in the brain vibratome sections of 5-week-old mice. e, MAIT cells were transferred to 6-week-old Mr1−/− mice. 6 months after adoptive transfer, coronal brain vibratome sections were obtained in mice with transcranial administration of SR101. f, Quantification of fluorescence intensity of SR101 at 50μM below the leptomeningeal cells in the brain vibratome sections of 7-month-old Mr1−/− mice with or without adoptive transfer of MAIT cells. Error bars = Mean ± SE. Data are from 6 mice per group, representative of 2–3 independent experiments. **P < 0.01 using two-sided Student’s t-test; exact P values are provided in the source data.
Figure 5.
Figure 5.. MAIT cells repress ROS accumulation and preserve expression of junctional molecules by leptomeningeal cells.
a, Representative profile of Reactive Oxygen Species (ROS) on wholemount leptomeningeal tissue of 7-month-old Mr1+/+ and Mr1−/− mice with intra-cisterna magna administration of CellROX Green Reagent. b, Numbers of ROS positive cells in the leptomeningeal tissue. c, Representative imaging profile depicting expression of E-cadherin in leptomeningeal tissue in 7-month-old Mr1+/+ and Mr1−/− mice with i.c.m. injection of fluorescence conjugated E-cadherin antibodies. d, Fluorescence intensity of E-cadherin in the leptomeninges of Mr1+/+ and Mr1−/− mice. e, Representative imaging profile depicting expression of Claudin11 in the leptomeningeal tissue in 7-month-old Mr1+/+ and Mr1−/− mice. f, Fluorescence intensity of Claudin11 in the leptomeningeal tissue of Mr1+/+ and Mr1−/− mice. g, Representative imaging profile of ROS on the leptomeninges of 7-month-old Mr1−/− mice that received treatment of Glutathione or PBS control. h, Numbers of ROS positive cells in the leptomeningeal tissue in Mr1−/− mice that received treatment of Glutathione or PBS control. i, Representative imaging profile depicting expression of E-cadherin in leptomeningeal tissue in 7-month-old Mr1−/− mice that received treatment of glutathione or PBS control. j, Fluorescence intensity of E-cadherin in the leptomeningeal tissue of Mr1−/− mice that received treatment of glutathione or PBS control. k, Representative imaging profile depicting expression of Claudin11 in the leptomeningeal tissue in 7-month-old Mr1+/+ and Mr1−/− mice that received treatment of glutathione or PBS control. l, Fluorescence intensity of Claudin11 in the leptomeningeal tissue of Mr1−/− mice that received treatment of glutathione or PBS control. m, Representative imaging profiles of coronal brain vibratome sections from 7-month-old Mr1−/− mice with transcranial administration of SR101, with treatment of Glutathione or PBS control. n, Intensity of SR101 at 50 μM below the meningeal cells. Error bars = Mean ± SE. Data are from 6 mice per group, representative of 2 independent experiments. **P < 0.01 using two-sided Student’s t-test; exact P values are provided in the source data.
Figure 6.
Figure 6.. MAIT cells repress microgliosis at homeostasis.
a, Representative profile of immunofluorescence staining of Iba-1 in the cortex and hippocampus (HP) region of 7-month-old Mr1+/+ and Mr1−/− mice. b, Numbers of microglia (Iba-1+ cells) in the cortex and hippocampus (HP) region of mice. c, UMAP analysis of microglia in the hippocampus of 7-month-old Mr1+/+ and Mr1−/− mice. scRNA-seq was performed with FACS-sorted live cells in the hippocampus, following papain-based enzymatic dissociation of the hippocampus tissue. Gating strategy to sort live cells for scRNA-seq is shown in Supplementary Figure 2. UMAP profiles for total live cells in the hippocampus are provide in Extended Data Figure 2a. The data subset for microglia was created using the “subset” function of Seurat. d, Proportions of each microglia subset in the hippocampus of 7-month-old Mr1+/+ and Mr1−/− mice. e, Dot plots depict expression of ribosome biogenesis genes that were highly expressed by the M-a microglia subset. f, Feature plots depict expression of Uba52 in each microglia subset in Mr1+/+ and Mr1−/− mice. g, mRNA levels for the indicates genes in microglia that were sorted from the hippocampus of 7-month-old Mr1+/+ and Mr1−/− mice, following non-enzymatic dissociation of the hippocampus tissue. Data were normalized to Gapdh. h, Numbers of microglia in the cortex and HP region of mice treated with glutathione or PBS control. Error bars = Mean ± SE. Data are from 14 mice per group, pooled from 3 independent experiments (a, b), or are from 6 mice pooled per group (c-h), or are from 6 mice per group, pooled from 2 independent experiments (i.j.). *P < 0.05, **P < 0.01 using two-sided Student’s t-test (b, g, h.), or two-sided Wilcoxon rank sum test (f); exact P values are provided in the source data (b,g,h,) or in Supplementary Tables 4–6 (f).
Figure 7.
Figure 7.. MAIT cells are required for optimal cognitive function at homeostasis.
a, Percentages of entries into the familiar (F) or novel (N) arm in Y-maze test by 7-month-old Mr1+/+ and Mr1−/− mice. b, Escape latencies in each day of the 4-day training period in Water Maze Test, by Mr1+/+ and Mr1−/− mice. c, Numbers of entries into the target zone, percentages of time spent in the target quadrant, and escape latencies to the target zone in the day 5 probe trial of Water Maze Test, by Mr1+/+ and Mr1−/− mice. d, Percentages of entries into the familiar (F) or novel (N) arm in Y-maze test by 7-month-old Mr1−/− mice that received adoptive transfer of PBS or MAIT cells. e, Escape latencies in each day of the 4-day training period in Water Maze Test, by Mr1−/− mice that received adoptive transfer of PBS or MAIT cells. f, Numbers of entries into the target zone, percentages of time spent in the target quadrant, and escape latencies to the target zone in the day 5 probe trial of Water Maze Test, by Mr1−/− mice that received adoptive transfer of PBS or MAIT cells. g, Escape latencies in each day of reverse training period (day 6–8) in Water Maze Test, by Mr1−/− mice that received adoptive transfer of PBS or MAIT cells. h, Number of entries into the target zone, and escape latencies to the target zone in the day 9 probe trial after reverse training in Water Maze Test, by Mr1+/+ and Mr1−/− mice. i, Percentages of entries into the familiar (F) or novel (N) arm in Y-maze test by 7-month-old Mr1−/− mice treated with glutathione or PBS control. j, Escape latencies in each day of the 4-day training period in Water Maze Test, by Mr1−/− mice treated with glutathione or PBS control. k, Numbers of entries into the target zone in the day 5 probe trial of Water Maze Test, by Mr1−/− mice treated with glutathione or PBS control. Error bars = Mean ± SE. Data are from 9 mice per group, representative of 2 independent experiments (a-c), or are from 10 mice per group, representative of 2 independent experiments (d-k). *P < 0.05, **P < 0.01, n.s = not statistically significant (P > 0.05) using two-sided Student’s t-test (a, c, d, f, h, k), or two-sided two-way ANOVA (b, e, g, j); exact P values are provided in the source data.

Comment in

References

    1. Galea I, Bechmann I & Perry VH What is immune privilege (not)? Trends Immunol 28, 12–18 (2007). - PubMed
    1. Buckley MW & McGavern DB Immune dynamics in the CNS and its barriers during homeostasis and disease. Immunol Rev 306, 58–75 (2022). - PMC - PubMed
    1. Alves de Lima K et al. Meningeal gammadelta T cells regulate anxiety-like behavior via IL-17a signaling in neurons. Nat Immunol 21, 1421–1429 (2020). - PMC - PubMed
    1. Brombacher TM et al. IL-13-Mediated Regulation of Learning and Memory. J Immunol 198, 2681–2688 (2017). - PubMed
    1. Derecki NC et al. Regulation of learning and memory by meningeal immunity: a key role for IL-4. J Exp Med 207, 1067–1080 (2010). - PMC - PubMed

Publication types

LinkOut - more resources