. 2023 Jun;30(2):169-187.
doi: 10.1080/13506129.2022.2141623. Epub 2022 Nov 21.

The flutemetamol analogue cyano-flutemetamol detects myocardial AL and ATTR amyloid deposits: a post-mortem histofluorescence analysis

Affiliations

The flutemetamol analogue cyano-flutemetamol detects myocardial AL and ATTR amyloid deposits: a post-mortem histofluorescence analysis

Eric E Abrahamson et al. Amyloid. 2023 Jun.

Abstract

Background: [18F]flutemetamol is a PET radioligand used to image brain amyloid, but its detection of myocardial amyloid is not well-characterized. This histological study characterized binding of fluorescently labeled flutemetamol (cyano-flutemetamol) to amyloid deposits in myocardium.

Methods: Myocardial tissue was obtained post-mortem from 29 subjects with cardiac amyloidosis including transthyretin wild-type (ATTRwt), hereditary/variant transthyretin (ATTRv) and immunoglobulin light-chain (AL) types, and from 10 cardiac amyloid-free controls. Most subjects had antemortem electrocardiography, echocardiography, SPECT and cardiac MRI. Cyano-flutemetamol labeling patterns and integrated density values were evaluated relative to fluorescent derivatives of Congo red (X-34) and Pittsburgh compound-B (cyano-PiB).

Results: Cyano-flutemetamol labeling was not detectable in control subjects. In subjects with cardiac amyloidosis, cyano-flutemetamol labeling matched X-34- and cyano-PiB-labeled, and transthyretin- or lambda light chain-immunoreactive, amyloid deposits and was prevented by formic acid pre-treatment of myocardial sections. Cyano-flutemetamol mean fluorescence intensity, when adjusted for X-34 signal, was higher in the ATTRwt than the AL group. Cyano-flutemetamol integrated density correlated strongly with echocardiography measures of ventricular septal thickness and posterior wall thickness, and with heart mass.

Conclusion: The high selectivity of cyano-flutemetamol binding to myocardial amyloid supports the diagnostic utility of [18F]flutemetamol PET imaging in patients with ATTR and AL types of cardiac amyloidosis.

Keywords: amyloid; cardiac; flutemetamol; lambda light chain; positron emission tomography; transthyretin.


Conflict of interest statement

Disclosure statement

MDI served as a consultant and received research funding from GE Healthcare. SD received research funding from GE Healthcare. JD and GF are employees of GE Healthcare. EEA, RFP and VLV have nothing to disclose.

Figures

Figure 1.
Figure 1.
Fluorescence photomicrographs of transmural sections of left ventricular myocardium from a no amyloidosis control subject (A) and subjects diagnosed with ATTRwt cardiac amyloidosis (B, C, D). Each row represents a single myocardial section processed for multi-fluorescence labeling using cyano-flutemetamol (“Cyano-flutemetamol”; A1-B1-C1-D1 series, blue fluorescence) and antibodies against cardiac myocyte actin (“Cardiomyocytes”, A2-B2-C2-D2 series, red fluorescence) and against collagen (“Collagen-IV”, A3-B3-C3-D3 series, green fluorescence). Merged fluorescence images that additionally contain the nuclear marker DRAQ5 (yellow fluorescence) are shown in the rightmost column (“Merge + DRAQ5”, A4-B4-C4-D4 series). In the myocardial section from the non-amyloid control sample, there is no detectable cyano-flutemetamol signal (A1) in the areas with normal cardiomyocyte cytoarchitecture (A2) or in the areas with collagen labeled extracellular matrix and blood vessels (A3). In myocardial sections from ATTRwt samples, cyano-flutemetamol fluorescence labels patchy (B1) or diffuse/confluent (C1) patterns of amyloid deposits surrounding the cardiomyocytes which exhibit disrupted cytoarchitecture and intertwine with collagen-containing structures in the interstitium (B4, C4), or a vascular pattern exemplified by a large blood vessel which appears completely occluded with cyano-flutemetamol labeled amyloid (D1). Scale bar = 50 μm.
Figure 2.
Figure 2.
Fluorescence photomicrographs of transmural sections of left ventricular myocardium from subjects diagnosed with ATTR amyloidosis due to a mutation in the TTR gene (ATTRv, see Table 1 for mutation information) (A, B) and from subjects diagnosed with AL cardiac amyloidosis (C, D). Each row represents a single myocardial section processed for multi-fluorescence labeling using cyano-flutemetamol (“Cyano-flutemetamol”, A1-B1-C1-D1 series, blue fluorescence) and antibodies against cardiac myocyte actin (“Cardiomyocytes”, A2-B2-C2-D2 series, red fluorescence) and against collagen (“Collagen-IV”, A3-B3-C3-D3 series, green fluorescence). Merged fluorescence images that additionally contain the nuclear marker DRAQ5 (yellow fluorescence) are in the rightmost column (“Merge + DRAQ5”, A4-B4-C4-D4 series). Cyano-flutemetamol labeled amyloid deposits have a patchy (A1, B1), diffuse/confluent (C1) or mixed pattern involving blood vessels (D1); they appear to alter the cardiomyocyte architecture to much greater extent in the ATTRv samples (A4, B4) than in the AL samples (C4, D4). Scale bar = 50 μm.
Figure 3.
Figure 3.
Fluorescence photomicrographs of transmural sections of left ventricular myocardium from subjects diagnosed with ATTRwt, ATTRv or AL type of cardiac amyloidosis. A-C: There is a close correspondence of cyano-flutemetamol signal (A1, B1, C1) with the immunofluorescence signal obtained using the anti-transthyretin antibody in the ATTRwt samples (A2) and ATTRv samples (B2) and with the immunofluorescence signal obtained using the anti-lambda light chain antibody in the AL (lambda) sample (C2). Each row illustrates a single myocardial section stained with cyano-flutemetamol and immunofluorescence; merged fluorescence images are in the rightmost column (A3, B3, C3). D: In a myocardial section from a ATTRwt diagnosed subject, cyano-flutemetamol signal is prominent in the absence of formic acid pre-treatment (D1). In the immediately adjacent section, pre-treatment with formic acid prevented cyano-flutemetamol staining (D2) while it did not affect the anti-transthyretin immunofluorescence signal in amyloid deposits (D3). Scale bar = 100 μm (A-C series), 200 μm (D series).
Figure 4.
Figure 4.
Fluorescence photomicrographs of transmural sections of left ventricular myocardium from a non-amyloid control subject (A) and three subjects diagnosed with ATTRwt cardiac amyloidosis (B, C, D) stained with the fluorescent amyloid-binding compounds cyano-flutemetamol (A1-B1-C1-D1 series, blue fluorescence), X-34 (A2-B2-C2-D2 series, cyan-green fluorescence) and cyano-PiB (A3-B3-C3-D3 series, blue fluorescence). Each row shows three consecutive myocardial sections (1-2-3). Myocardial sections from the non-amyloid control subject show no signal for all three fluorescent markers of amyloid (A). The ATTRwt samples show a close correspondence of cyano-flutemetamol, X-34 and cyano-PiB fluorescence labeling patterns representative of diffuse/confluent (B), patchy/nodular (C) and vascular (D). Scale bar = 100 μm (A series), 200 μm (B-D series).
Figure 5.
Figure 5.
Fluorescence photomicrographs of transmural sections of left ventricular myocardium from subjects diagnosed with ATTRv (A, B) or AL (C, D) cardiac amyloidosis stained with the histofluorescent amyloid-binding compounds cyano-flutemetamol (A1-B1-C1-D1 series, blue fluorescence), X-34 (A2-B2-C2-D2 series, cyan-green fluorescence), and cyano-PiB (A3-B3-C3-D3 series, blue fluorescence). Each row shows three consecutive myocardial sections (1-2-3) from representative subjects showing close correspondence of the three markers in amyloid deposits with a diffuse/confluent pattern (A), patchy/nodular (B), vascular (C) or a mixed pattern (D). Scale bar = 200 μm.
Figure 6.
Figure 6.
(A) Quantification of mean fluorescence intensity of cyano-flutemetamol, X-34, and cyano-PiB in immediately adjacent transmural sections of left ventricular myocardium from subjects diagnosed with ATTRwt amyloidosis (ATTR; blue-colored open circles), ATTRv (ATTRv; red-colored open squares) or AL amyloidosis (green-colored open triangles). Mean fluorescence intensity of each stain was compared within each diagnostic group by analysis of variance (ANOVA) and pairwise comparisons were using the Tukey multiple comparison test: ANOVA (ATTR) F (2, 51) = 3.127, P = 0.0523; ANOVA (ATTRv) F (2, 6) = 17.8200, P = 0.0030; ANOVA (AL) F (2, 21) = 7.0170 P = 0.0046 (brackets indicate pairwise differences p < 0.05). (B) The ratios of the mean fluorescence intensity of cyano-labeled compounds to X-34 for each diagnostic group were compared by ANOVA: F (5, 52) = 3.839, P = 0.0049 (brackets indicate pairwise differences p < 0.05 determined by the Tukey multiple comparisons test). (C-E) Integrated density values for cyano-flutemetamol (C), X-34 (D) and cyano-PiB (E) were compared among diagnostic groups by ANOVA and pairwise comparisons were made using the Tukey multiple comparison test: ANOVA (cyano-flutemetamol) F (2, 26) = 5.985, P = 0.0073; ANOVA (X-34) F (2, 26) = 1.933, P = 0.1649; ANOVA (cyano-PiB) F (2, 26) = 3.329, P = 0.0516 (brackets indicate pairwise differences p < 0.05). (F-H) Correlation graphs of X-34 with cyano-flutemetamol (F) or cyano-PiB (G), and cyano-flutemetamol with cyano-PiB (H) histofluorescence signal in ATTRwt samples (blue-colored open circles), ATTRv samples (red-colored open squares) or AL samples (green-colored open triangles) amyloidosis. Correlations were assessed calculating the Pearson correlation coefficient: r = 0.8818, P < 0.0001 (cyano-flutemetamol with X-34); r = 0.8994, P < 0.0001 (cyano-PiB with X-34); r = 0.9751, P < 0.0001 (cyano-flutemetamol with cyano-PiB).
Figure 7.
Figure 7.
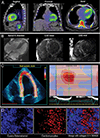
Cardiovascular imaging and post-mortem cyano-flutemetamol fluorescence in a 74-year-old Caucasian male (subject 16) with ATTRwt cardiac amyloidosis, diabetes, hypertension and hyperlipidemia. Cardiovascular images (A-C) were obtained three months prior to sudden death. (A) SPECT/CT fusion images show diffuse grade 3 myocardial uptake of [99mTc]pyrophosphate (myocardial uptake > rib uptake). (B) Cardiac MR reveals a moderately thickened left ventricle (17 mm septum), left ventricular ejection fraction of 31%, a large amount of circumferential, subendocardial late gadolinium enhancement (LGE) involving all basal, mid and apical segments of the left ventricle, and an extracellular volume of 0.42. (C) An echocardiogram shows moderate concentric left ventricle thickening and a global longitudinal strain of −8.2% with a relative apical sparing pattern. Autopsy revealed cardiomegaly (heart weight of 520 g, normal 270–360 g) and extensive diffuse amyloidosis with immunohistochemical confirmation of transthyretin amyloidosis. In the absence of genotyping this was presumed to be wildtype ATTR cardiac amyloidosis. (D) Cyano-flutemetamol fluorescence labels extensive diffuse amyloid deposits which are associated with loss of ACTC1-immunoreactive cardiomyocytes in the same areas. Scale bar = 50 μm.
Figure 8.
Figure 8.
Cardiovascular imaging and post-mortem cyano-flutemetamol fluorescence in a 39-year-old male (subject 29) of Portuguese descent with ATTRv cardiac amyloidosis resulting from a ser22Asn transthyretin gene mutation. Cardiovascular images (A-B) were obtained less than six months prior to death due to arrhythmic cardiac arrest and a motor vehicle crash with fatal complications. (A) SPECT/CT fused images show diffuse grade 3 myocardial uptake of [99mTc]pyrophosphate (myocardial uptake > rib uptake). (B) Cardiac MR reveals a severely thickened left ventricle (22 mm septum), reduced left ventricular ejection fraction of 37%, and a large amount of transmural, concentric late gadolinium enhancement (LGE) involving all basal, mid and apical segments of the left ventricle. Autopsy revealed severe cardiomegaly (heart weight of 940 gm, normal 270–360g), extensive amyloidosis, and myocardial ischemia and microinfarcts likely from amyloidosis. (C) Cyano-flutemetamol fluorescence labels amyloid deposits which are extensive and associated with loss of ACTC1-immunoreactive cardiomyocytes. Scale bar = 50 μm.
Figure 9.
Figure 9.
Cardiovascular imaging (A-B) and post-mortem cyano-flutemetamol fluorescence (C) in a 71-year-old African American female (subject 38) with multiple myeloma and AL cardiac amyloidosis, who died of progressive heart failure. (A) Echocardiography (3 months prior) shows a mildly and concentrically thickened left ventricle (12 mm wall thickness). (B) Cardiac MR imaging (3 years prior) reveals normal left ventricular mass, with a left ventricular ejection fraction of 51%, and a large amount of diffuse subendocardial, near circumferential late gadolinium enhancement (LGE) involving most myocardial segments and atria (not shown). Autopsy revealed cardiomegaly (heart weight of 590 gm, normal 270–360g), diffuse replacement fibrosis and marked amyloid deposits in walls of large to small vessels. (C) Cyano-flutemetamol fluorescence labels amyloid deposits in the interstitium and blood vessels and is associated with loss of ACTC1-immunoreactive cardiomyocytes. Scale bar = 50 μm.

Similar articles

Cited by

References

    1. Lutter L, Aubrey LD, Xue WF. On the Structural Diversity and Individuality of Polymorphic Amyloid Protein Assemblies. J Mol Biol. 2021;433(20):167124. - PubMed
    1. Sipe JD, Benson MD, Buxbaum JN, et al. Amyloid fibril proteins and amyloidosis: chemical identification and clinical classification International Society of Amyloidosis 2016 Nomenclature Guidelines. Amyloid. 2016;23(4):209–213. - PubMed
    1. Shah KB, Inoue Y, Mehra MR. Amyloidosis and the heart: a comprehensive review. Arch Intern Med. 2006;166(17):1805–1813. - PubMed
    1. Smith TJ, Kyle RA, Lie JT. Clinical significance of histopathologic patterns of cardiac amyloidosis. Mayo Clin Proc. 1984;59(8):547–555. - PubMed
    1. Larsen BT, Mereuta OM, Dasari S, et al. Correlation of histomorphological pattern of cardiac amyloid deposition with amyloid type: a histological and proteomic analysis of 108 cases. Histopathology. 2016;68(5):648–656. - PubMed