. 2022 Nov 22:11:e81167.
doi: 10.7554/eLife.81167.

Revealing druggable cryptic pockets in the Nsp1 of SARS-CoV-2 and other β-coronaviruses by simulations and crystallography

Affiliations

Revealing druggable cryptic pockets in the Nsp1 of SARS-CoV-2 and other β-coronaviruses by simulations and crystallography

Alberto Borsatto et al. Elife. .

Abstract

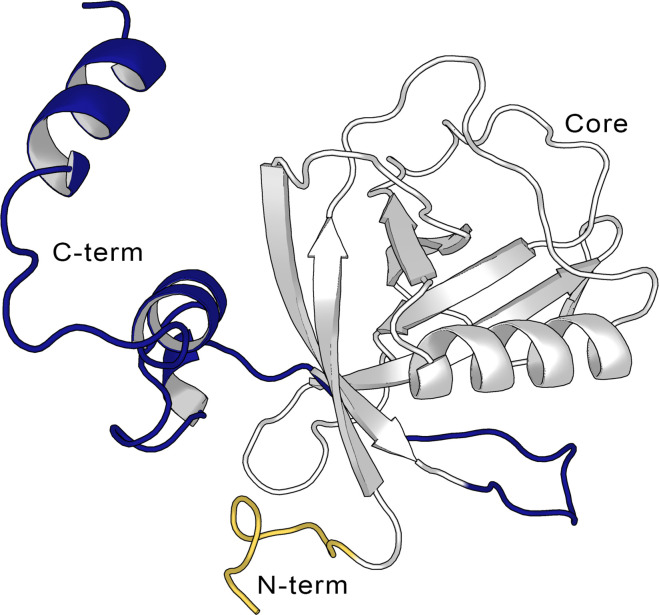
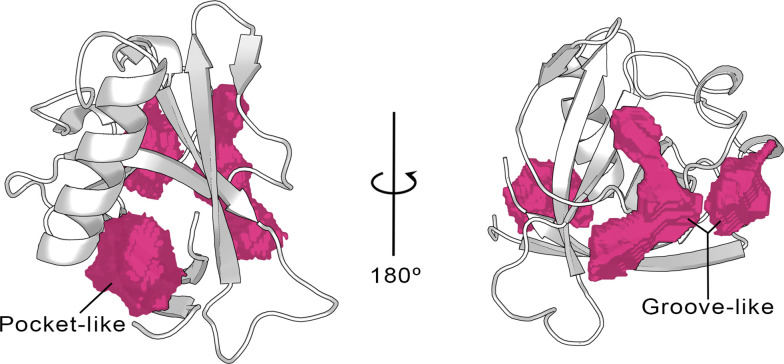
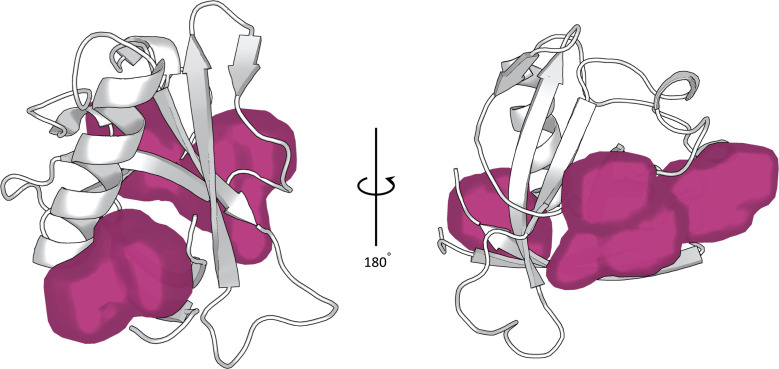
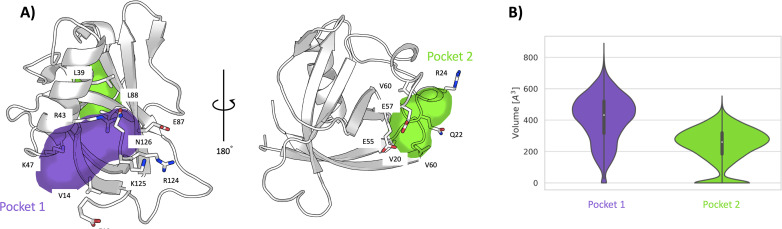
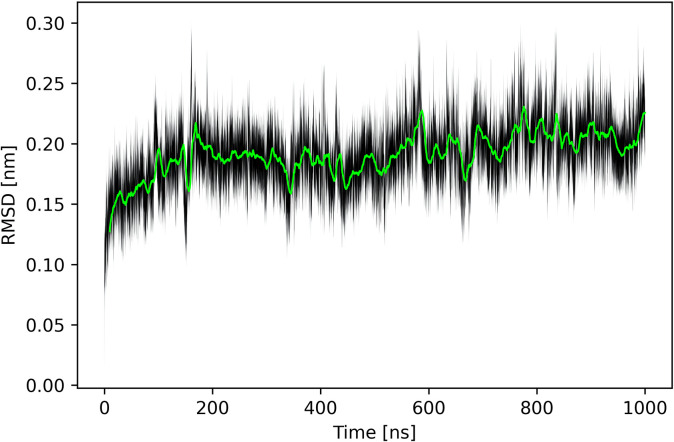
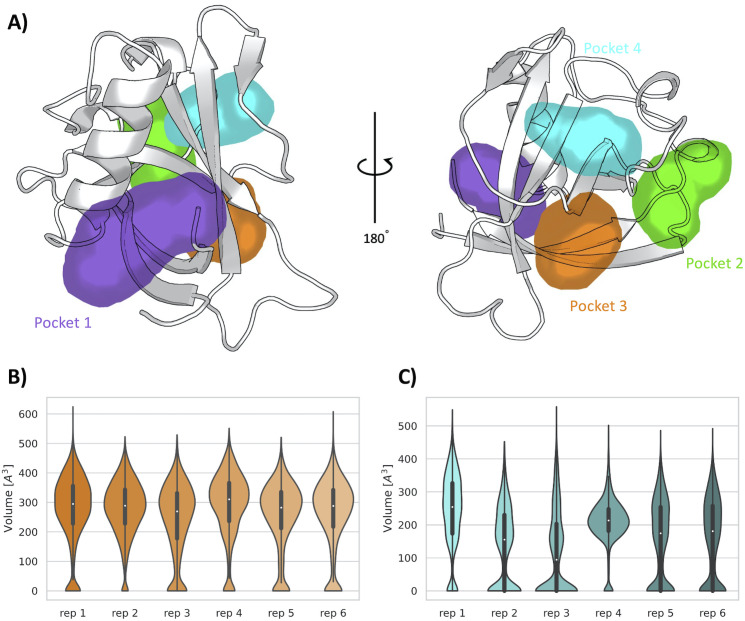
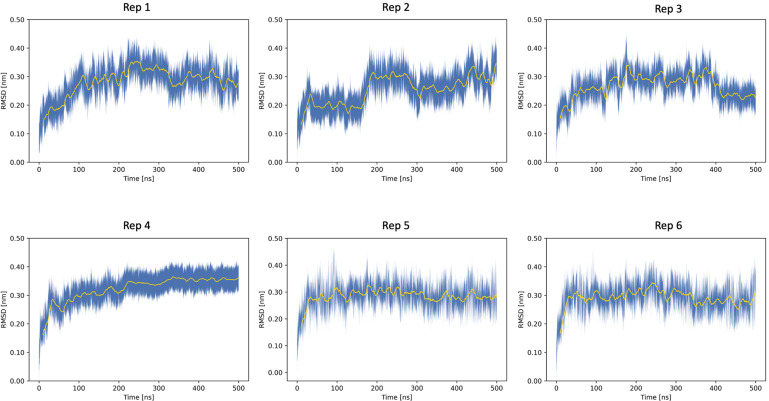
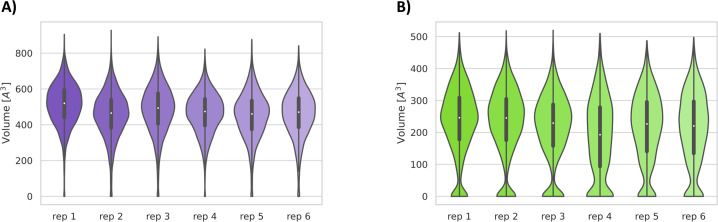
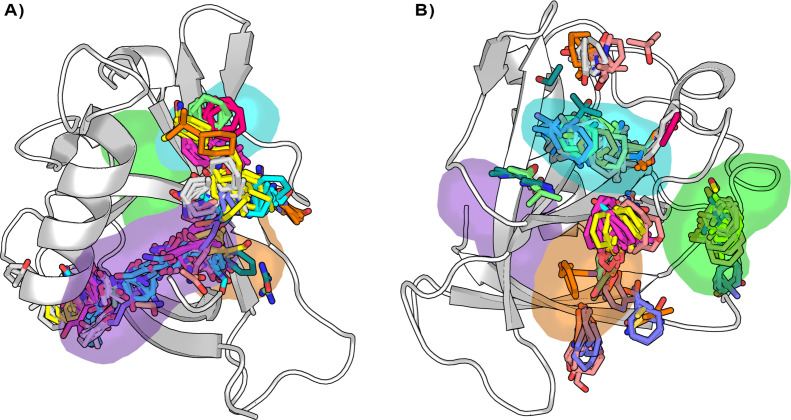
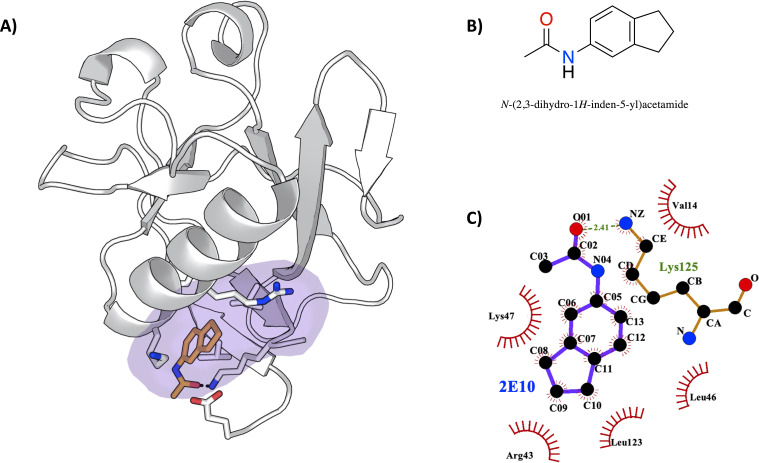
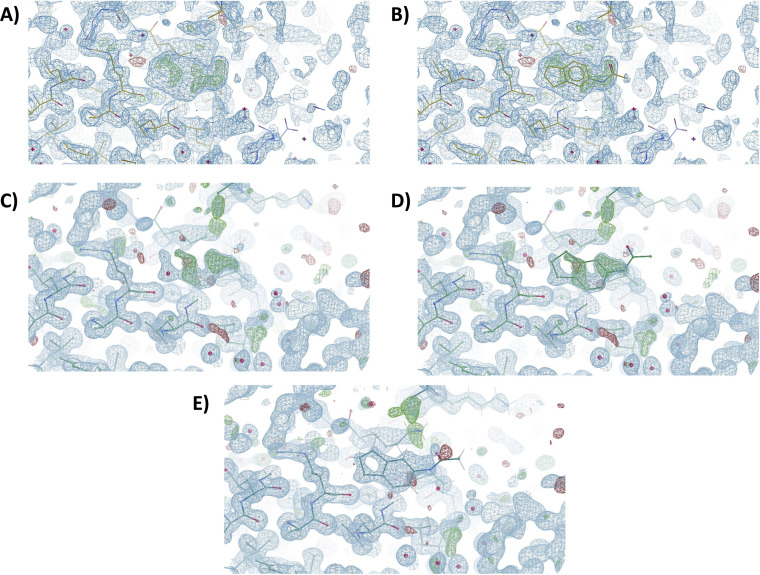
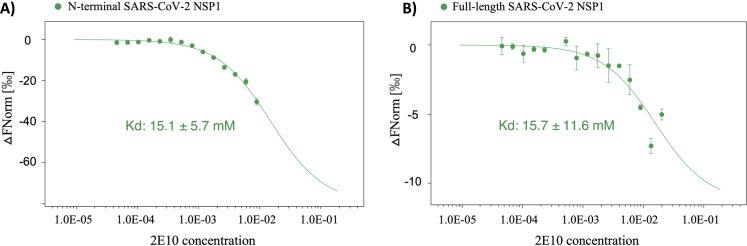
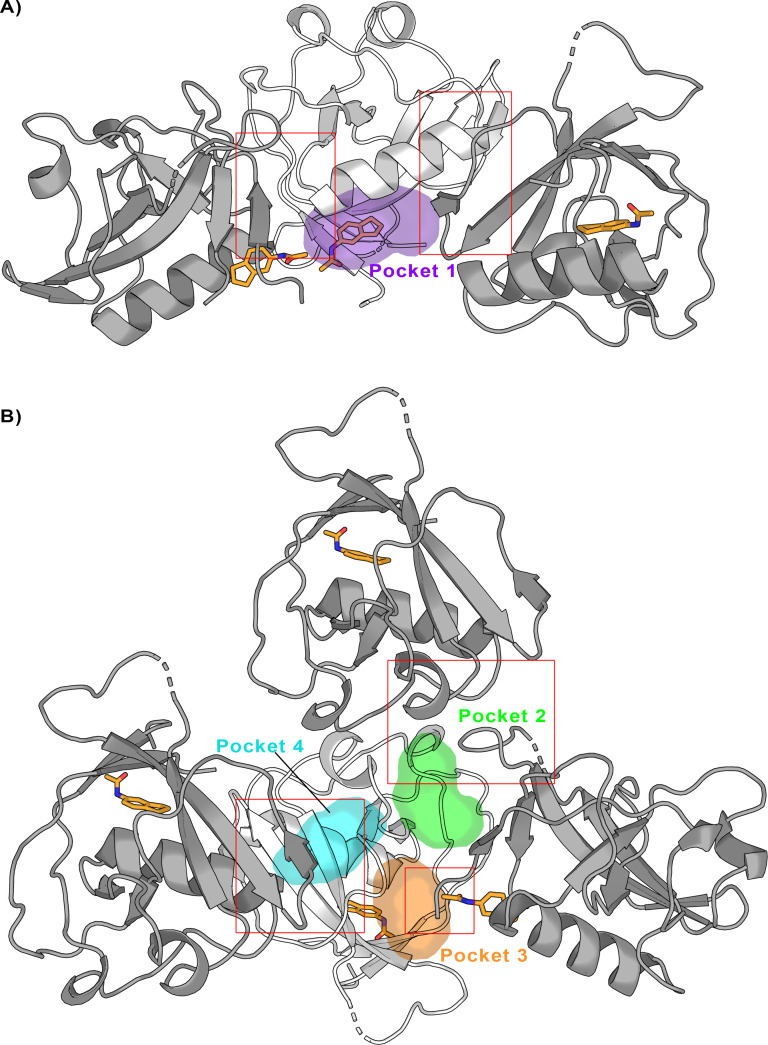
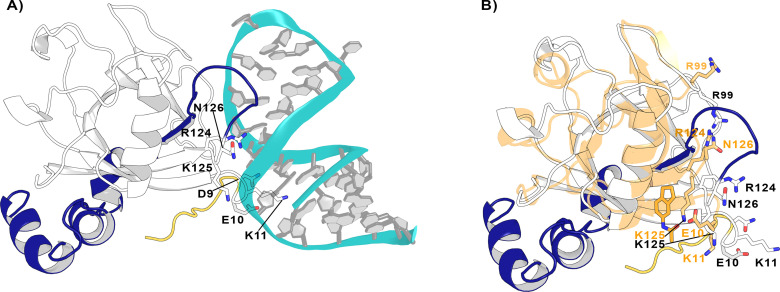
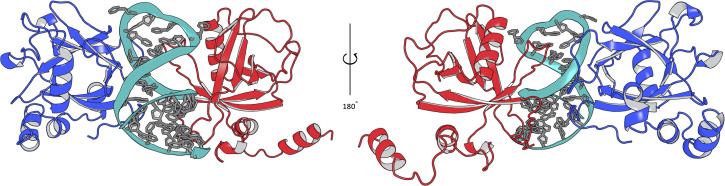
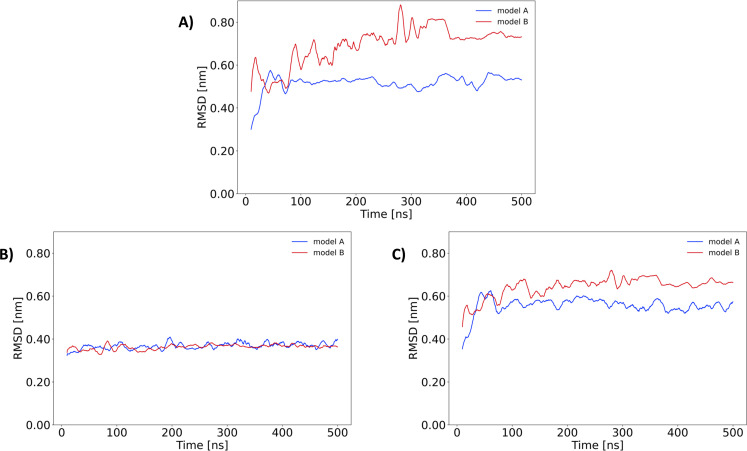
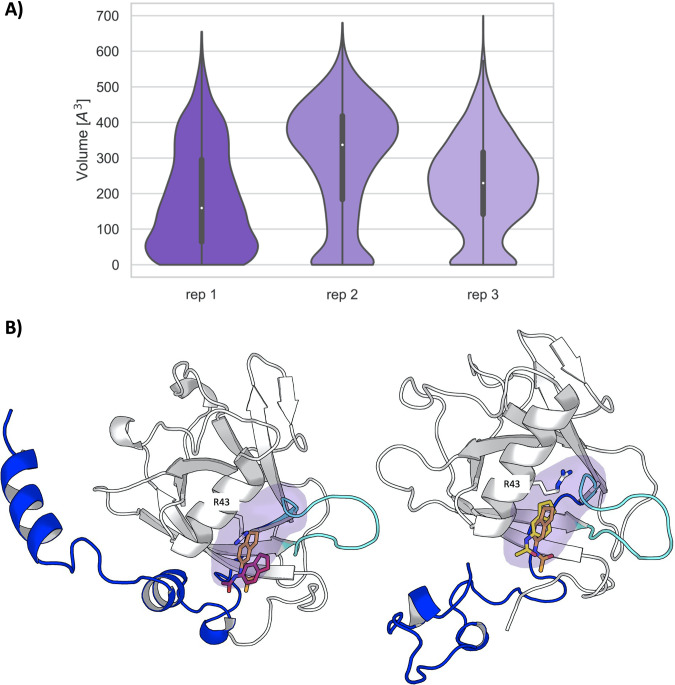
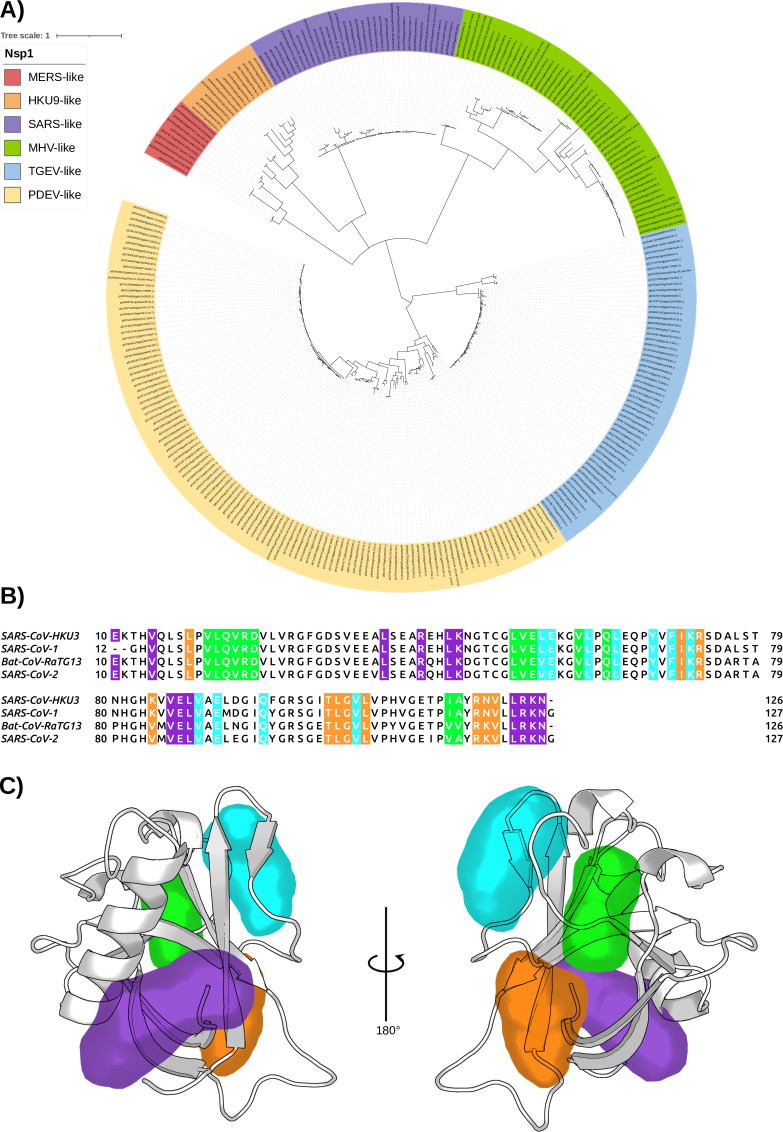
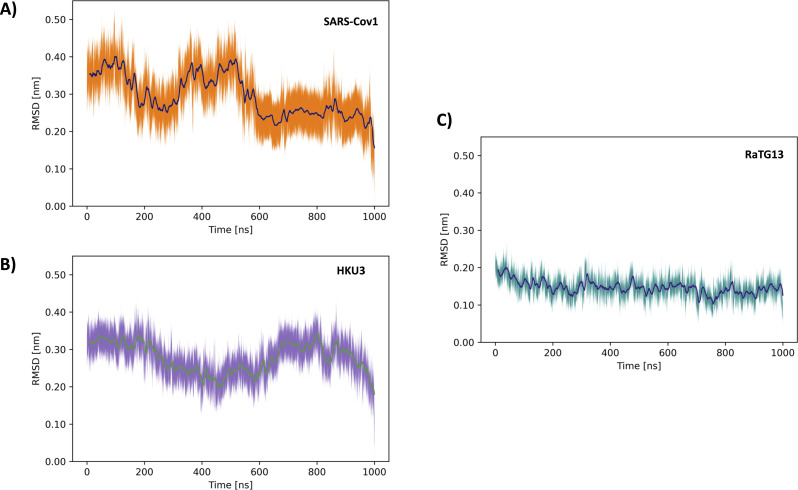
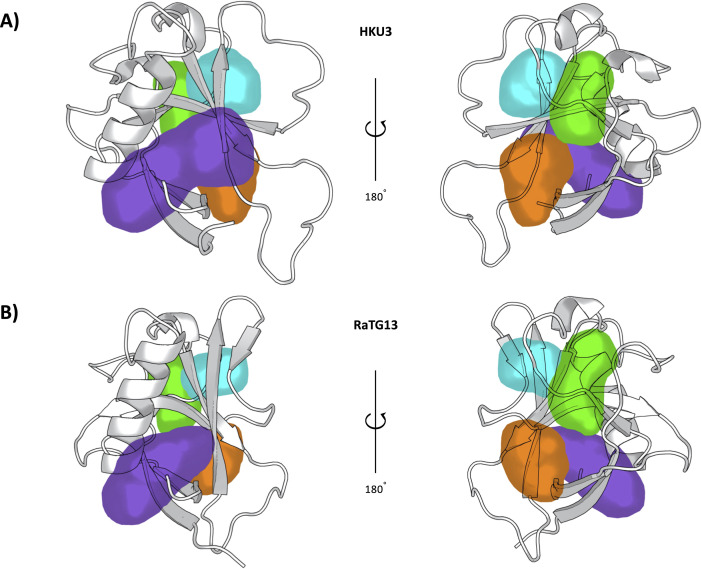
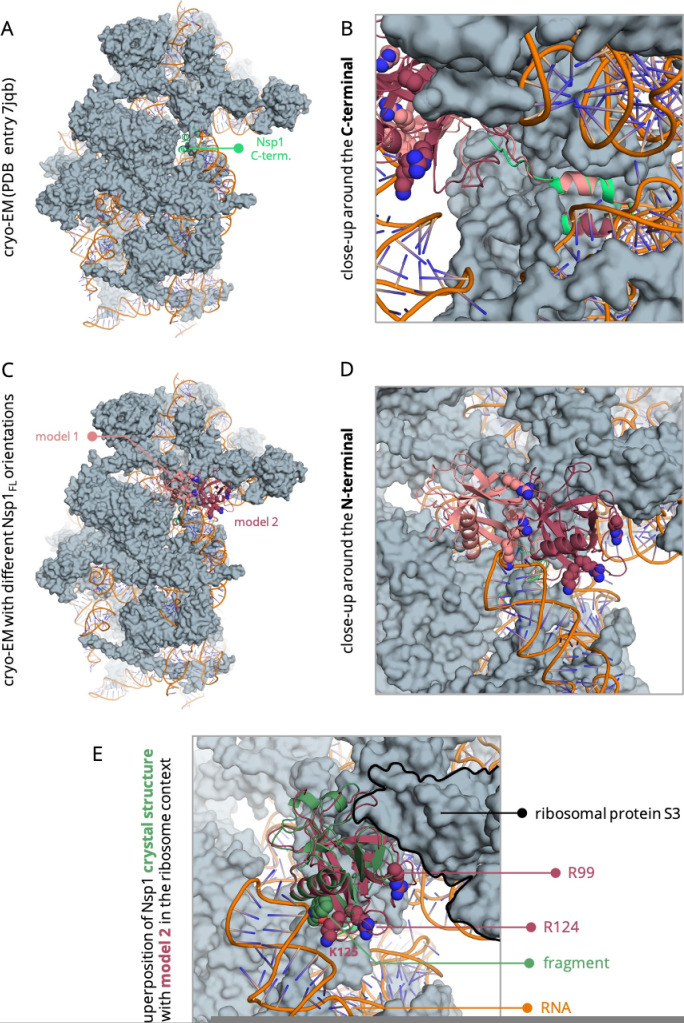
Non-structural protein 1 (Nsp1) is a main pathogenicity factor of α- and β-coronaviruses. Nsp1 of severe acute respiratory syndrome coronavirus 2 (SARS-CoV-2) suppresses the host gene expression by sterically blocking 40S host ribosomal subunits and promoting host mRNA degradation. This mechanism leads to the downregulation of the translation-mediated innate immune response in host cells, ultimately mediating the observed immune evasion capabilities of SARS-CoV-2. Here, by combining extensive molecular dynamics simulations, fragment screening and crystallography, we reveal druggable pockets in Nsp1. Structural and computational solvent mapping analyses indicate the partial crypticity of these newly discovered and druggable binding sites. The results of fragment-based screening via X-ray crystallography confirm the druggability of the major pocket of Nsp1. Finally, we show how the targeting of this pocket could disrupt the Nsp1-mRNA complex and open a novel avenue to design new inhibitors for other Nsp1s present in homologous β-coronaviruses.

Keywords: SARS-CoV-2; X-ray crystallography; cryptic pockets; drug discovery; molecular biophysics; molecular dynamics; none; structural biology.


Conflict of interest statement

AB, OA, IG, SM, SD, FK, CE, FG No competing interests declared, SH Reviewing editor, eLife

Figures

Figure 1.
Figure 1.. Structure of the full-length SARS-CoV-2 Nsp1.
Cartoon representation of the full-length non-structural protein 1 (Nsp1) structure from the AlphaFold (Jumper et al., 2021; Varadi et al., 2022) model, showing the N-terminus (in yellow, aa Met1-Asn9), the Nsp1N core (in gray, aa Glu10-Asn126), and the C-terminus (blue, aa Gly127-Gly180).
Figure 2.
Figure 2.. Cavities identified on the Nsp1N crystal structure (tPDB entry 7K7P) by the ProteinPlus server for the concave pocket-like structure between the β-barrel and the α-helix and the groove-like topology.
Figure 2—figure supplement 1.
Figure 2—figure supplement 1.. Cavities identified by the Fpocket software on the Nsp1N crystal structure (PDB entry 7K7P) (Le Guilloux et al., 2009).
Figure 3.
Figure 3.. Pockets revealed from unbiased simulations.
(A) Cavities identified on Nsp1N along the 1 μs unbiased molecular dynamics (MD) simulation, namely pocket 1 (purple) and pocket 2 (green), with the main residues displayed in sticks. (B) The volume distribution of each pocket along the unbiased MD simulations.
Figure 3—figure supplement 1.
Figure 3—figure supplement 1.. Time average of the root-mean-square deviation (RMSD) for Nsp1N.
The black shaded area delimits the RMSD values within two standard deviations from the time average.
Figure 4.
Figure 4.. Pockets revealed from SWISH simulations.
(A) Pockets sampled during the 500 ns of replica-exchange SWISH (sampling water interfaces through scaled Hamiltonians) simulations. Volume distributions of the cryptic binding sites pocket 3 (B) and pocket 4 (C) along the six replicas of the SWISH simulations.
Figure 4—figure supplement 1.
Figure 4—figure supplement 1.. Time averages of the root-mean-square deviation (RMSD) for Nsp1N across the six SWISH (sampling water interfaces through scaled Hamiltonians) replicas.
The blue shaded area delimits the RMSD values within two standard deviations from the time average.
Figure 4—figure supplement 2.
Figure 4—figure supplement 2.. Violin plots of the pocket volumes.
Volume distributions of the cryptic binding sites pocket 1 (A) and pocket 2 (B) along the six replicas of the SWISH (sampling water interfaces through scaled Hamiltonians) simulation of severe acute respiratory syndrome coronavirus 2 (SARS-CoV-2) Nsp1N.
Figure 5.
Figure 5.. Distribution of the binding hotspots on the Nsp1N surface around (A) pocket 1 and (B) pockets 2, 3, and 4.
Multiple consensus clusters are shown in sticks. Each consensus cluster is represented in different colors.
Figure 6.
Figure 6.. Characterization of the severe acute respiratory syndrome coronavirus 2 (SARS-CoV-2) non-structural protein 1 (Nsp1)-2E10 complex.
(A) Binding pose of the fragment hit obtained by crystal soaking and structure determination methods. The fragment is located in pocket 1. (B) Chemical structure and name of fragment hit. (C) Magnification of the Nsp1N –2E10 binding pocket showing the interactions the fragment establishes with residues of Nsp1. Hydrophobic interactions are shown by red half-moons and the hydrogen bond interaction is displayed with a dotted green line.
Figure 6—figure supplement 1.
Figure 6—figure supplement 1.. Pan-Dataset Density Analysis (PanDDA) event map and standard single dataset map focused on the severe acute respiratory syndrome coronavirus 2 (SARS-CoV-2) Nsp1N binding site of fragment hit 2E10.
PanDDA event map (A) without ligand and (B) in the presence of 2E10. Standard single dataset (D) map with and (C) without ligand 2E10. (E) Refined standard single dataset map with ligand 2E10. The sigma level for both the standard single dataset map and PanDDA maps is 1.
Figure 6—figure supplement 2.
Figure 6—figure supplement 2.. Microscale thermophoresis (MST) measurements of the binding affinity between fragment hit 2E10 and severe acute respiratory syndrome coronavirus 2 (SARS-CoV-2) non-structural protein 1 (Nsp1).
(A) Concentration-response plot of fragment hit 2E10 and SARS-CoV-2 Nsp1N domain. (B) Concentrations-response curve of 2E10 and SARS-CoV-2 Nsp1 FL. All measurements were conducted at least in triplicate.
Figure 7.
Figure 7.. Crystal packing of the Nsp1N-fragment complex (PDB entry 8A4Y) was obtained from X-ray soaking experiments.
The direct crystal contacts around (A) pocket 1 and (B) pockets 2, 3, and 4 are highlighted with squares.
Figure 8.
Figure 8.. Nsp1FL-RNA complex obtained from the HADDOCK program.
(A) Residues in the proximity of pocket 1 involved in crucial Nsp1FL-SL1 contacts are displayed in sticks. (B) Crystal structure from soaking experiments (orange transparent cartoon) is superimposed over the Nsp1FL of the Nsp1FL-RNA model. The most important residues for the Nsp1FL-RNA interaction are highlighted in white (Nsp1FL model) and orange (PDB entry 8A4Y from our soaking experiments) sticks. Figures obtained from model A.
Figure 8—figure supplement 1.
Figure 8—figure supplement 1.. Different Nsp1FL-RNA models proposed in this work.
The Nsp1FL from model A (blue) and B (red) are represented.
Figure 8—figure supplement 2.
Figure 8—figure supplement 2.. RMSD for model A and B of the Nsp1-RNA complex.
Root-mean-square deviation (RMSD, nm) along the 500 ns of unbiased molecular dynamics (MD) simulations considering (A) the backbone atoms of the Nsp1FL protein from the Nsp1FL-RNA complex, (B) only the RNA atoms of the stem loop 1 (SL1) from the complex and (C) the backbone atoms of Nsp1FL and all the RNA atoms of the full Nsp1FL-RNA complex.
Figure 8—figure supplement 3.
Figure 8—figure supplement 3.. Ligand accesibility to pocket 1 in Nsp1FL.
(A) Volume distribution of pocket 1 along the three unbiased molecular dynamics (MD) simulations of the Nsp1FL. (B) Docked poses of the fragment to the representative structure from the most populated cluster in replica 3 (left) and to the second most populated cluster in replica 2 (right). The original crystallographic pose is depicted in orange, whereas the docked poses in pink and yellow. The flexible loop comprising aa Arg124-Gly137 is displayed is cyan. N- and the C-terminal are depicted in purple and blue, respectively.
Figure 9.
Figure 9.. The conservation of Nsp1 sequence.
(A) Phylogenetic tree based on 283 sequences from distinct α- and β-coronaviruses (CoVs) of different subgenera. The sequences were obtained from the Conserved Domain Database (CDD) with accession number cl41742. The scale bar indicates the number of substitutions per site in the amino acid sequence. Six different Nsp1 domain models can be identified, two for the α-CoVs (transmissible gastroenteritis virus [TGEV]-like and PDEV-like), and four for the β-CoVs genus (MERS-like, HKU9-like, SARS-like, and murine hepatitis virus [MHV]-like). (B) Multi-sequence alignment of the four homologues selected. The alignment was performed with the MUSCLE algorithm (Edgar, 2004). The residues of the different pockets are highlighted in the corresponding color, namely pocket 1 in purple, pocket 2 in green, pocket 3 in orange, and pocket 4 in cyan. (C) Representation of the pockets found in the severe acute respiratory syndrome coronavirus 1 (SARS-CoV-1) Nsp1N variant.
Figure 9—figure supplement 1.
Figure 9—figure supplement 1.. Time averages of the backbone root-mean-square deviation (RMSD) along the 1 μs unbiased molecular dynamics (MD) simulation for Nsp1N of (A) severe acute respiratory syndrome coronavirus 1 (SARS-CoV-1), (B) SARS-HKU3, and (C) Bat-CoV-RatG13.
The shaded area delimits the RMSD values within two standard deviations from the time average.
Figure 9—figure supplement 2.
Figure 9—figure supplement 2.. Representation of the pockets found in the Bat-CoV-HKU3 (A) and Bat-Cov-RaTG13 (B) Nsp1N variants.
Author response image 1.
Author response image 1.. Model of the full-length Nsp1 based on the cryo-EM structure of the C-terminal bound to the ribosome (PDB entry 7jqb).
.

References

    1. Abraham MJ, Murtola T, Schulz R, Páll S, Smith JC, Hess B, Lindahl E. GROMACS: high performance molecular simulations through multi-level parallelism from laptops to supercomputers. SoftwareX. 2015;1–2:19–25. doi: 10.1016/j.softx.2015.06.001. - DOI
    1. Afsar M, Narayan R, Akhtar MN, Das D, Rahil H, Nagaraj SK, Eswarappa SM, Tripathi S, Hussain T. Drug targeting nsp1-ribosomal complex shows antiviral activity against SARS-cov-2. eLife. 2022;11:e74877. doi: 10.7554/eLife.74877. - DOI - PMC - PubMed
    1. Andersen KG, Rambaut A, Lipkin WI, Holmes EC, Garry RF. The proximal origin of SARS-cov-2. Nature Medicine. 2020;26:450–452. doi: 10.1038/s41591-020-0820-9. - DOI - PMC - PubMed
    1. Antczak M, Popenda M, Zok T, Sarzynska J, Ratajczak T, Tomczyk K, Adamiak RW, Szachniuk M. New functionality of rnacomposer: an application to shape the axis of mir160 precursor structure. Acta Biochimica Polonica. 2016;63:737–744. doi: 10.18388/abp.2016_1329. - DOI - PubMed
    1. Berendsen HJC, Postma JPM, van Gunsteren WF, DiNola A, Haak JR. Molecular dynamics with coupling to an external bath. J Chem Phys. 1984;81:3684–3690. doi: 10.1063/1.448118. - DOI

Publication types

Substances